Key Stats for AMZN Stock
- Past week’s performance: Consolidating
- 52-week range: $196 to $287
- Valuation model target price: $382
- Implied upside: 50.5% over 2.3 years
Value your favorite stocks like AMZN with 5 years of analysts’ forecasts using TIKR’s new Valuation Model (It’s free) >>>
A Cloud Outage Meets a Capacity Boom
Amazon (AMZN) stock trades about 14% below its 52-week high of $287. That’s despite the company just posting its fastest AWS growth in 18 quarters. This week’s headline wasn’t about earnings though. AWS confirmed it cannot restore access to its Bahrain cloud region or one UAE availability zone after damage tied to regional conflict, and it’s telling affected customers to rebuild elsewhere.
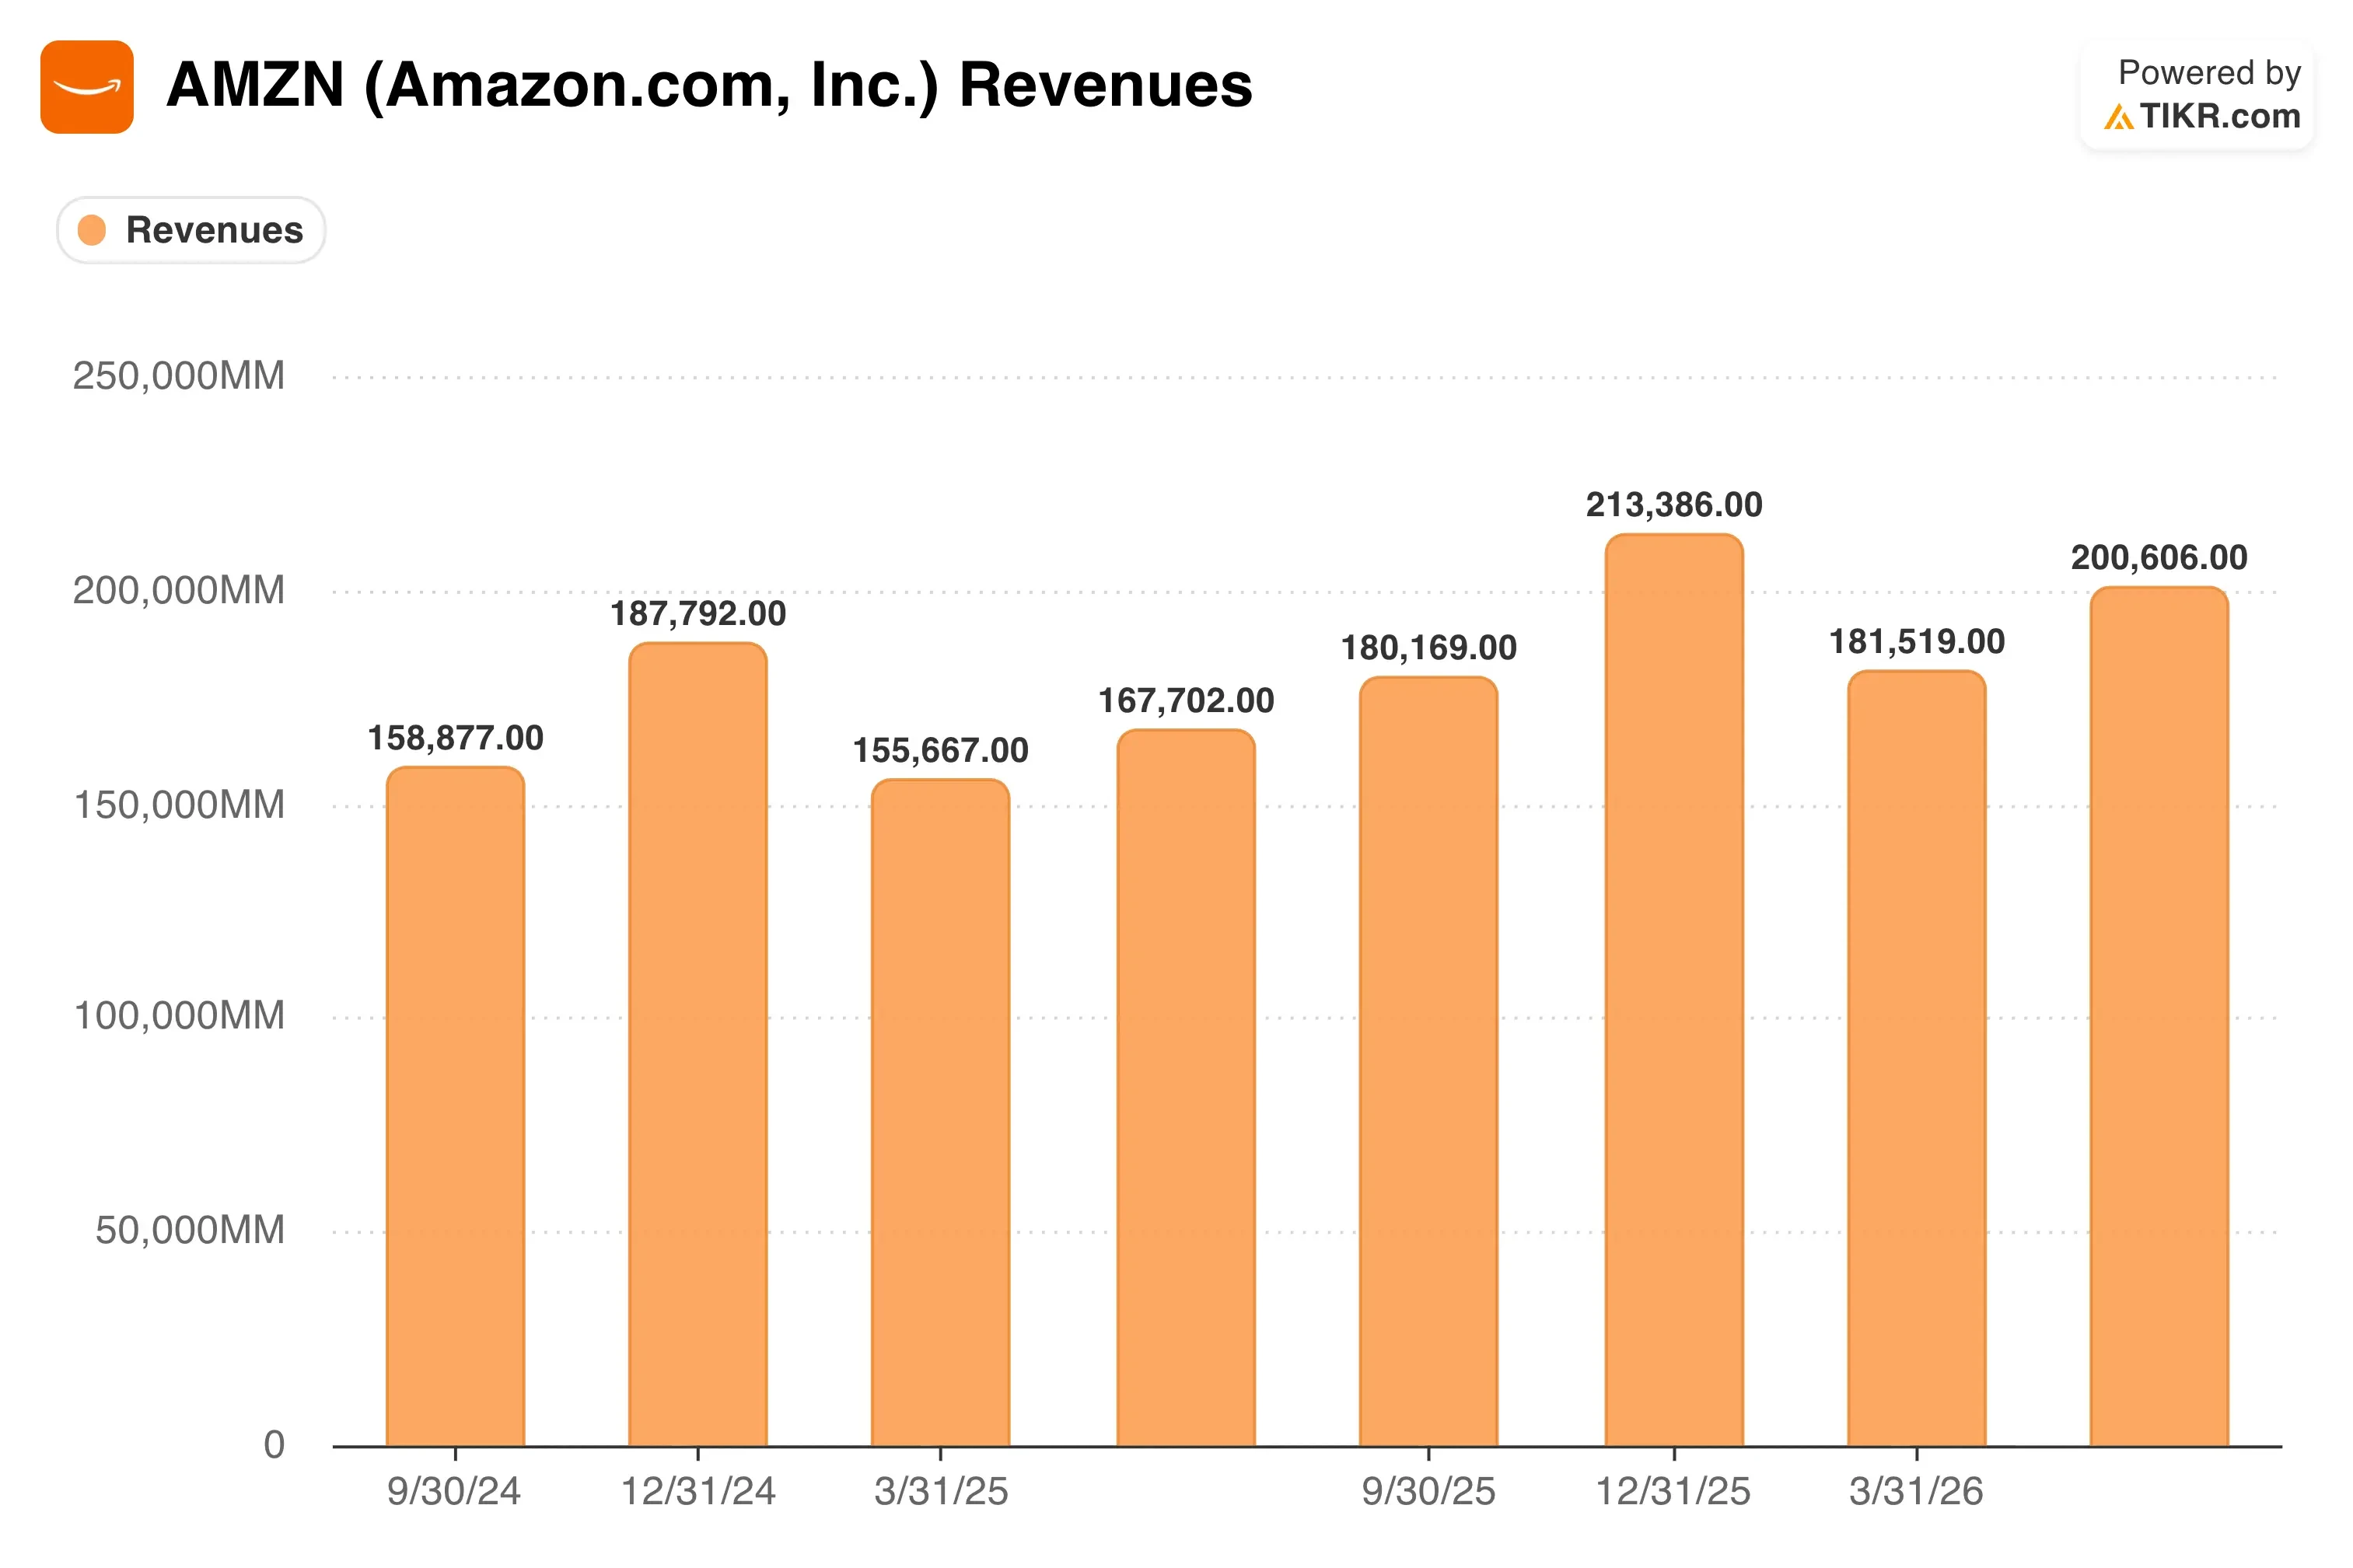
That’s a sobering admission from a cloud provider whose entire pitch rests on reliability. But it comes against a backdrop of extraordinary growth elsewhere. AWS revenue grew 36.7% year over year last quarter, the fifth straight quarter of acceleration. CEO Andy Jassy said the company still won’t have “enough capacity to meet all the demand” it’s seeing this year, and he raised 2026 capex guidance to $220 billion, up from $200 billion.
On the consumer side, Amazon launched a five-service Prime Video bundle this week. It combines AMC+, BritBox, MGM+, PBS Masterpiece, and STARZ for $29.99 a month, priced nearly 39% below subscribing to each individually. The company also expanded One Medical’s weight management care, including GLP-1 treatment, to 48 states and Washington, D.C.
Going forward, investors will watch whether AWS’s Gulf region issues stay contained or start to weigh on customer trust in an otherwise strong business.
Explore how Amazon’s stock compares with its own five-year price history (It’s free) >>>
A Trillion-Dollar Ambition, Tested by Outages

Under valuation model assumptions realized through 12/31/28, the stock is modeled using:
- Revenue Growth (CAGR): 15.2%
- Operating Margins: 15.6%
- Exit P/E Multiple: 27.4x
The model estimates a target price of $382, implying 50.5% upside and a 19.5% annualized return over the next 2.3 years.
That return potential is rare for a company Amazon’s size. It reflects genuine optimism about AWS’s trajectory. Jassy has said AWS could eventually become a trillion-dollar annual revenue business, and last quarter’s backlog of $496 billion, growing at a triple-digit pace, backs that ambition. Revenue growth assumptions near 15.2% look conservative next to AWS’s own 36.7% clip.
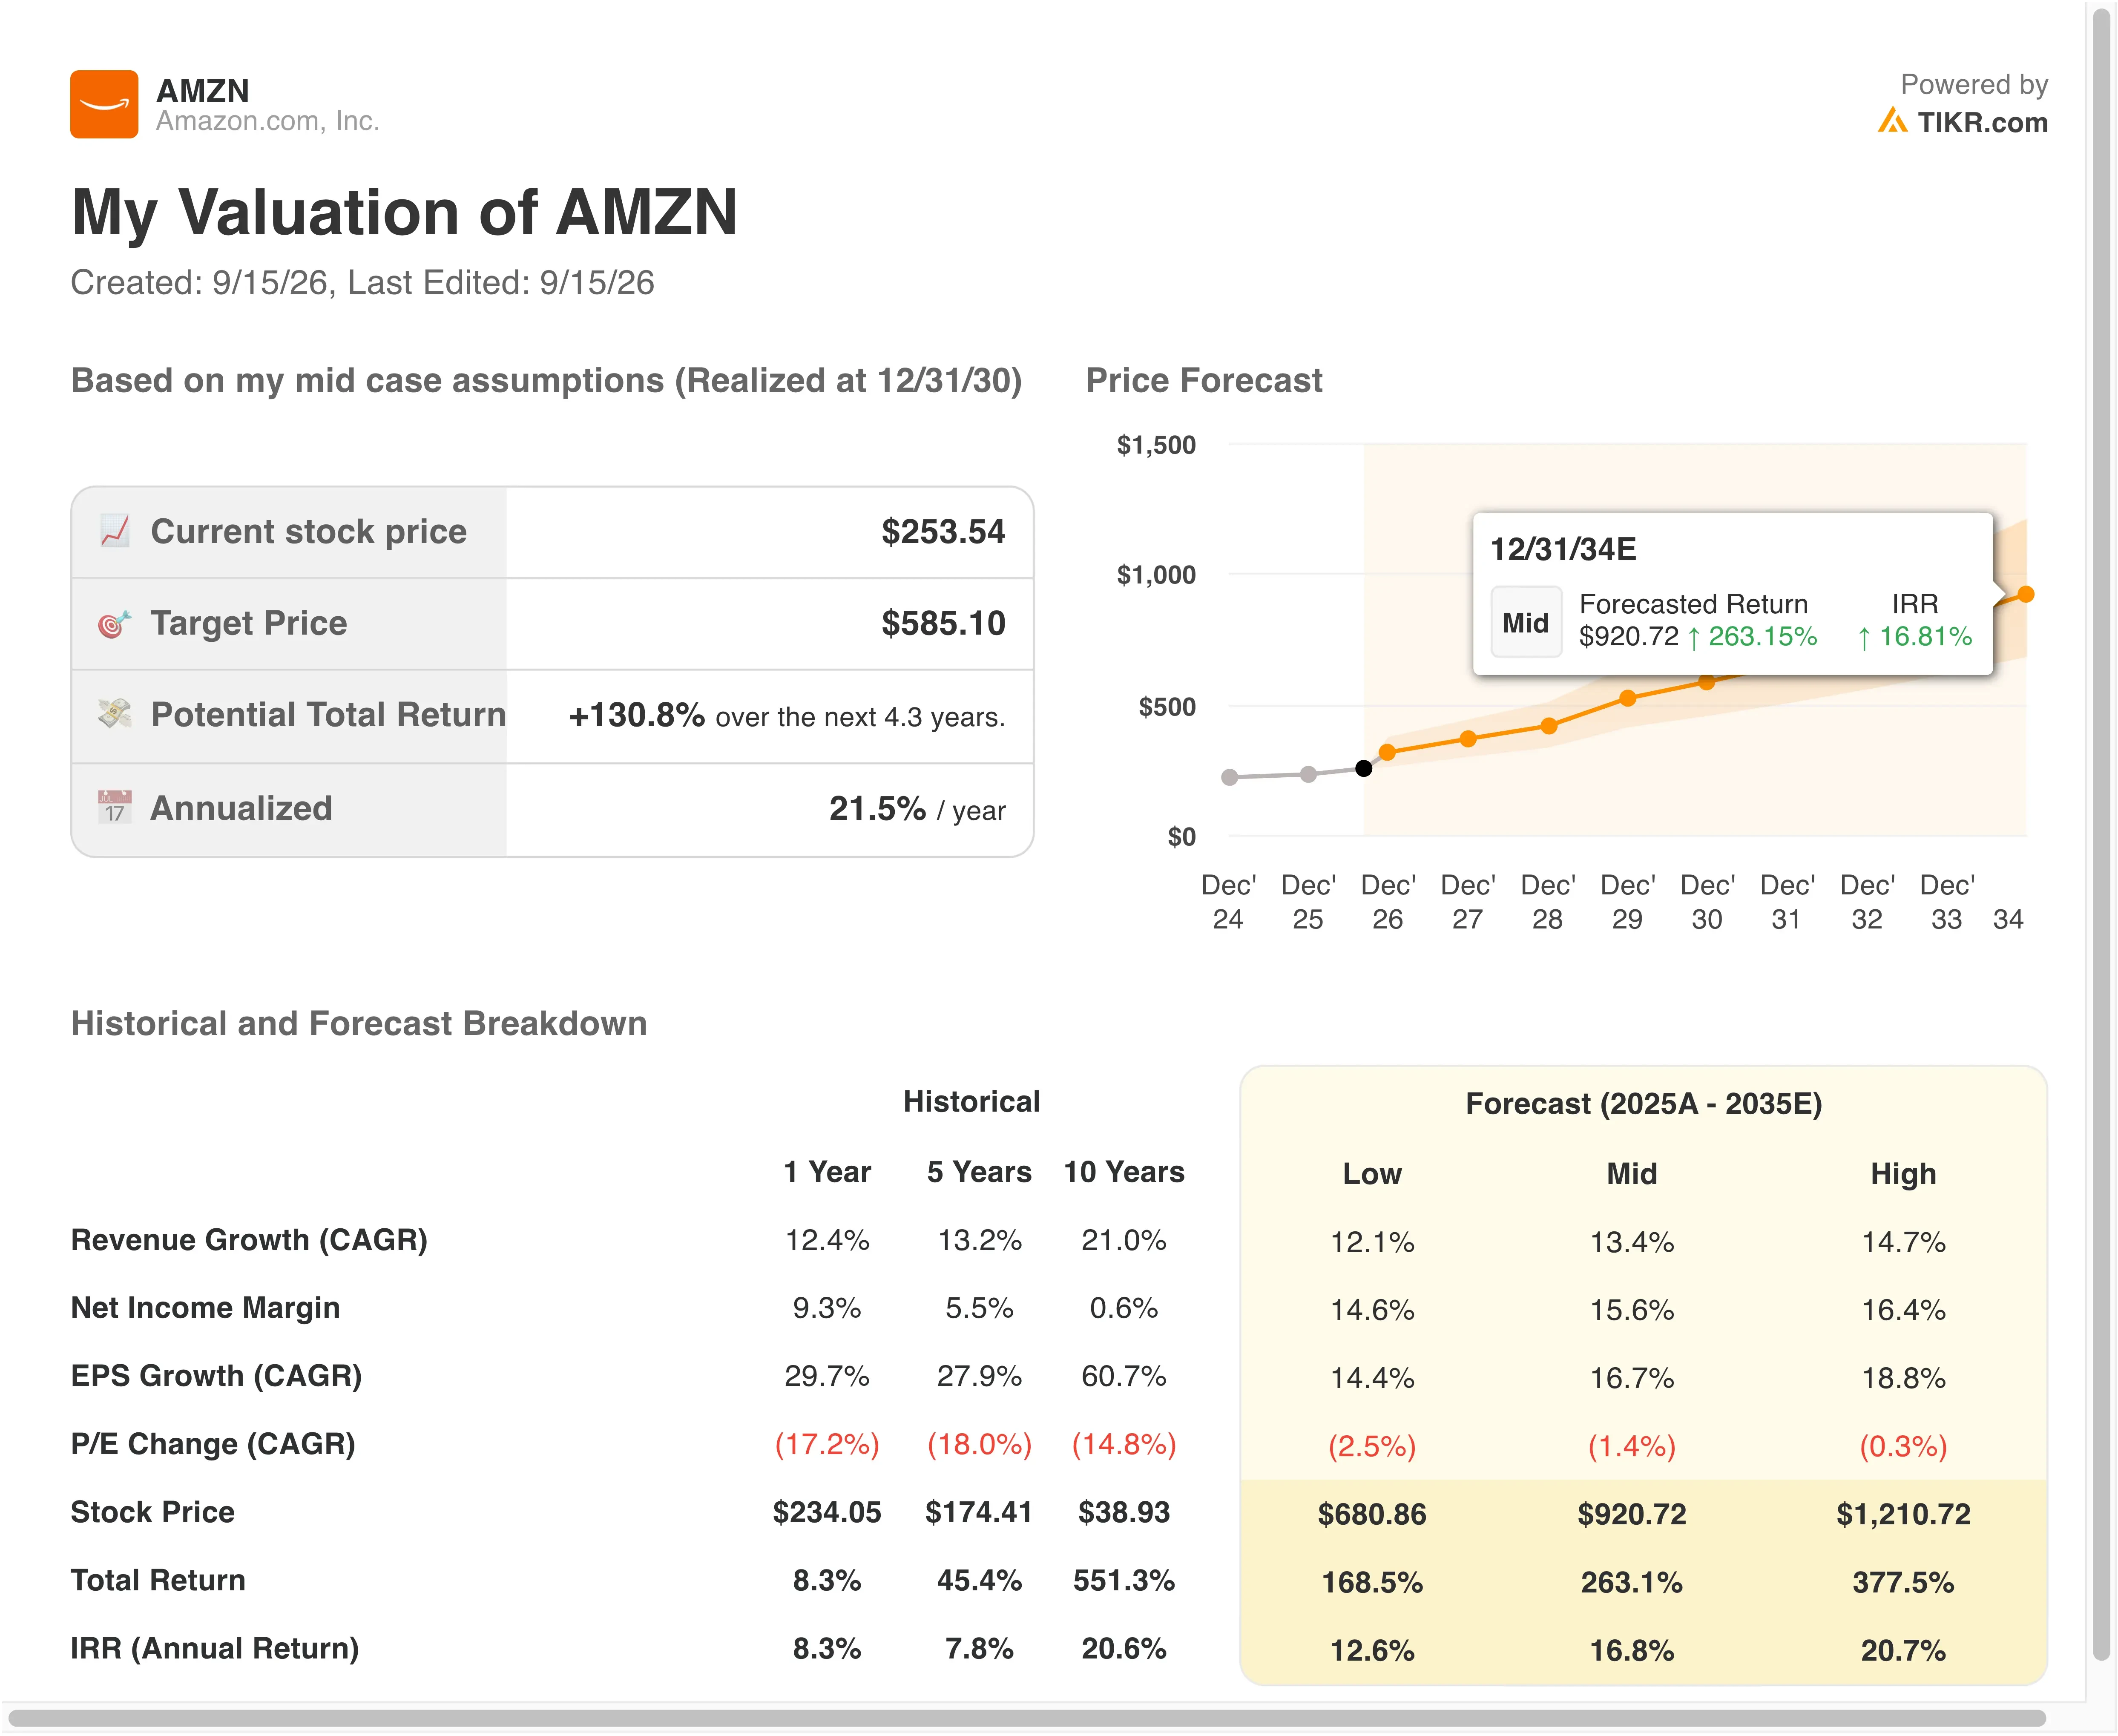
Margins are the more debated part of the story. A 15.6% operating margin assumption sits below AWS’s own segment margin near 39%, reflecting drag from Amazon’s lower-margin retail and logistics operations. Heavy capital spending on data centers adds near-term pressure too, though Jassy argues each new server generation gets cheaper to run.
At roughly 27.4x forward earnings, Amazon trades below its own 10-year average multiple. That gap is part of why the model still sees meaningful upside even with a modest 15.2% growth assumption baked in.
Compare Amazon’s forward multiple with its own trading history (Free with TIKR) >>>
Inside the Three-Way Fight for Cloud Supremacy
Microsoft (MSFT) Azure remains AWS’s closest competitor by scale. It’s been growing cloud revenue at a similarly fast clip, often cited in the mid 30% range, driven by its own AI infrastructure buildout. Microsoft trades at a premium multiple versus Amazon, reflecting higher blended margins since it lacks Amazon’s lower-margin retail segment.

Alphabet (GOOGL) Cloud is the smaller of the two rivals but has been the fastest grower recently, benefiting from Alphabet’s own AI push. Alphabet’s operating margin sits closer to 32%, well above Amazon’s consolidated figure, largely because search advertising remains such a high-margin business.
Amazon’s advantage is scale and infrastructure maturity. AWS’s $169 billion annualized revenue run rate still dwarfs both rivals, and its custom chips, including Graviton and Trainium, give it a cost edge neither Microsoft nor Alphabet can fully match yet.
What’s Driving AMZN Stock Going Forward?
The Bahrain and UAE outages are the most immediate issue to watch. AWS said it will provide its next Bahrain update in early 2027. So some regional customers may need to plan around extended downtime, a real test of reputational damage.
AI-driven infrastructure demand remains the bigger long-term catalyst. Amazon’s chips business already generates over $25 billion in annualized revenue, growing at triple-digit rates. Jassy has said demand for 2028 capacity is already striking, suggesting capex stays elevated well beyond this year.
On the consumer side, Amazon’s new streaming bundle and healthcare expansion show diversification beyond core retail and cloud. With Prime Big Deal Days returning October 6 and 7, investors will get another read on holiday-season demand.
See how Amazon’s next decade could unfold (Free with TIKR) >>>
Should You Invest in Amazon?
The only way to really know is to look at the numbers yourself. TIKR gives you free access to the same institutional-quality financial data that professional analysts use to answer exactly that question.
Pull up AMZN, and you’ll see years of historical financials, what Wall Street analysts expect for revenue and earnings in the quarters ahead, how valuation multiples have moved over time, and whether price targets are trending up or down.
You can build a free watchlist to track AMZN alongside every other stock on your radar. No credit card required. Just the data you need to decide for yourself.
Analyze AMZN stock on TIKR Free→
Disclaimer:
Please note that the articles on TIKR are not intended to serve as investment or financial advice from TIKR or our content team, nor are they recommendations to buy or sell any stocks. We create our content based on TIKR Terminal’s investment data and analysts’ estimates. Our analysis might not include recent company news or important updates. TIKR has no position in any stocks mentioned. Thank you for reading, and happy investing!