
We have all seen the same movie: a company puts up massive revenue numbers, the headlines go wild, and the stock price pops, only for the whole thing to crumble a year later because they were “buying” that growth at a loss. It is the ultimate investor heartbreak. If you want to avoid the “growth at any cost” trap, you have to look at Return on Invested Capital (ROIC). It is the only metric that tells you exactly how much profit a company squeezes out of every dollar it plows back into the business.
Think of ROIC as the ultimate BS detector for your portfolio. A business can manipulate its earnings through accounting tricks or massive share buybacks, but it is much harder to fake capital efficiency. When a company consistently generates high returns on its capital, it creates a “virtuous cycle” in which it can fund its own expansion without constantly diluting shareholders or taking on dangerous levels of debt.
The good news is that you no longer need a Bloomberg terminal to find these high-quality compounders. A new generation of free tools has automated the heavy lifting, allowing you to filter the global market for efficiency leaders in seconds. The following platforms are the best resources in 2026 for identifying elite businesses that actually create value rather than just consume it.
1. TIKR
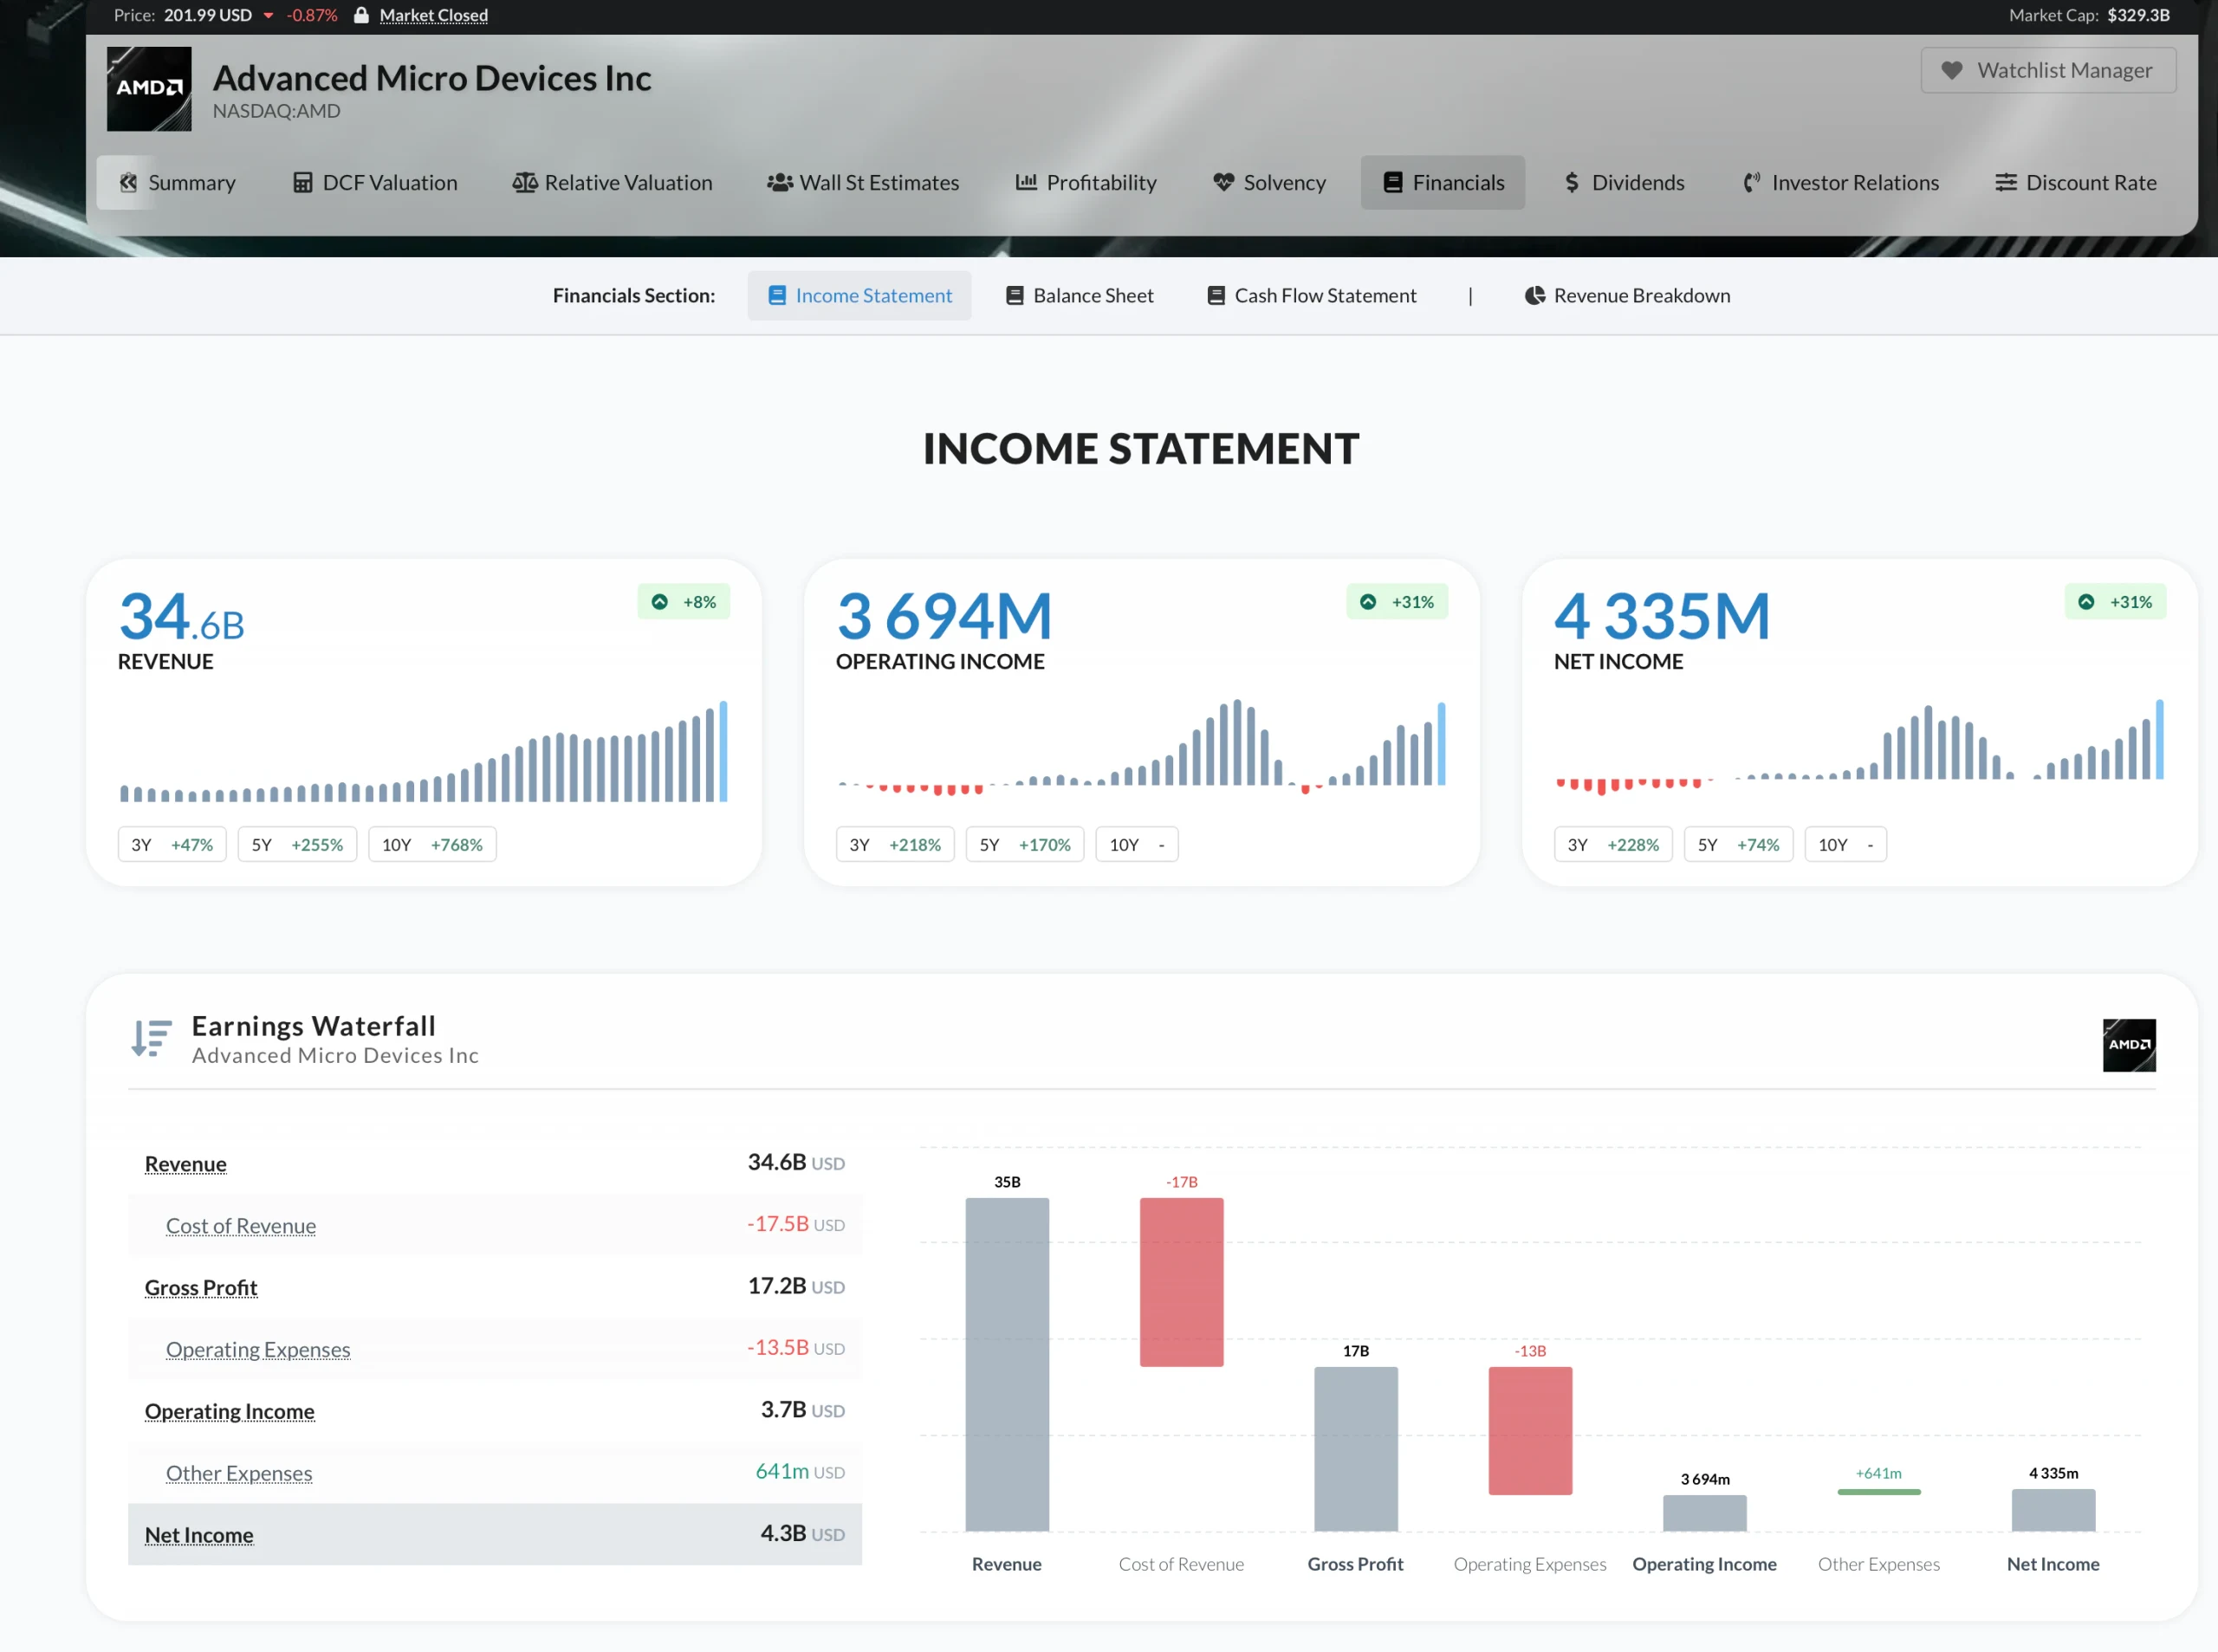
TIKR serves as a professional-grade command center for auditing a business’s structural quality. To find a company’s efficiency markers, navigate to the Detailed Financials tab and select Ratios. Here, you can find Return on Capital (ROC) pre-calculated over a multi-year period, allowing you to see if a company’s high returns are a permanent feature of their moat or just a lucky, one-time spike.
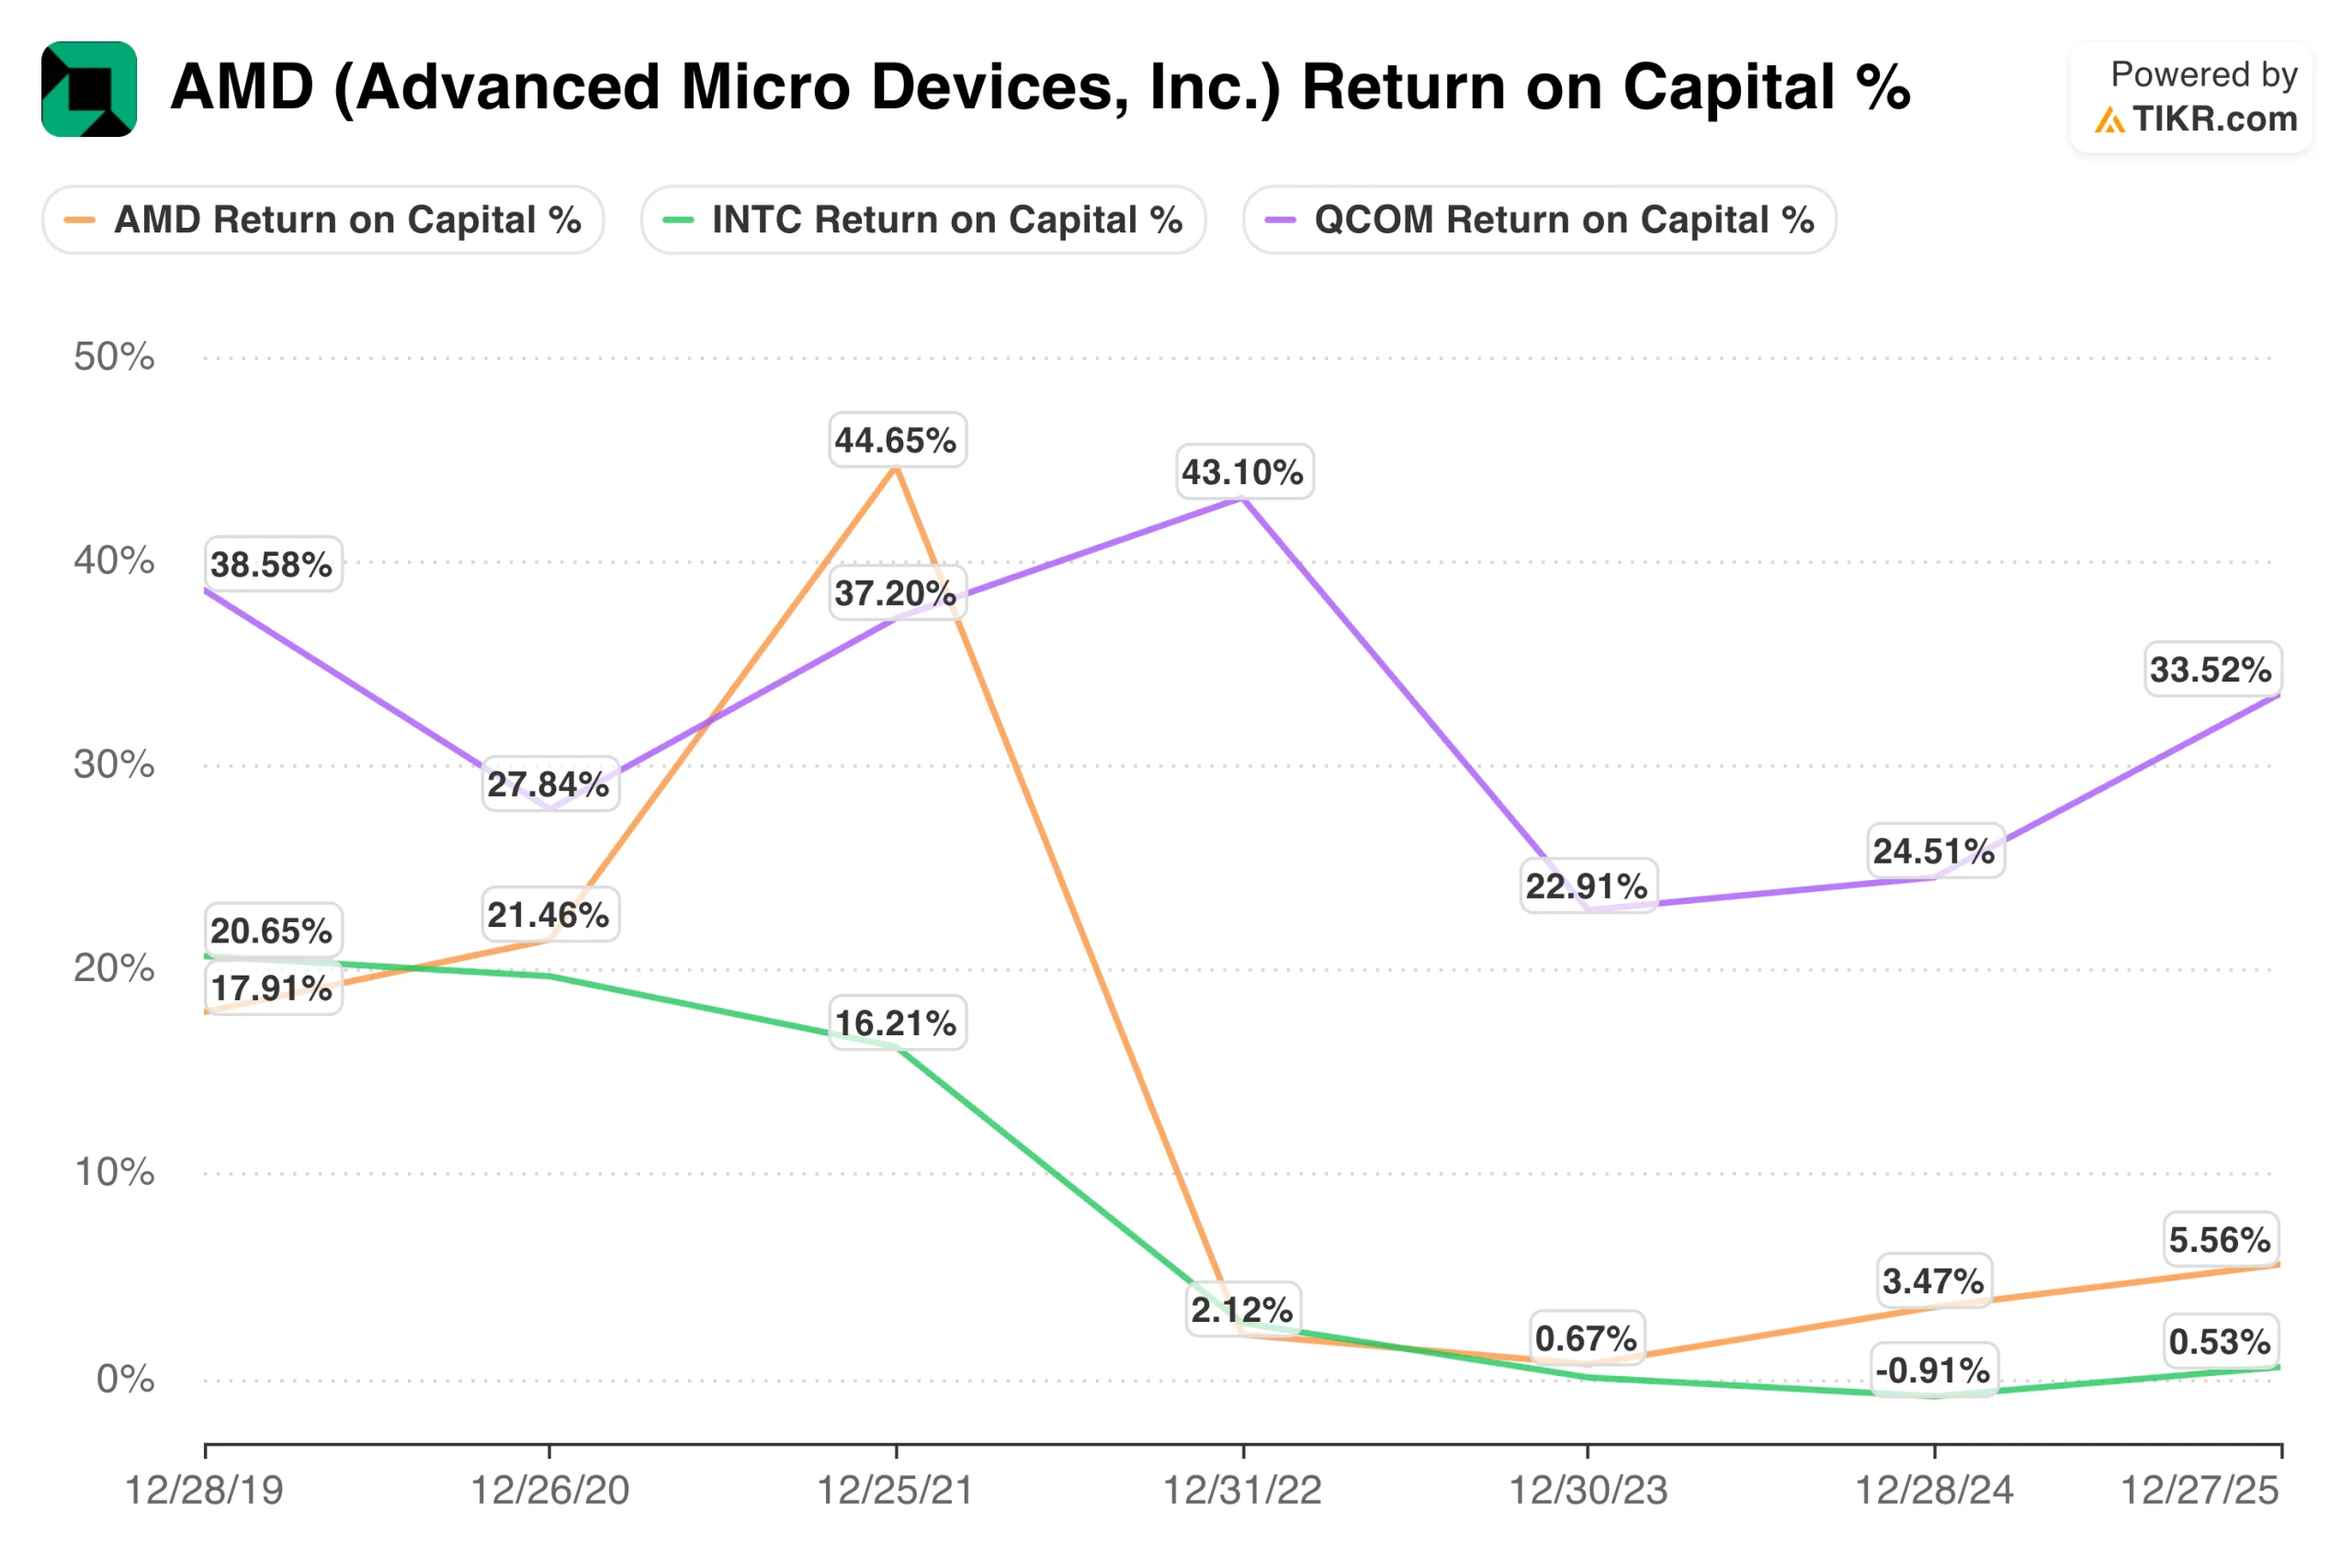
The platform’s true power lies in the Peers tab, where you can perform a “Quality Audit” against an entire industry. You can instantly compare a stock’s Return on Capital against five or six of its direct competitors on a single screen. If your stock is maintaining a 20% ROC while the rest of the peer group is struggling at 8%, you’ve found a company with a structural advantage that the market might be underpricing.
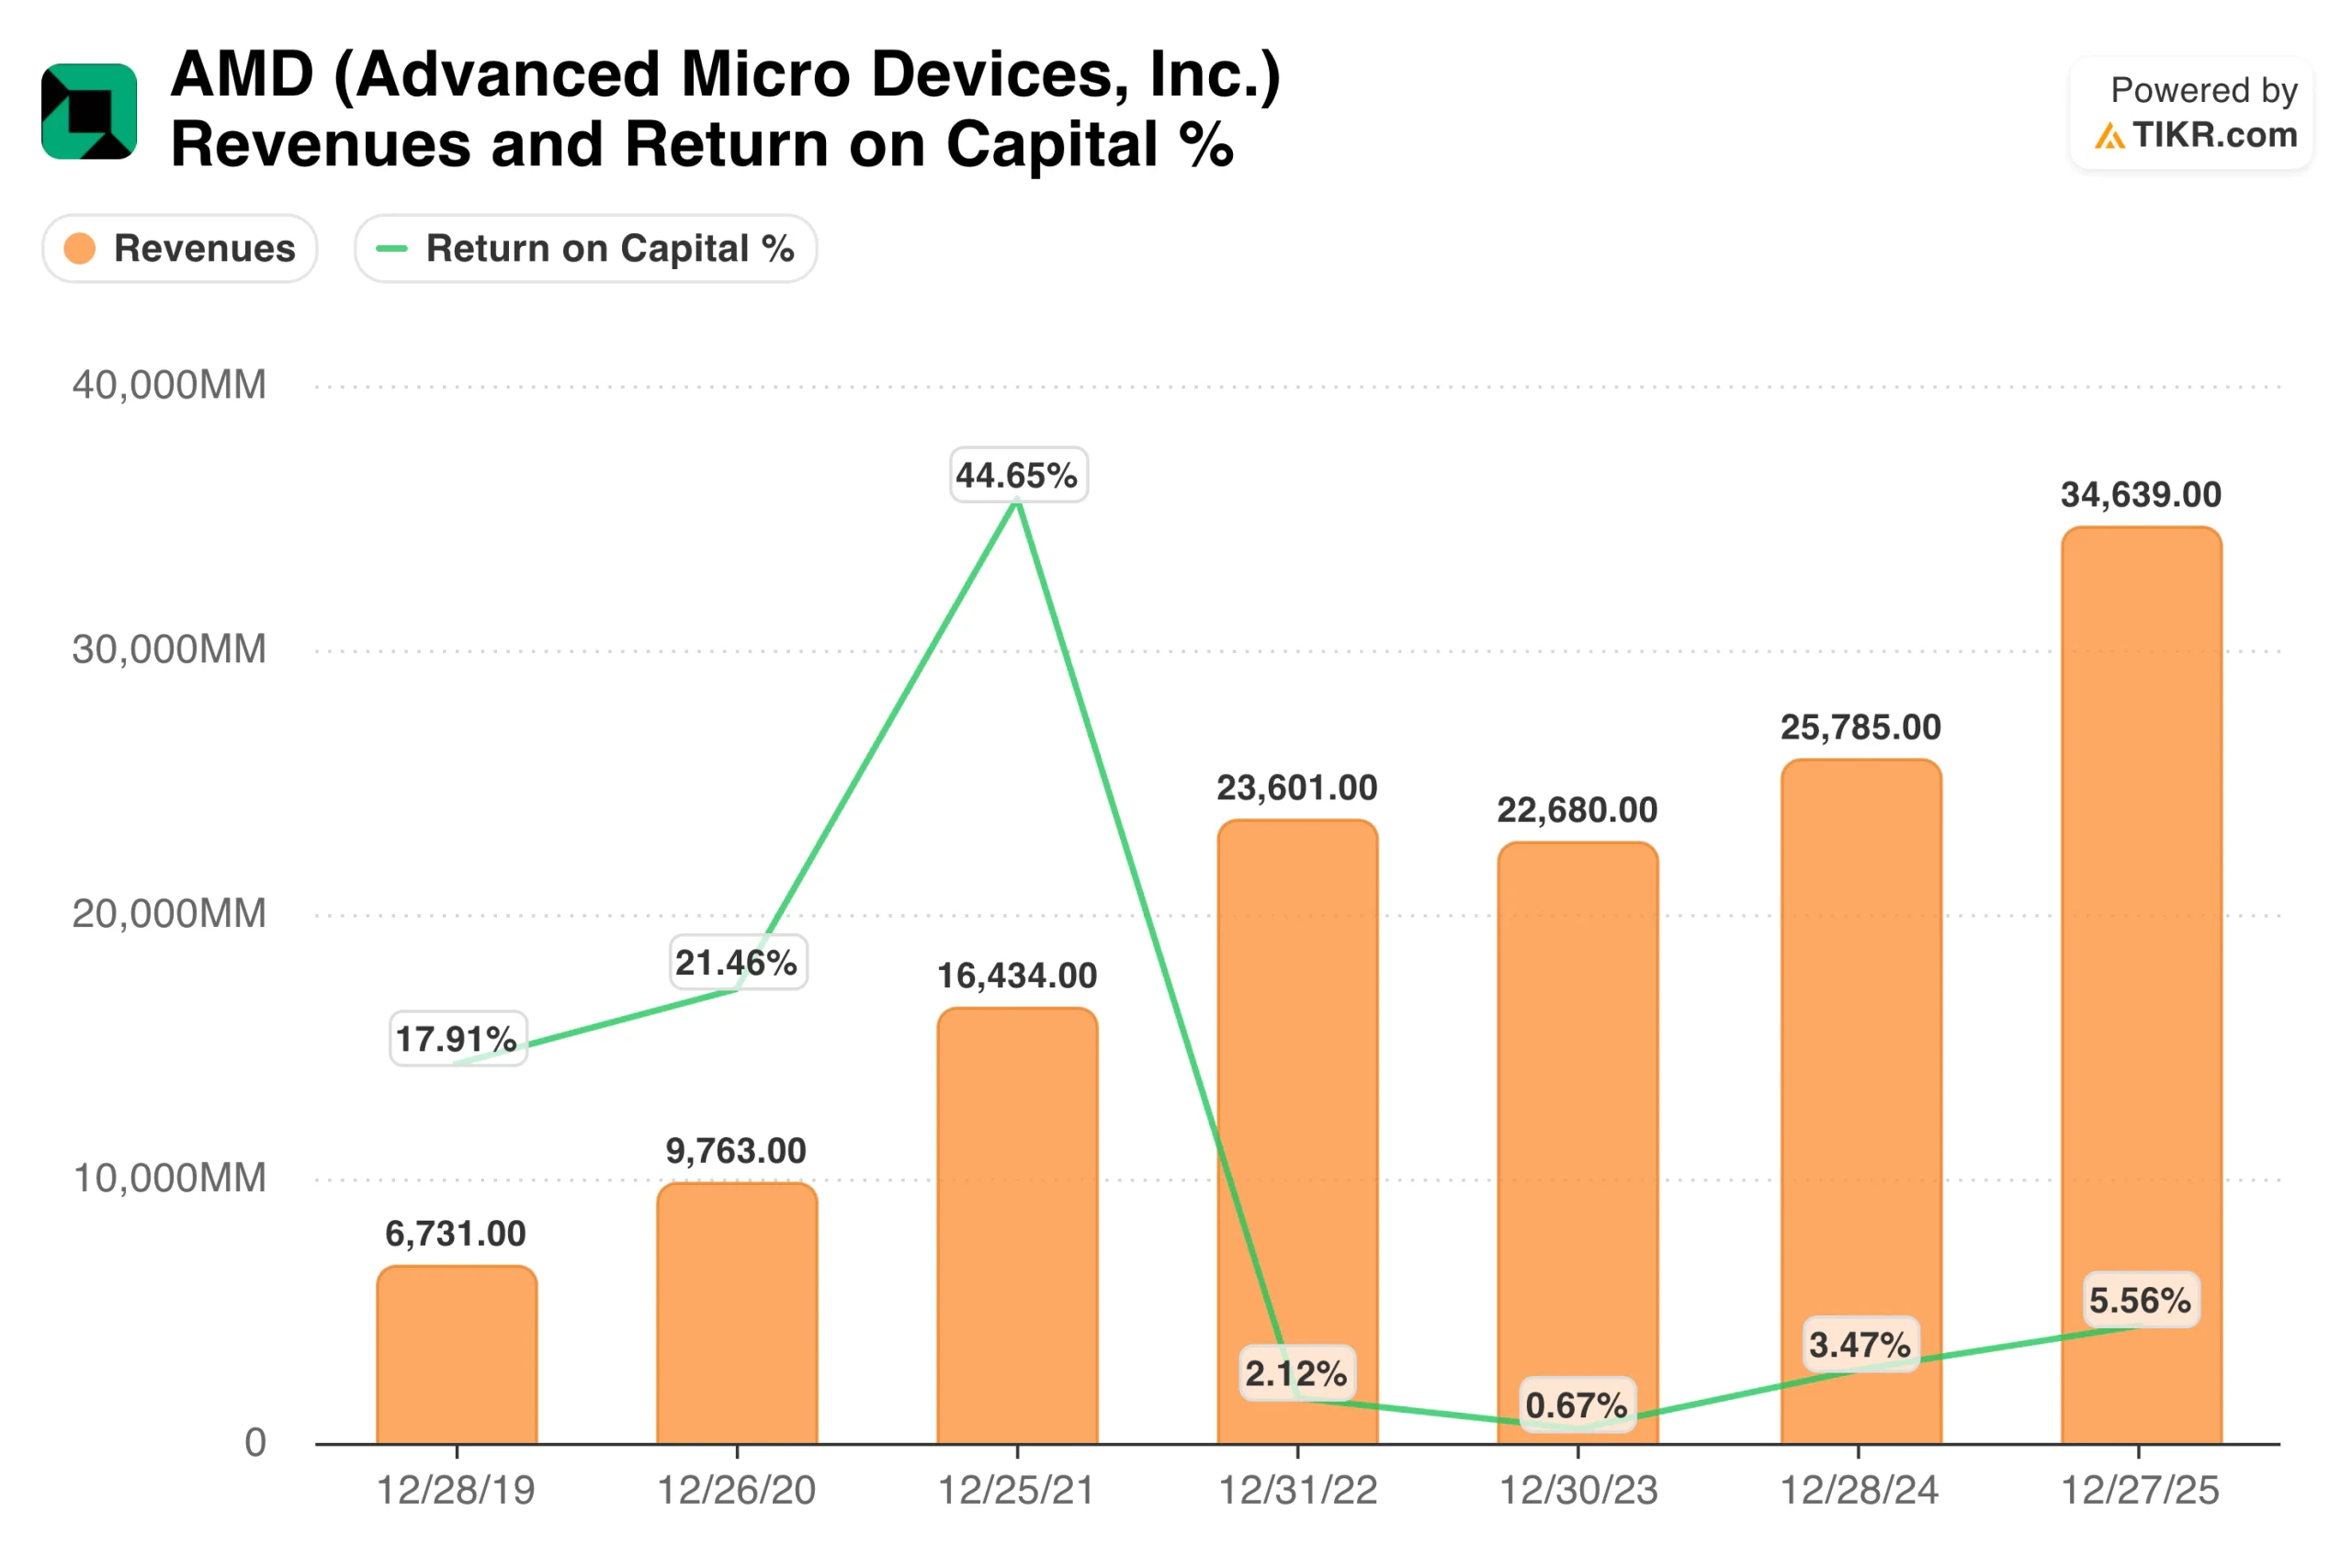
For a deeper dive into how that efficiency is achieved, you can use the Charting tool to plot Return on Capital alongside Revenue Growth. This allows you to see if the company is a “Self-Funder,” meaning it can grow its top line without its capital efficiency collapsing. It’s the fastest way to verify if a management team is scaling the business intelligently or just throwing money at the wall to see what sticks.
Best Features:
- 15+ Years of ROIC Data: Audit capital efficiency across decades in the Ratios tab to ensure high returns are a structural feature of the business model.
- Peer Benchmarking Dashboard: Use the Peers tab to stack a company’s Return on Capital against its competitors to identify the true industry leader.
- Efficiency Scaling Charts: Click the Return on Capital row to generate a trendline and overlay it with Revenue Growth to see how efficiency holds up during expansion.
- Global Quality Coverage: Access pre-calculated efficiency ratios for over 100,000 stocks, making it easy to find high-ROIC compounders in international markets.
Review return on capital history for thousands of stocks in under 60 seconds (Free with TIKR) >>>
2. GuruFocus
GuruFocus is a comprehensive research site that provides free access to calculated ROIC percentages and historical trends. It includes a wealth of supporting data, such as NOPAT (Net Operating Profit After Tax) and invested capital breakdowns, that help you understand exactly how returns are generated.
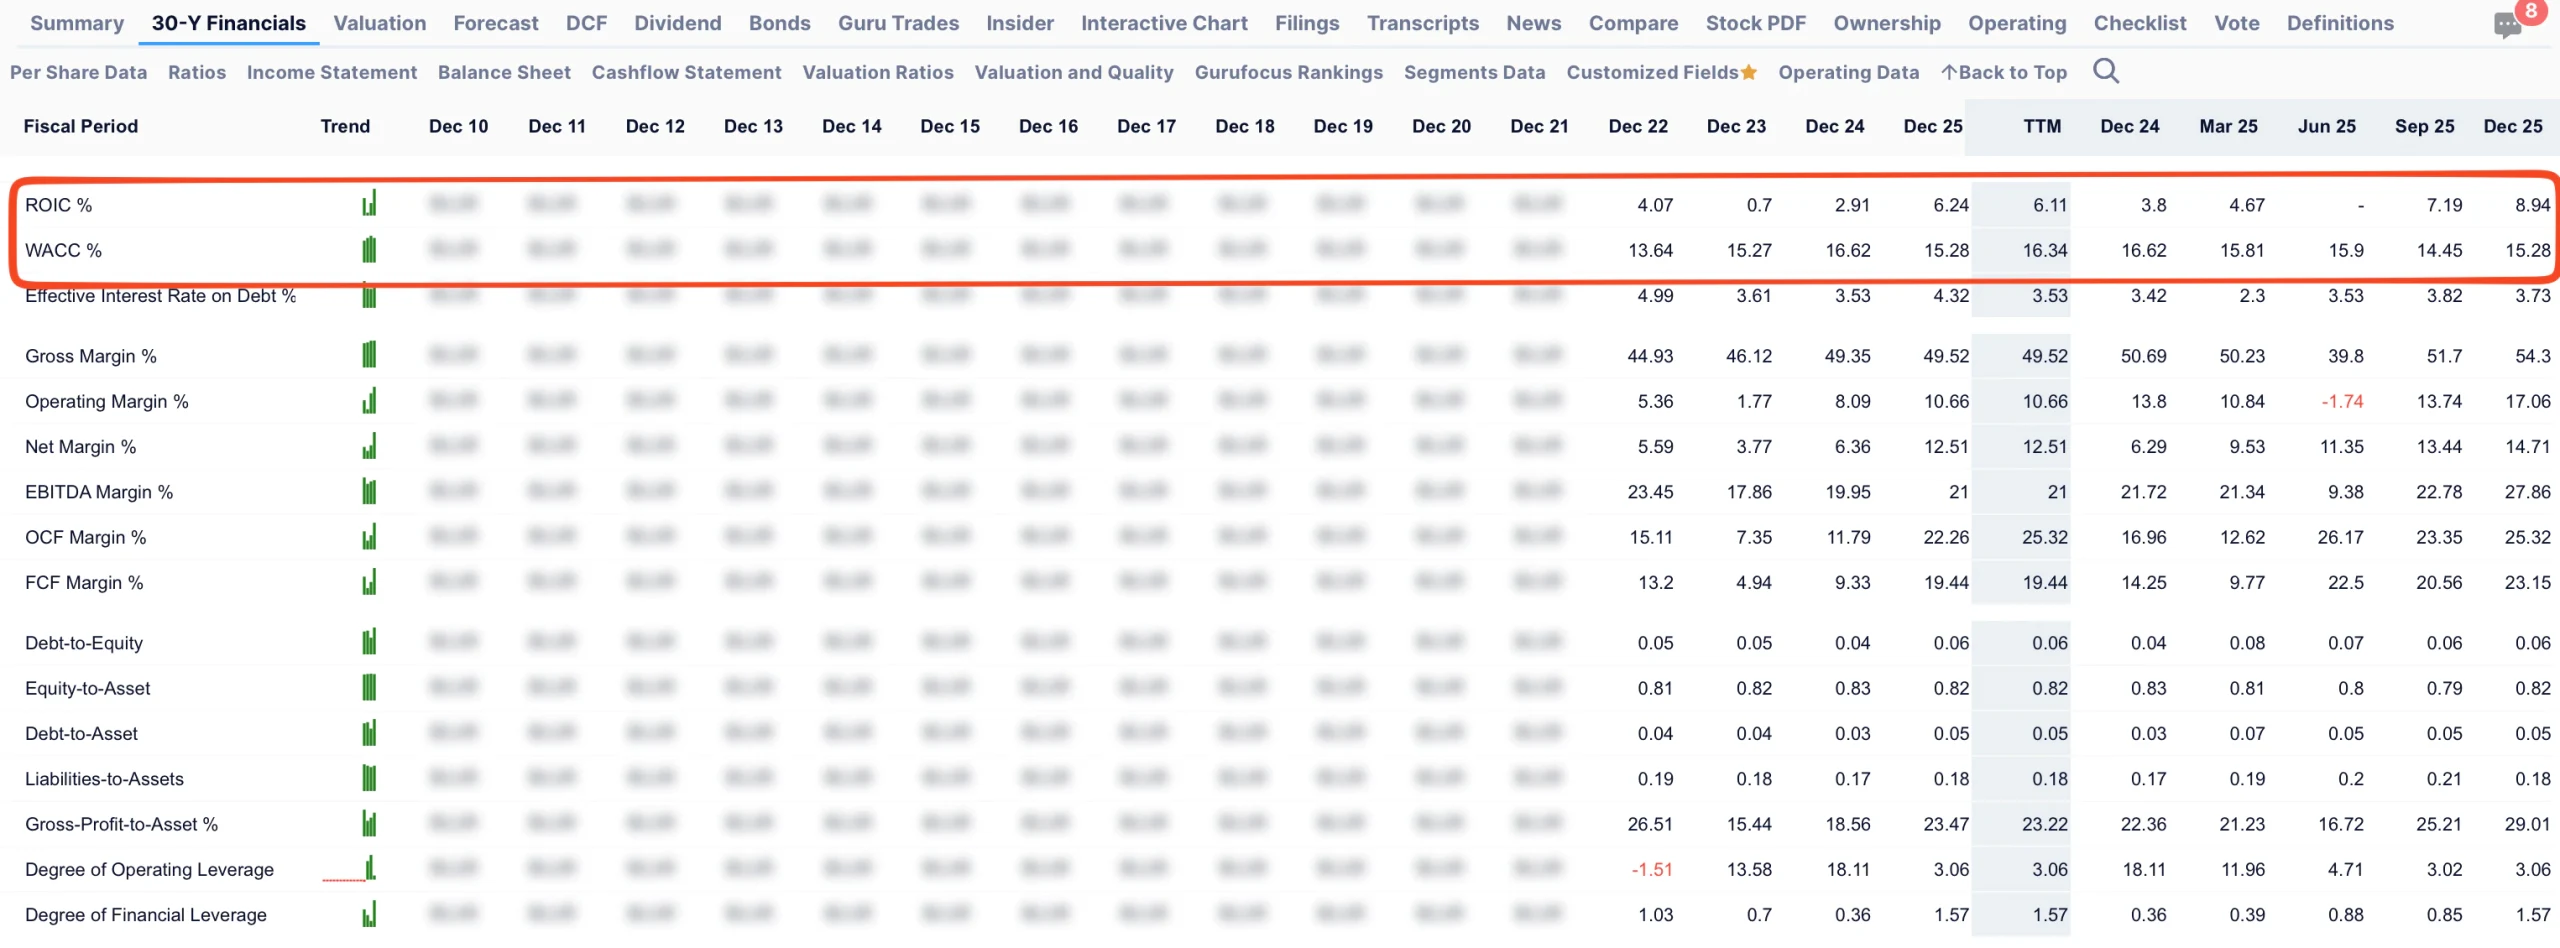
The platform also features a variety of “Quality Scores” that incorporate capital efficiency into a broader assessment of a company’s financial health. It is an ideal tool for value-oriented investors who want to perform a deep dive into the long-term sustainability of a company’s returns on capital.
Best Features:
- GuruFocus does this best by offering up to multiple years of financial history, allowing for an unprecedented look at how capital efficiency evolves over a company’s entire lifecycle.
Review complete financials for any stock in less than 60 seconds (It’s free) >>>
3. Stock Analysis
Stock Analysis is a clean, completely free website that provides high-quality, standardized financial statements and key profitability and efficiency ratios. It supports a thorough review of trends in returns on capital and in the components of invested capital, without visual clutter or distractions.
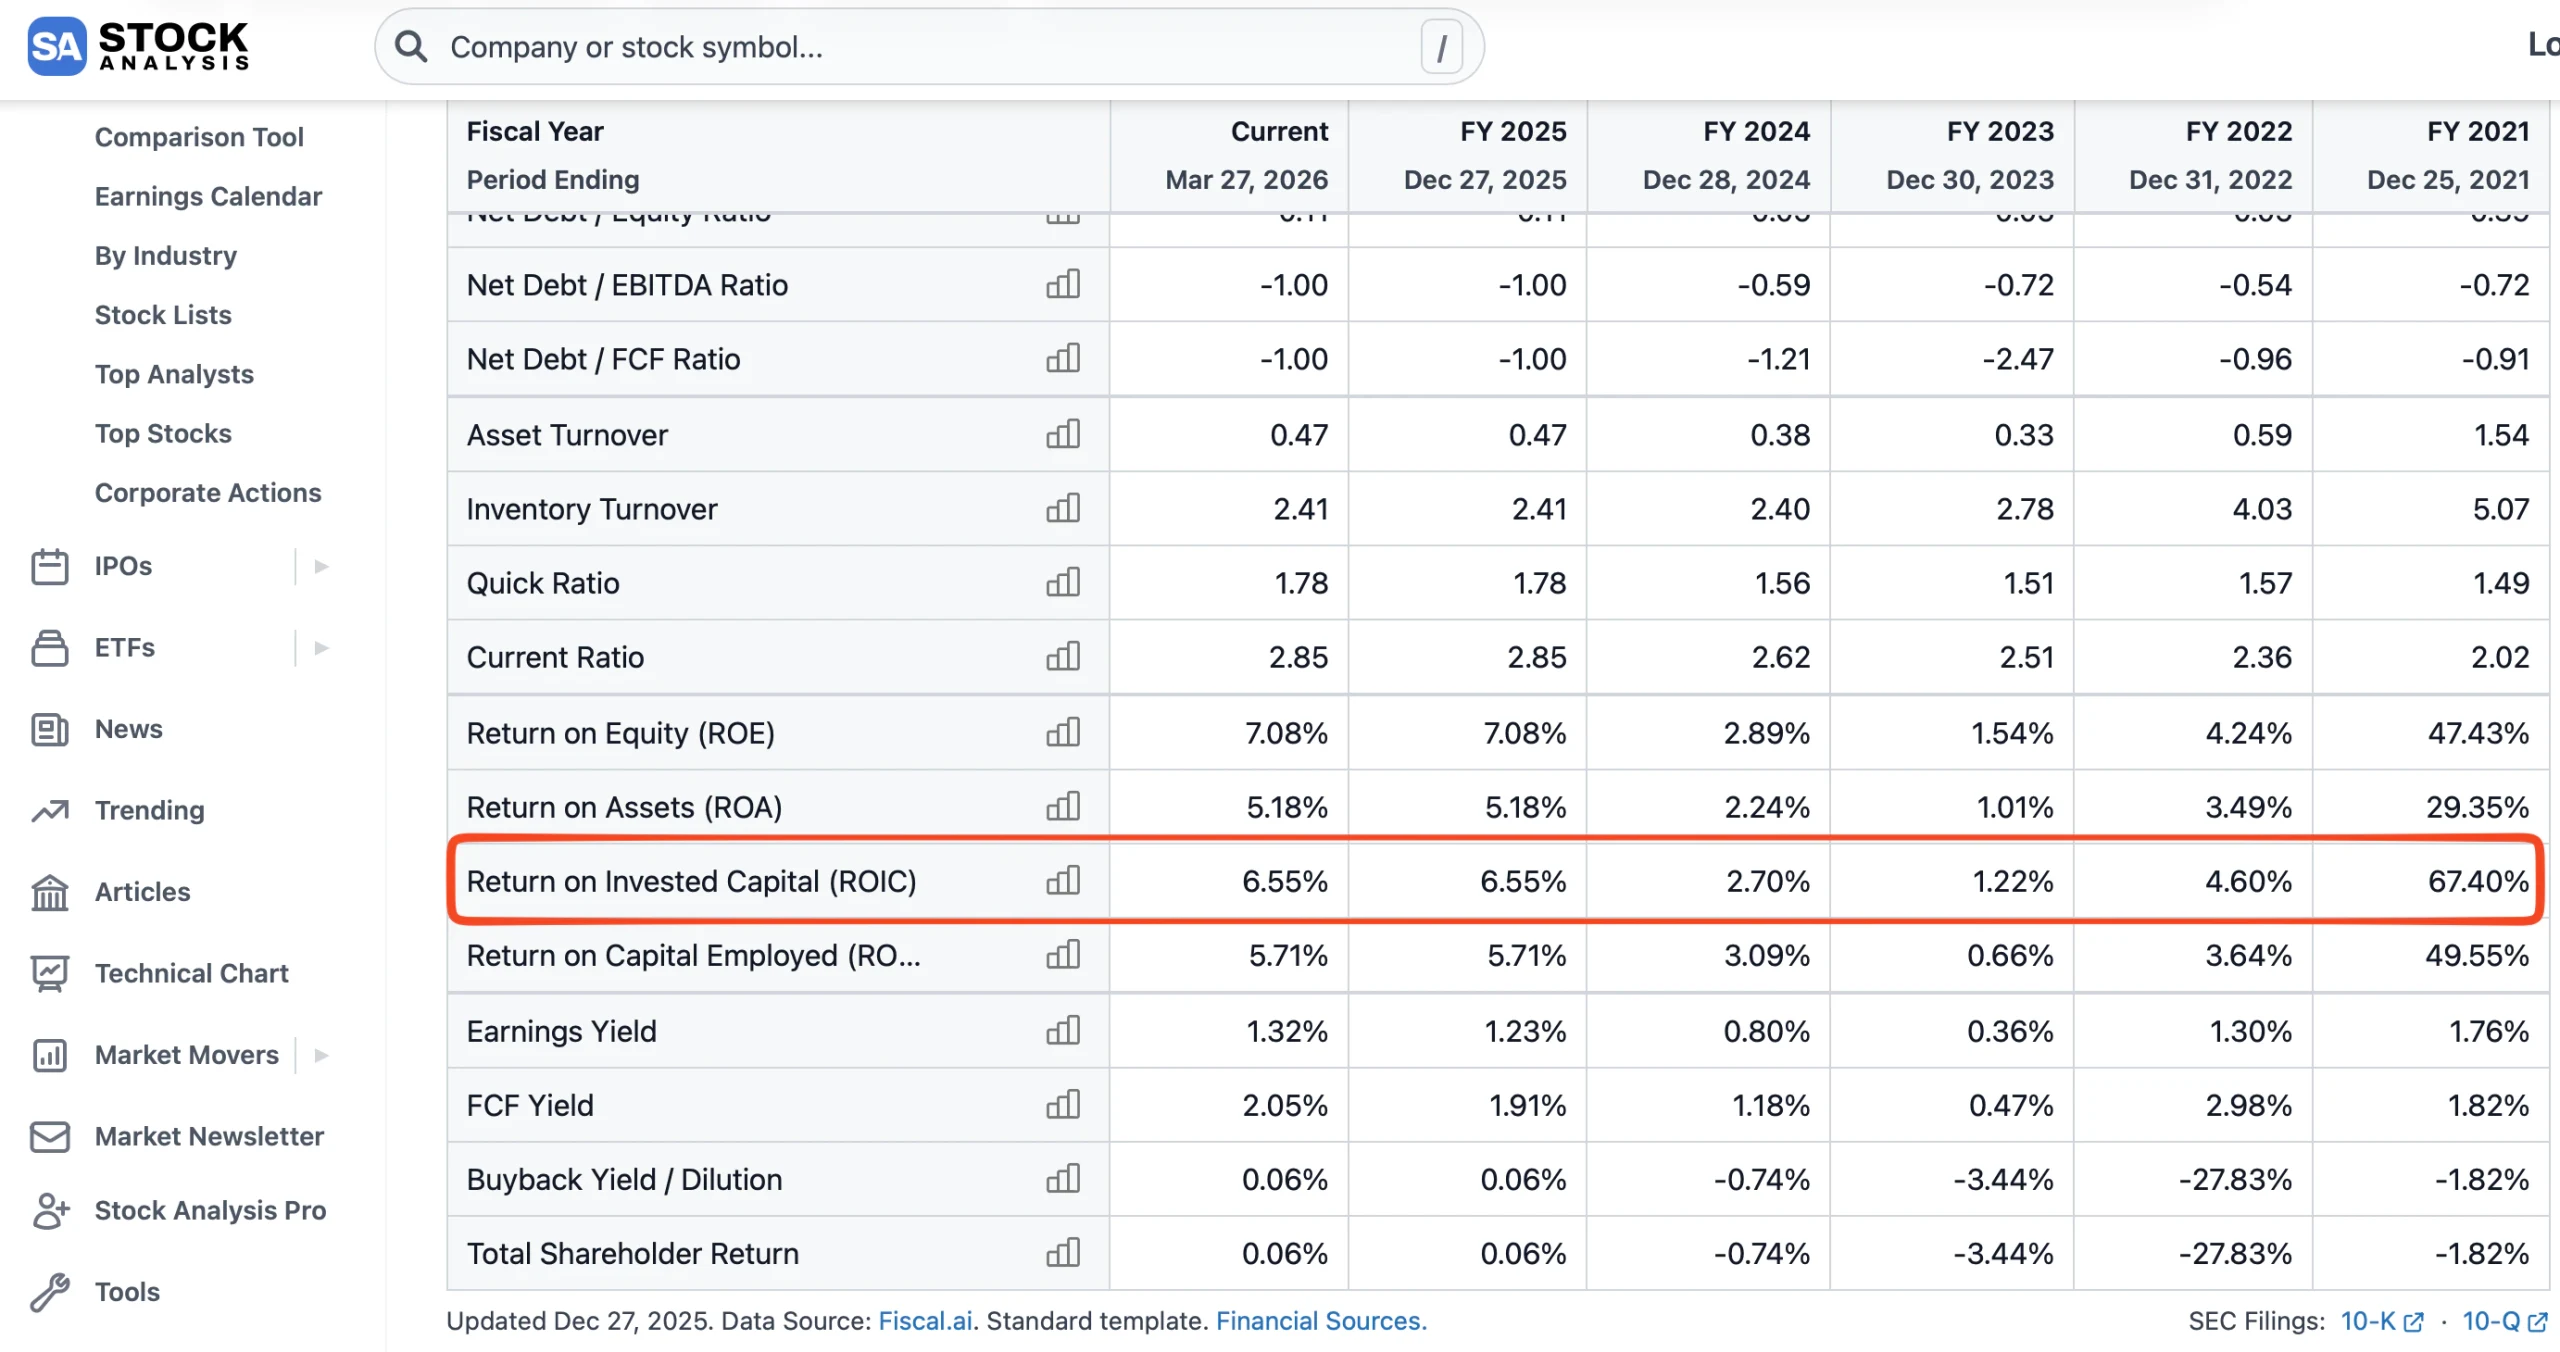
The platform’s strength is its side-by-side comparison capabilities. Once you identify a high-ROIC candidate, you can quickly compare its efficiency against its direct competitors to determine whether its performance is truly superior or merely a reflection of industry-wide high margins.
Best Features:
- Stock Analysis does this best by providing a Polished User Interface that makes tracking year-over-year efficiency trends fast and frictionless.
4. Alpha Spread
Alpha Spread delivers fundamental analysis that ties efficiency metrics directly to intrinsic value models. It helps you evaluate ROIC in the context of valuation, showing you whether a company’s capital efficiency actually supports its current share price. This prevents you from buying a “great” business that is already trading at an unsustainable premium.
The tool’s automated reports provide a clear breakdown of a company’s profitability and solvency. It is a great choice for investors who want to see the “bottom line” on whether a company’s capital allocation strategy is actually creating value for shareholders at the current entry point.
Best Features:
- Alpha Spread does this best by providing Automated Valuation Reports that quantify the extent to which a stock’s price is driven by its underlying capital efficiency.
5. Simply Wall St
Simply Wall St is an intuitive platform that uses visual data to make capital efficiency easy to understand. Its “Snowflake” screener and company overviews provide a high-level summary of a stock’s health, including its returns on capital and historical growth.
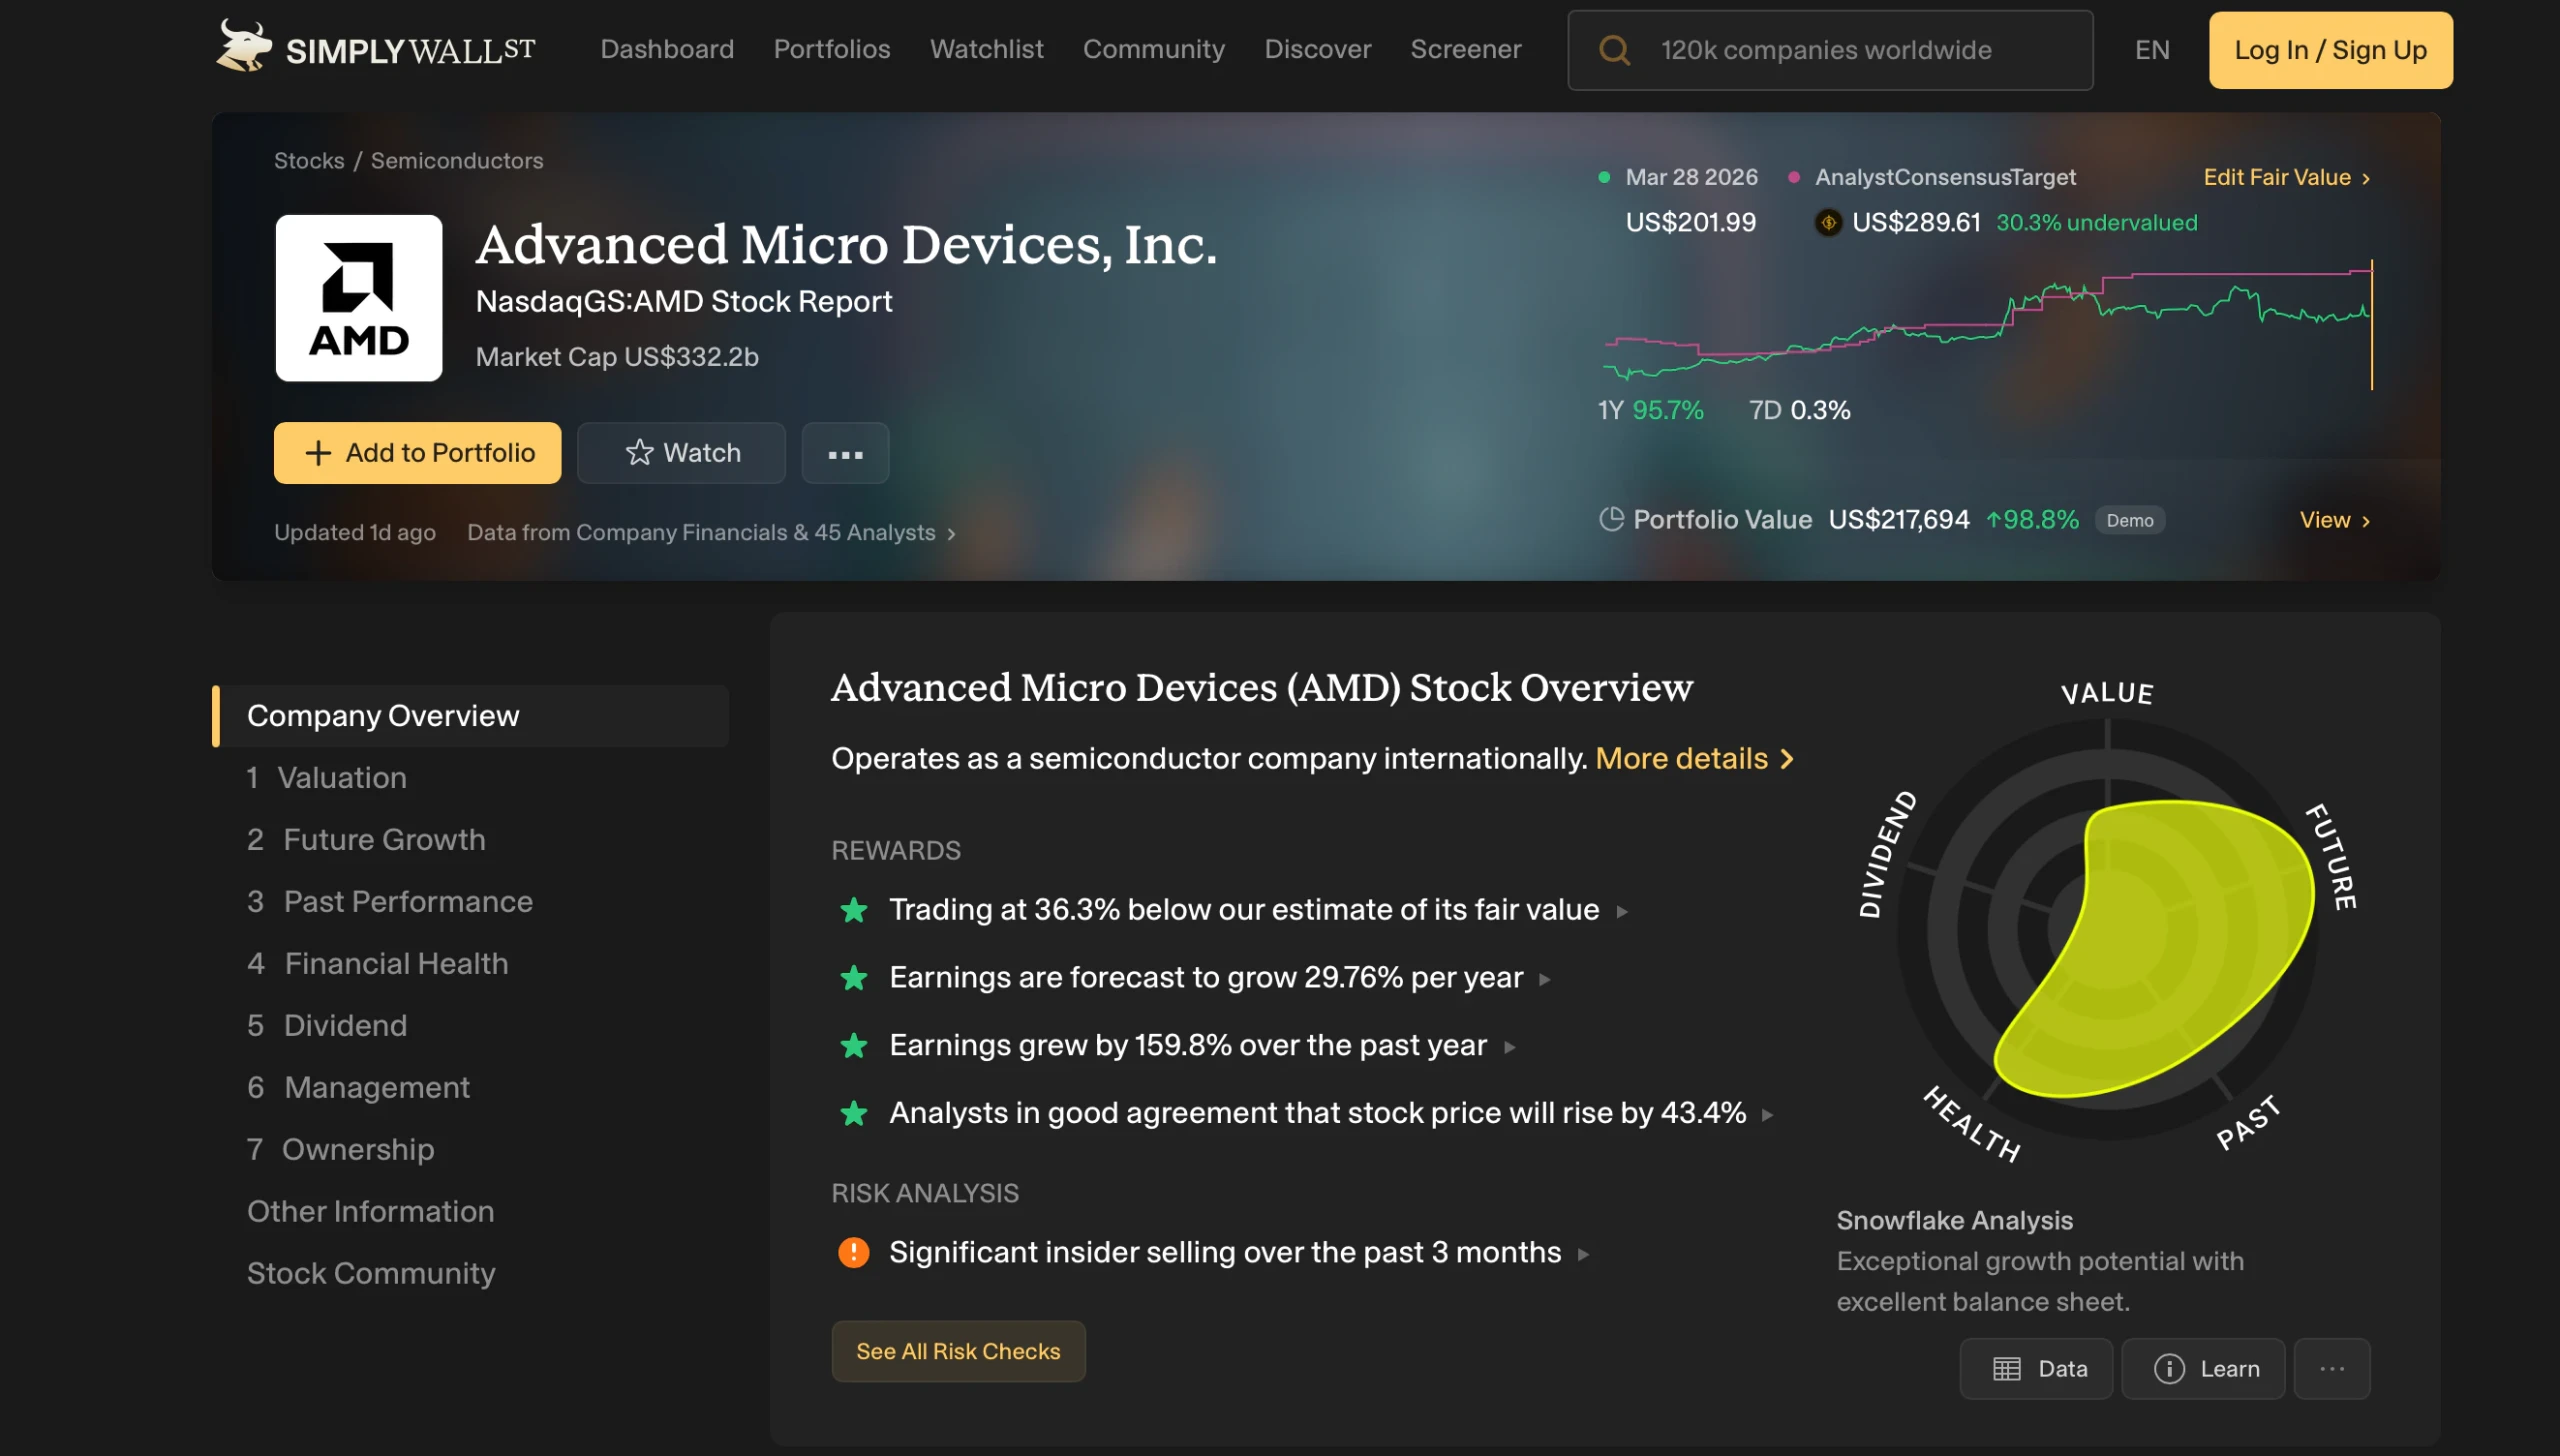
The platform is perfect for a quick visual audit of a portfolio. It uses simple charts to show how a company’s ROIC compares with its industry and the broader market, making it an excellent “first look” tool for identifying stocks with strong capital-allocation characteristics.
Best Features:
- Simply Wall St does this best by offering Infographic-Style Analysis that translates complex efficiency ratios into easy-to-read visual snapshots.
Build your own screener to find stocks with solid return on capital (Free with TIKR) >>>
TIKR Takeaway
A high ROIC is the hallmark of a great business, but the real prize is finding one that can maintain that efficiency as it grows. TIKR provides the historical depth and global reach to verify that a company’s capital efficiency is a durable competitive advantage rather than a lucky streak.
By allowing you to screen for consistent efficiency and audit management’s reinvestment track record, TIKR turns the search for quality into an evidence-based process. It replaces speculative guesswork with a clear, data-backed view of a company’s true compounding DNA.
Value Any Stock in Under 60 Seconds with TIKR
With TIKR’s new Valuation Model tool, you can estimate a stock’s potential share price in under a minute.
All it takes is three simple inputs:
- Revenue Growth
- Operating Margins
- Exit P/E Multiple
If you’re not sure what to enter, TIKR automatically fills in each input using analysts’ consensus estimates, giving you a quick, reliable starting point.
From there, TIKR calculates the potential share price and total returns under Bull, Base, and Bear scenarios so you can quickly see whether a stock looks undervalued or overvalued.
See a stock’s true value in under 60 seconds (Free with TIKR) >>>
Looking for New Opportunities?
- Discover which stocks billionaire investors are purchasing, so you can follow the smart money.
- Analyze stocks in as little as 5 minutes with TIKR’s all-in-one, easy-to-use platform.
- The more rocks you overturn… the more opportunities you’ll uncover. Search 100K+ global stocks, global top investor holdings, and more with TIKR.
Disclaimer:
Please note that the articles on TIKR are not intended to serve as investment or financial advice from TIKR or our content team, nor are they recommendations to buy or sell any stocks. We create our content based on TIKR Terminal’s investment data and analysts’ estimates. Our analysis might not include recent company news or important updates. TIKR has no position in any stocks mentioned. Thank you for reading, and happy investing!