
Key Stats for Sherwin-Williams Stock
- Year-to-Date Performance: 14%
- 52-Week Range: $309 to $380
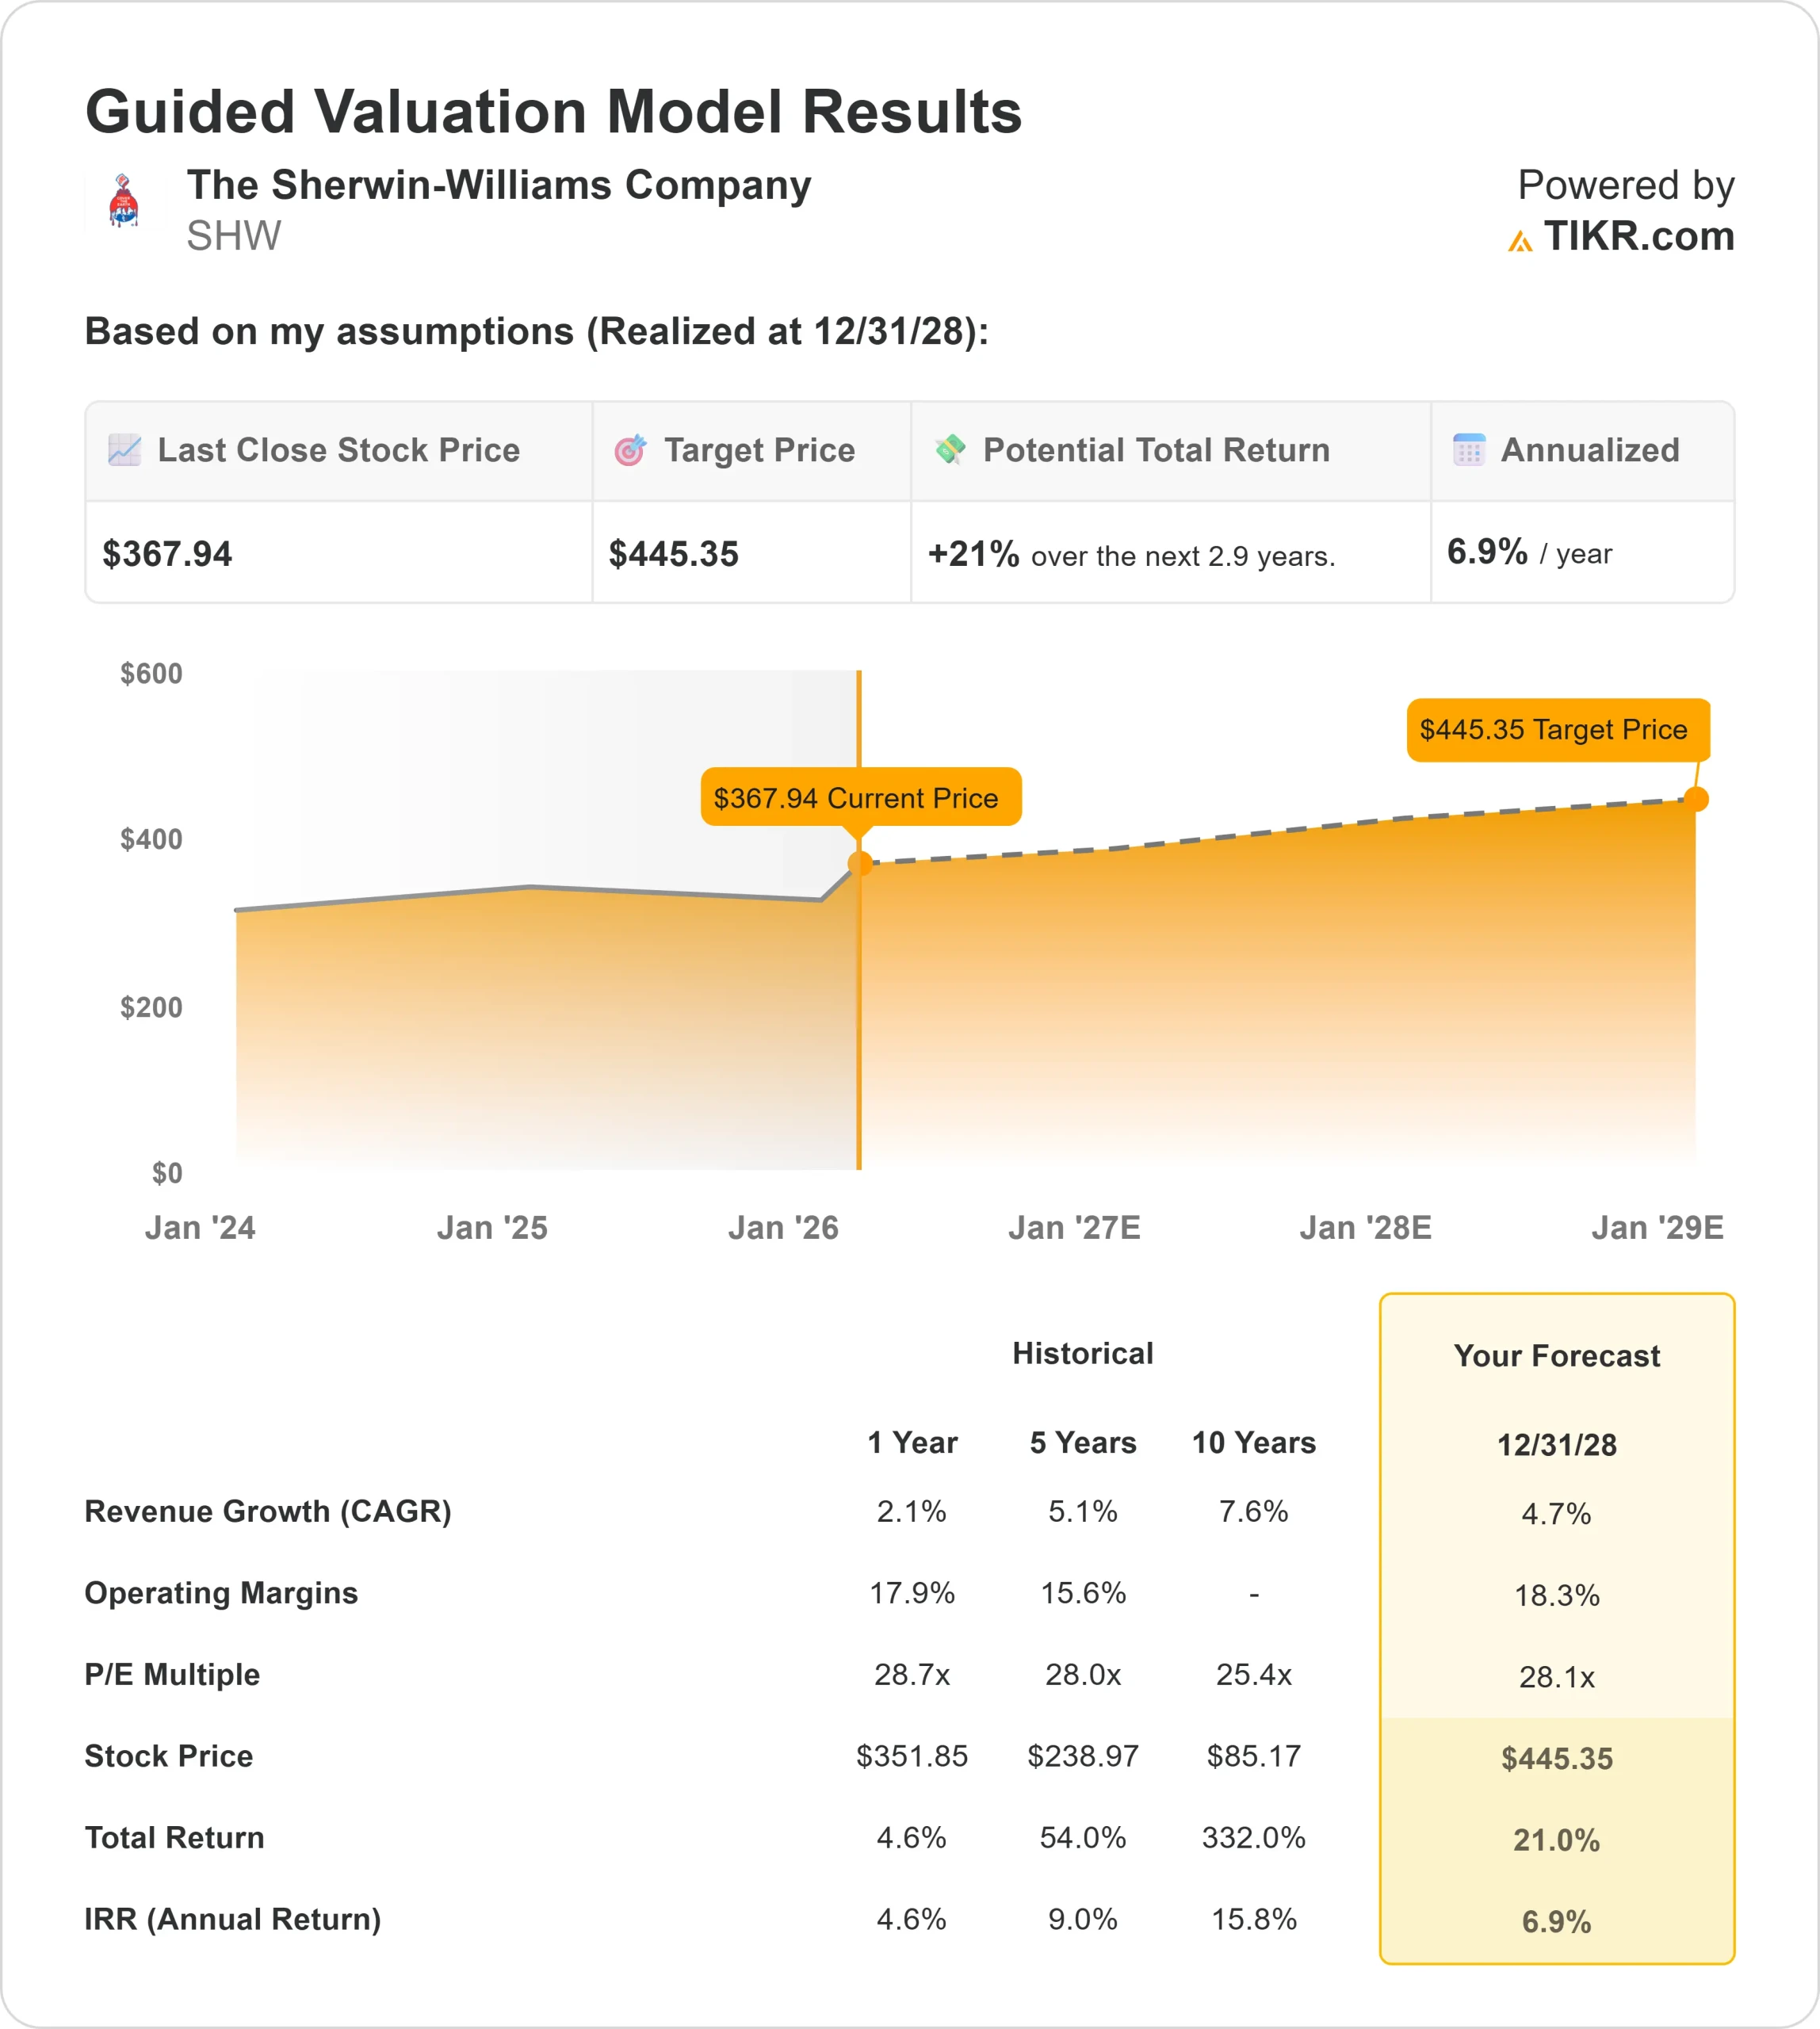
- Valuation Model Target Price: $445
- Implied Upside: 21%
Value your favorite stocks like Sherwin-Williams with 5 years of analysts’ forecasts using TIKR’s new Valuation Model (It’s free) >>>
What Happened?
Sherwin-Williams stock shares moved higher in 2026 as investors gained confidence in the company’s ability to expand margins and grow earnings despite a softer demand environment.
In the fourth quarter, consolidated sales increased by a mid-single-digit percentage, while adjusted diluted EPS rose 6.7%. Adjusted EBITDA grew 13.4% and expanded 120 basis points to 17.7% of sales.
Paint Stores Group margin improved 90 basis points to 20.8%, and Performance Coatings margin climbed 150 basis points to 19%, reflecting disciplined cost control and operating leverage.
CEO Heidi Petz said, “our team delivered record full year consolidated sales and record adjusted diluted earnings per share,” while guiding 2026 adjusted EPS to $11.50 to $11.90, representing 2.4% growth at the midpoint compared to 2025’s $11.43.
Analyst activity reinforced sentiment. Mizuho raised its price target from $400 to $410 and maintained an Outperform rating, implying roughly 11% upside from current levels.
The revision signaled confidence that pricing discipline and cost execution can sustain earnings growth even as demand remains soft across parts of housing and industrial markets.
Institutional positioning remains active. Vanguard increased its stake by 1.4% to 22,637,705 shares, representing about 9.13% ownership, while JPMorgan raised its position by 0.4% to 3,052,021 shares. Although some firms trimmed exposure, overall institutional ownership remains elevated near 77.7%.
See analysts’ growth forecasts and price targets for The Sherwin-Williams Company (It’s free) >>>
Is SHW Undervalued?
Under valuation assumptions, the stock is modeled using:
- Revenue Growth (CAGR): 4.7%
- Operating Margins: 18.3%
- Exit P/E Multiple: 28.1x
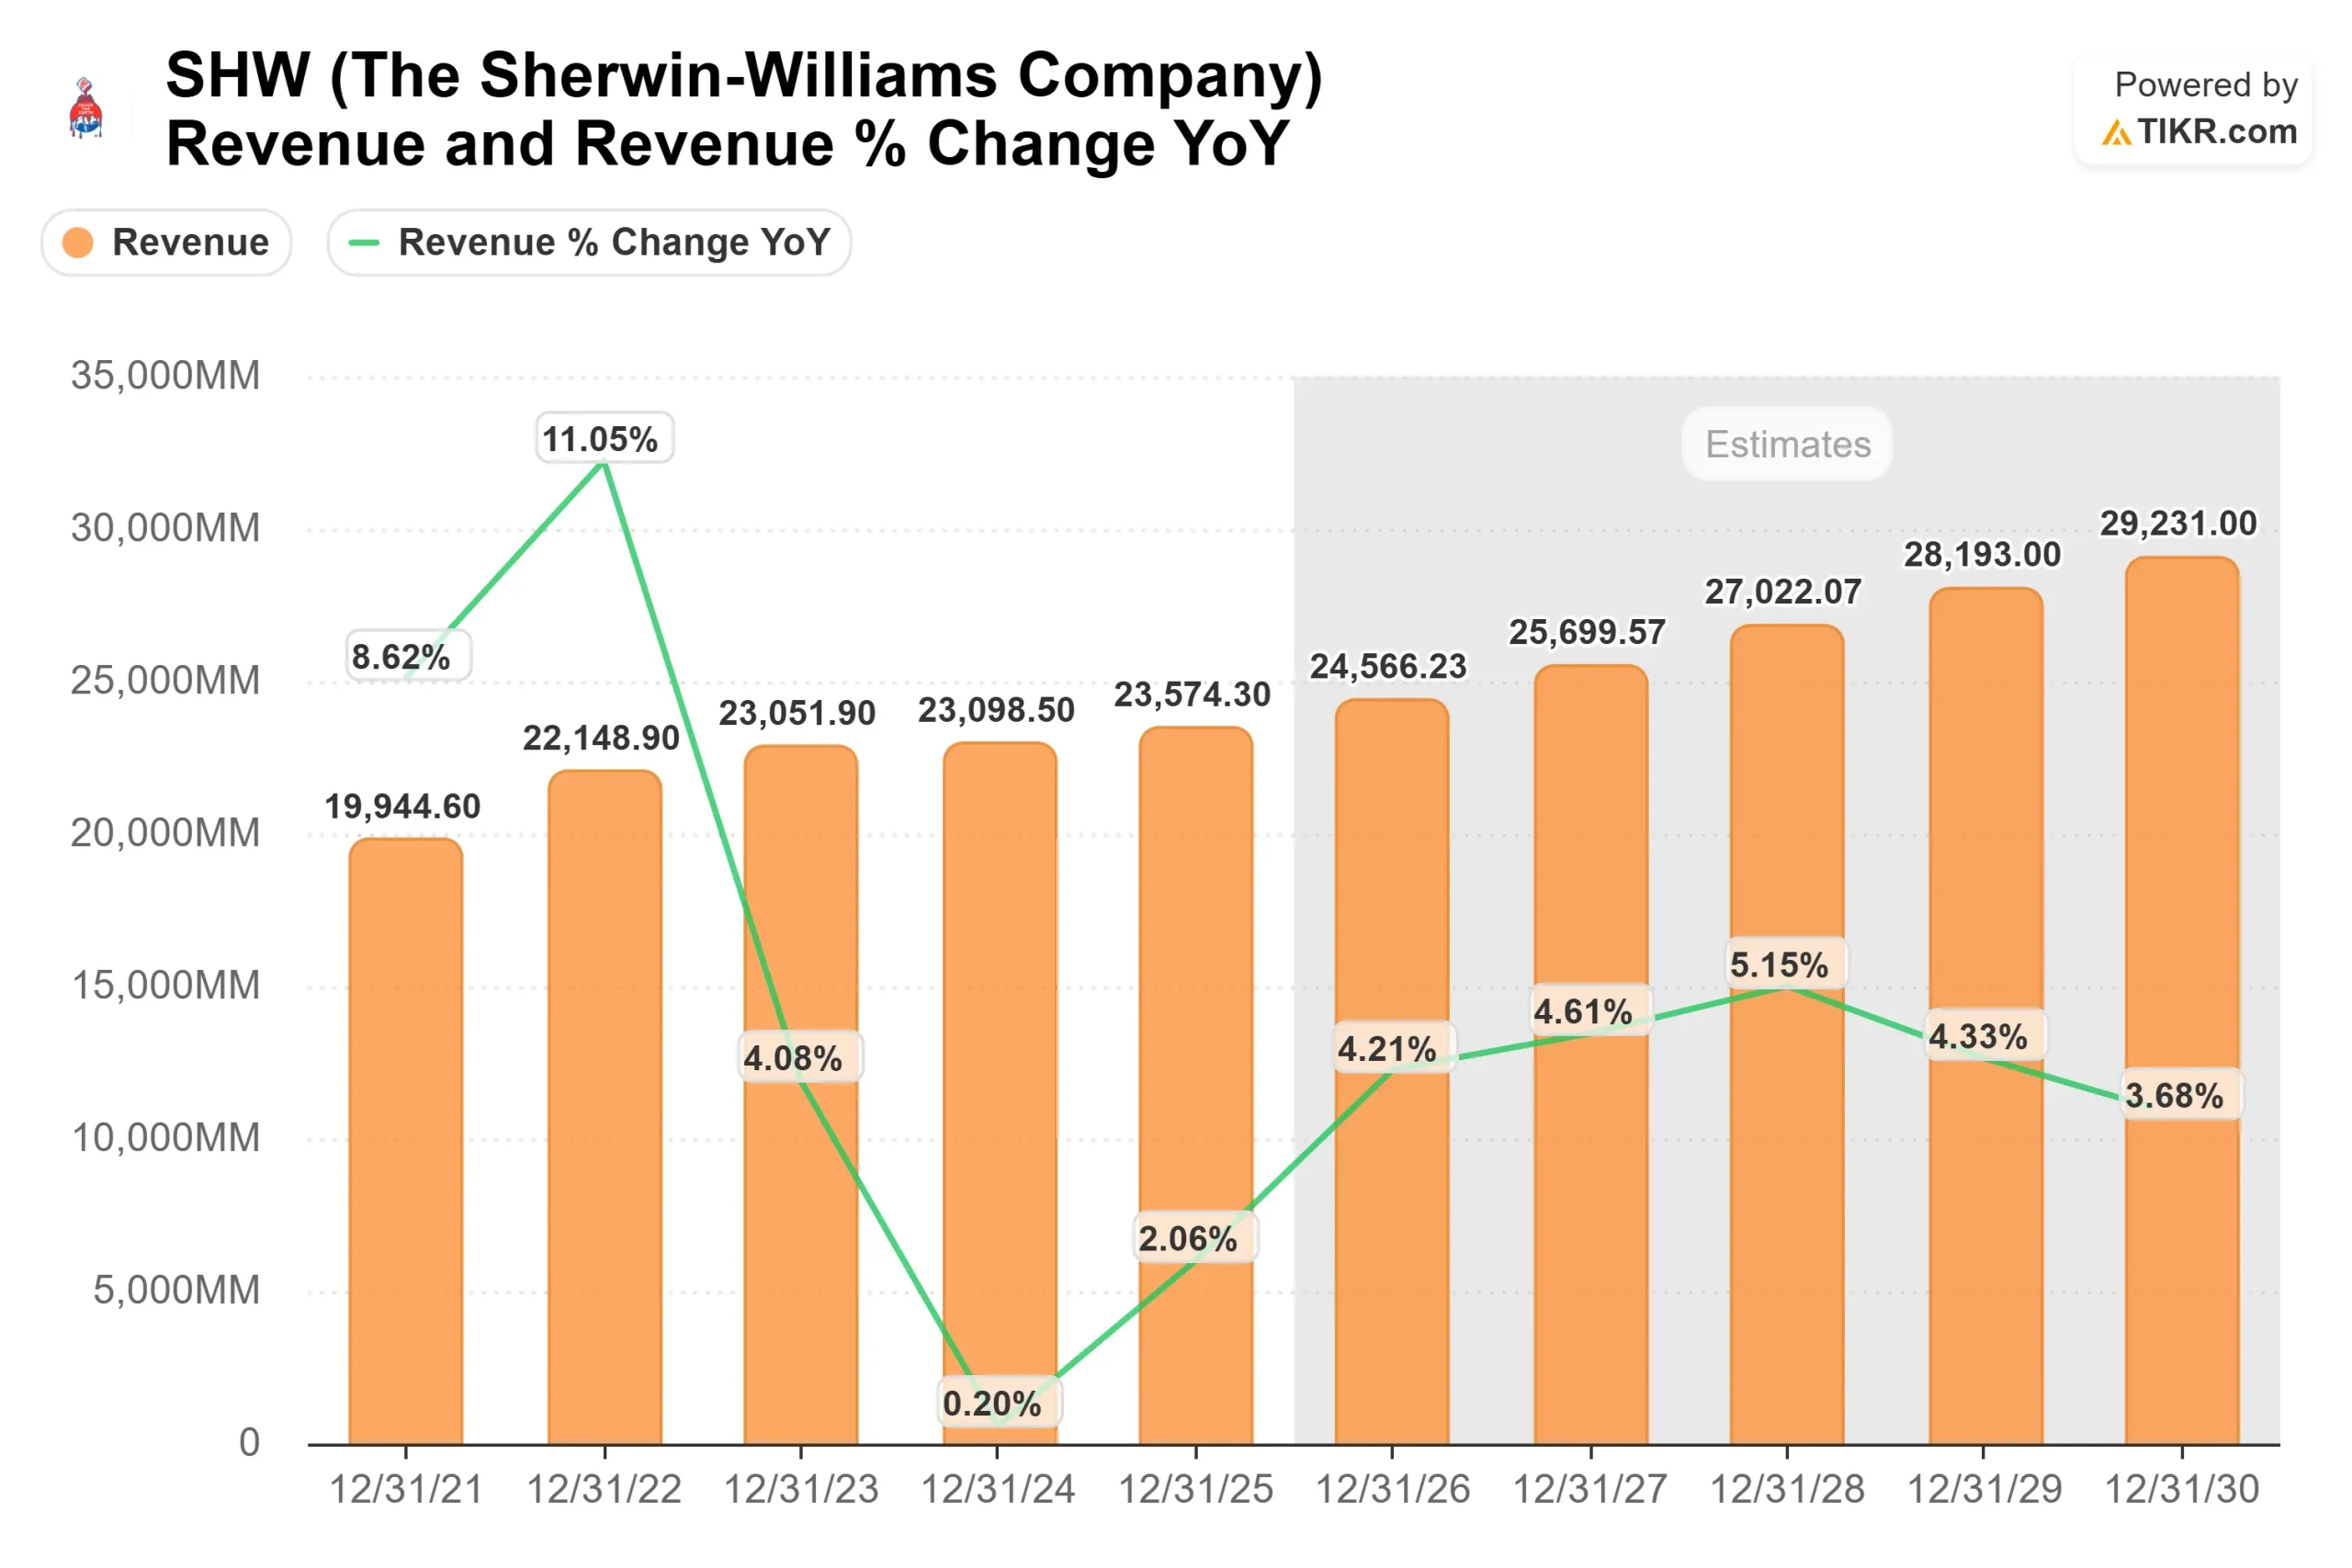
Revenue is projected to increase from approximately $23,574 million in 2025 to about $24,566 million in 2026 based on analyst estimates.
That outlook reflects steady mid-single-digit expansion rather than a sharp cyclical rebound. Despite the stock already rising 14% this year, expectations remain measured, assuming continued share gains and pricing execution rather than an aggressive housing recovery.
Growth in 2026 is expected to be supported by residential repaint share gains, continued strength in Protective & Marine tied to infrastructure and data center construction, and Packaging coatings momentum driven by non-BPA regulatory conversions and new business wins.
The company implemented a 7% price increase effective January 1, with realization expected in the low single-digit range, which should help offset raw material inflation projected to rise by a low single-digit percentage this year.
Margin expansion will likely depend on pricing execution, SG&A discipline, and operating leverage as incremental sales convert efficiently into profit.
Sherwin-Williams also plans to open 80 to 100 net new stores in the U.S. and Canada, expand sales territories, and continue opportunistic share repurchases, reinforcing earnings durability even in a muted demand backdrop.
Based on these inputs, the model estimates a target price of $445, implying about 21% total upside over roughly 2.9 years and an annualized return near 6.9%, indicating the stock appears undervalued under the greater-than-6% annual return framework.
At current levels, Sherwin-Williams appears positioned for steady earnings growth in 2026, supported by pricing power, share gains, margin discipline, and capital allocation strength rather than a sharp cyclical rebound.
Estimate a company’s fair value instantly (Free with TIKR) >>>
Value Any Stock in Under 60 Seconds (It’s Free)
With TIKR’s new Valuation Model tool, you can estimate a stock’s potential share price in under a minute.
All it takes is three simple inputs:
- Revenue Growth
- Operating Margins
- Exit P/E Multiple
From there, TIKR calculates the potential share price and total returns under Bull, Base, and Bear scenarios so you can quickly see whether a stock looks undervalued or overvalued.
If you’re not sure what to enter, TIKR automatically fills in each input using analysts’ consensus estimates, giving you a quick, reliable starting point.
See a stock’s true value in under 60 seconds (Free with TIKR) >>>