Key Takeaways:
- AI Outlook and 2026 Guidance: Freshworks forecast 2026 revenue between $952 million and $960 million on February 10, 2026, above the $945 million consensus, while guiding adjusted EPS of $0.55 to $0.57 versus $0.69 expected, reflecting confidence in AI-driven demand but a higher tax burden weighing on earnings.
- Q4 Earnings Beat: Freshworks reported fourth-quarter revenue of $223 million, up 14% year over year and above the $219 million estimate, alongside adjusted EPS of $0.14 versus $0.11 expected, reinforcing execution strength in customer support and IT service automation.
- Price Target: Based on 10% revenue growth, 36% operating margins, and a 15x exit multiple, Salesforce stock could reach $249 by January 2028 from $190 today.
- Return Profile: Salesforce implies 31% total upside from $190 to $249 over 1.9 years, equating to a 15% annualized return supported by 36% operating margins and continued double-digit revenue growth across enterprise AI deployments.
Breaking Down the Case for Salesforce, Inc.
Last week, Salesforce (CRM) forecast 2026 revenue between $952 million and $960 million, topping the $945 million consensus estimate while guiding adjusted EPS of $0.55 to $0.57 versus $0.69 expected, signaling sustained AI-driven demand but pressure from a higher projected tax rate.
Fourth-quarter revenue reached $223 million, rising 14% year over year and exceeding the $219 million estimate, while adjusted EPS of $0.14 surpassed $0.11 expected, reinforcing operating momentum across Freshdesk and Freshservice as enterprises automate IT workflows.
Fiscal year revenue of $38 billion in the most recent reported period expanded 9% while gross margins exceeded 75%, and operating margins climbed above 20% as disciplined SG&A and R&D spending translated into durable profitability.
Chief Executive Officer Dennis Woodside stated on the February 10 Reuters interview “we’ve spent a decade to build a system of record and a system of interaction that understands everything about your IT environment,” underscoring a strategy built around integrated AI rather than seat compression risk.
Recent sector volatility intensified after Anthropic launched enterprise plugins on January 30, 2026, triggering software stock selling, yet management emphasized growing user counts and share gains from larger incumbents despite usage-based AI pricing models.
The investment tension centers on whether sustained 10% revenue growth and 36% operating margins justify a 15x exit multiple and a $249 target by January 2028 from $190 today, implying 31% upside and a 15% annualized return that depends on execution without AI-driven pricing disruption.
What the Model Says for Salesforce Stock
AI-driven enterprise expansion across healthcare clients produced $41 billion fiscal guidance while 36% operating margins improved from 30%, yet forward P/E compression from 32x to 15x constrains valuation upside.
The model’s assumption underwrites 10% revenue growth, 36% operating margins, and a 15x exit multiple, producing a $249 target price by January 2028, reflecting margin expansion versus the recent 30% level.
The market assumption for the forward P/E as of February 2026 stands at 15x, down from 32x in January 2025, as sector repricing reduced investor willingness to pay above 20x, and the model’s 15x exit sits in line.
The model delivers 31.3% total upside and a 14.9% annualized return from $189.72, sitting above the 10% equity hurdle rate, as sustained 36% margins support earnings needed to close that gap.
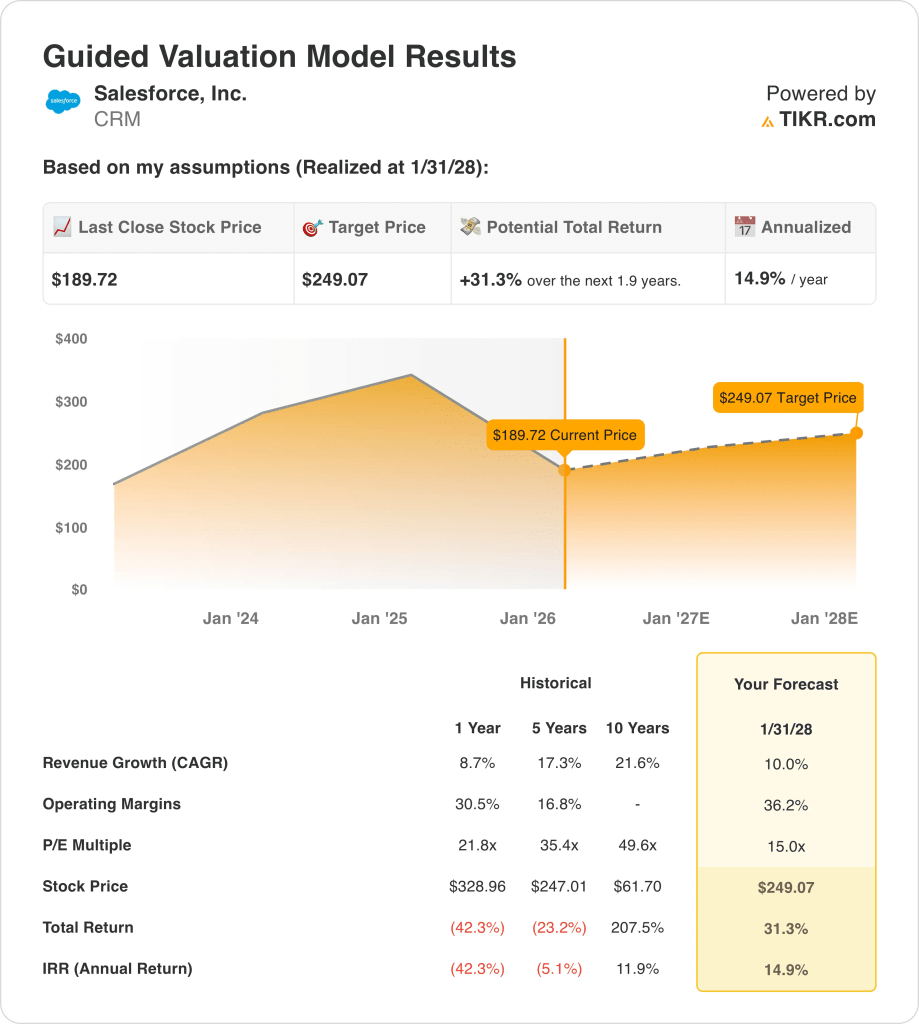
The model signals a Buy for CRM stock, as a 14.9% annualized return clears the 10% equity hurdle rate, and the $249 target by January 2028 rewards investors at the current $189.72 share price.
With a 14.9% annualized return sitting above the 10% equity hurdle, the model signals capital appreciation, as the $249 target by January 2028 compensates investors for execution risk at the current valuation.
Our Valuation Assumptions
TIKR’s Valuation Model lets you plug in your own assumptions for a company’s revenue growth, operating margins, and P/E multiple, and calculates the stock’s expected returns.
Here’s what we used for Salesforce stock:
1. Revenue Growth: 10%
Salesforce stock grew revenue 8.7% in fiscal 2025 to $38 billion after 11% growth in fiscal 2024 to $35 billion, showing a clear slowdown from earlier years as scale increases.
The next fiscal year revenue estimate of $41 billion implies 9.5% growth, placing the model’s assumption near near-term expectations while requiring consistent expansion across the installed base rather than a one-time reacceleration.
Sustaining 10.0% through January 2028 requires renewal strength to hold at enterprise scale, cross-sell to lift average spend per customer, and net new demand to remain resilient as seat growth becomes harder to sustain.
If revenue lands 2 points below plan on a $41 billion base, the shortfall removes roughly $820 million of annual sales that also pressures operating leverage, leaving less earnings for the 36.2% margin path and limiting what a 15.0x exit can capitalize.
This sits above the 1-year revenue growth of 8.7%, as larger revenue scale makes incremental growth harder to repeat, and the model requires steady execution to keep growth from slipping below the estimate track.
2. Operating Margins: 36.2%
Salesforce stock reported 33.0% EBIT margins over the last twelve months, with 30.5% in fiscal 2024 and 33.0% in fiscal 2025, reflecting multi-year margin expansion.
The model’s assumption of 36.2% embeds further operating leverage above the current 33.0% level, while forward EBIT margins are estimated at 34.1%, showing the model leans moderately optimistic.
Reaching 36.2% requires disciplined SG&A control, sustained gross margins near 77%, and limited reinvestment pressure as AI capabilities scale across the platform.
A 1 point margin miss on a $41 billion revenue base equals roughly $410 million of lost operating income, directly reducing terminal earnings that the 15.0x exit multiple capitalizes.
This sits above the 1-year operating margin of 33.0%, as the model assumes continued cost discipline, and margin expansion must persist without expense re-acceleration.
3. Exit P/E Multiple: 15x
The 15.0x exit multiple capitalizes Salesforce stock’s normalized earnings in January 2028 after the model already embeds 10.0% revenue growth and 36.2% operating margins.
The model’s earnings base assumes both growth and margin expansion, so the exit multiple functions as a conservative terminal anchor rather than an additional valuation lever.
The market assumption for forward P/E stands at 15.02x as of February 13, 2026, down from 31.67x on January 31, 2025, reflecting substantial valuation compression.
If margins stall near 33% and growth remains near 8%, the sustainable multiple trends toward low-teens territory, compressing the $249 target materially below modeled outcomes.
This sits below the 1-year historical P/E of 21.8x, as market sentiment has reset lower, and sustaining 15.0x through January 2028 requires earnings expansion without execution slippage.
What Happens If Things Go Better or Worse?
Salesforce stock results are driven by enterprise software spending stability, AI monetization traction, and sustained cost discipline through 2030.
- Low Case: If enterprise budgets tighten and AI upsell slows, revenue grows 8.5% and net margins hold 29.2% → 9.4% annualized return.
- Mid Case: With steady renewal strength and disciplined spending, revenue grows 9.4% and net margins reach 31.1% → 15.8% annualized return.
- High Case: If AI adoption accelerates and operating leverage strengthens, revenue reaches 10.4% and net margins approach 32.6% → 21.8% annualized return.

How Much Upside Does Salesforce Stock Have From Here?
With TIKR’s new Valuation Model tool, you can estimate a stock’s potential share price in under a minute.
All it takes is three simple inputs:
- Revenue Growth
- Operating Margins
- Exit P/E multiple
If you’re not sure what to enter, TIKR automatically fills in each input using analysts’ consensus estimates, giving you a quick, reliable starting point.
From there, TIKR calculates the potential share price and total returns under Bull, Base, and Bear scenarios so you can quickly see whether a stock looks undervalued or overvalued.
Looking for New Opportunities?
- See what stocks billionaire investors are buying so you can follow the smart money.
- Analyze stocks in as little as 5 minutes with TIKR’s all-in-one, easy-to-use platform.
- The more rocks you overturn… the more opportunities you’ll uncover. Search 100K+ global stocks, global top investor holdings, and more with TIKR.
Disclaimer:
Please note that the articles on TIKR are not intended to serve as investment or financial advice from TIKR or our content team, nor are they recommendations to buy or sell any stocks. We create our content based on TIKR Terminal’s investment data and analysts’ estimates. Our analysis might not include recent company news or important updates. TIKR has no position in any stocks mentioned. Thank you for reading, and happy investing!