
Key Stats for Occidental Petroleum Stock
- Last 30-Day Performance: 6%
- 52-Week Range: $35 to $53
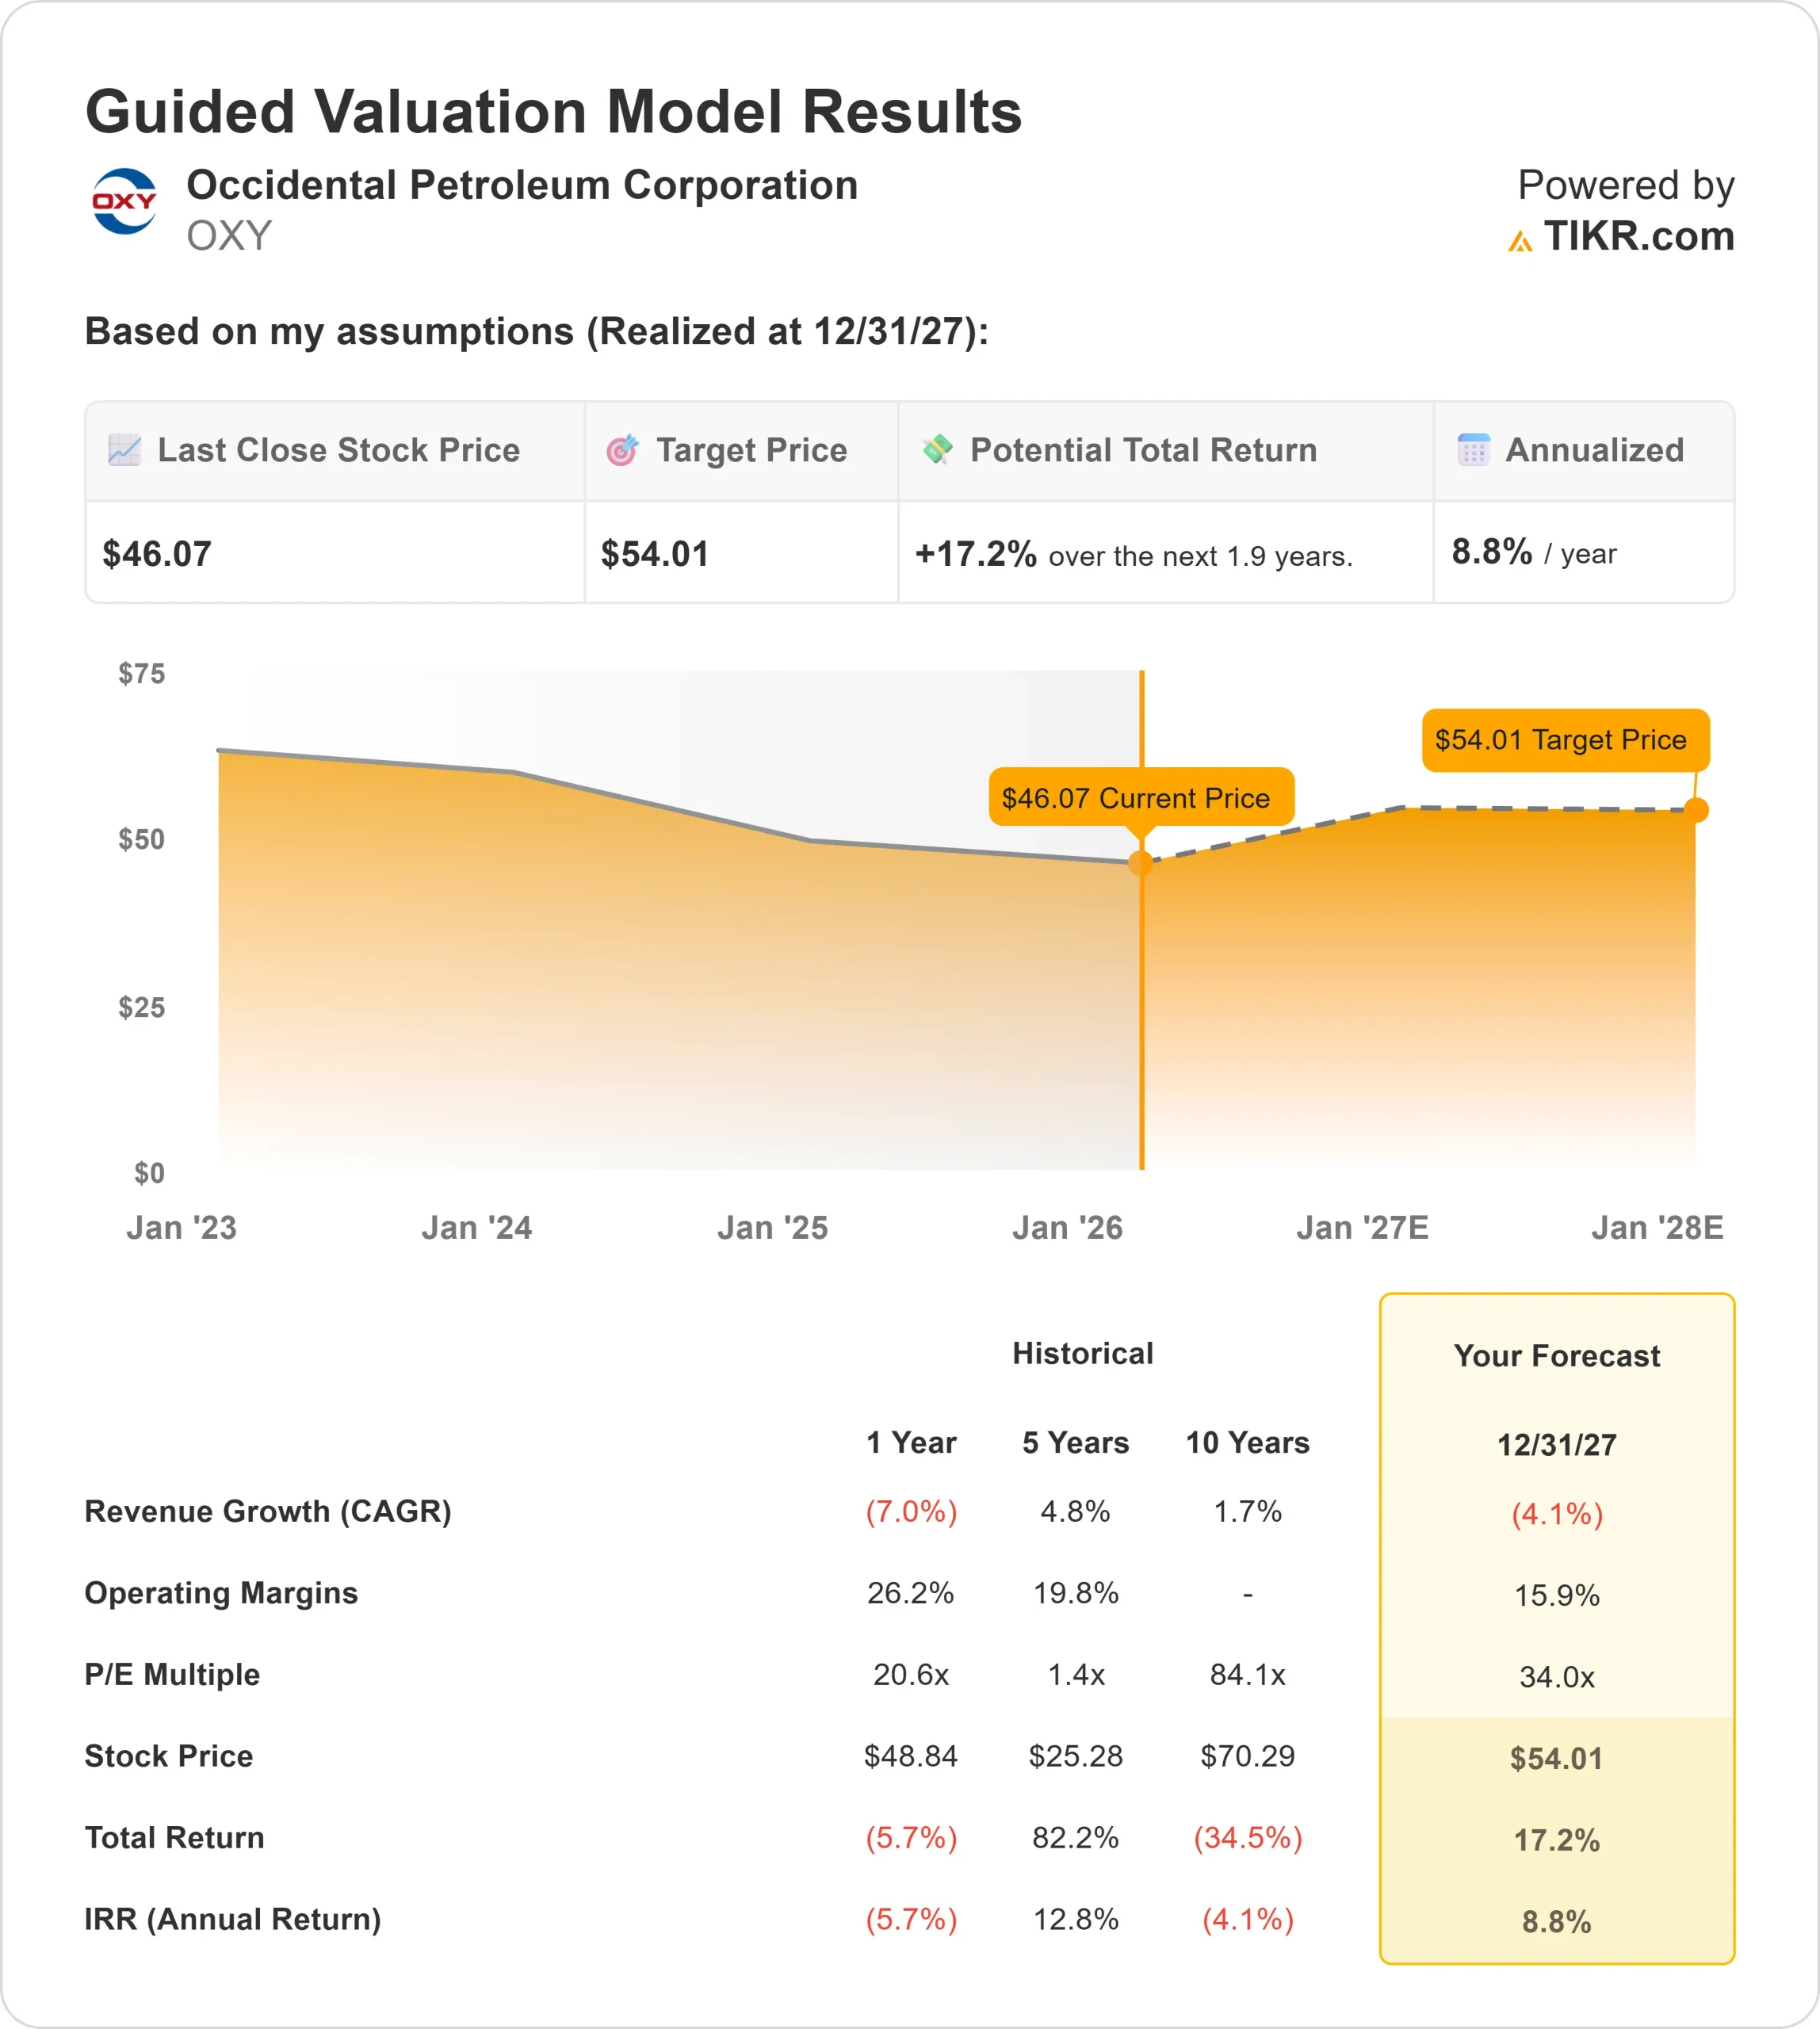
- Valuation Model Target Price: $54
- Implied Upside: 17%
Value your favorite stocks like Occidental Petroleum with 5 years of analysts’ forecasts using TIKR’s new Valuation Model (It’s free) >>>
What Happened?
Occidental Petroleum stock rose about 6% in the last 30 days, recently trading near $46 per share as investors responded to firmer oil prices, updated analyst commentary, and renewed institutional activity.
The stock moved higher primarily because crude oil prices stabilized and sentiment improved after TD Cowen upgraded Occidental to a Hold, reducing near-term downgrade risk and signaling that downside pressure may be limited.
That combination of firmer commodity pricing and a more balanced analyst stance supported incremental buying over the past month.
The broader analyst consensus remains Hold with 7 Buys, 11 Holds, and 5 Sells and an average price target of $47.48, which sits slightly above the current price and reinforces expectations of modest near-term upside heading into earnings.
Recent 13F filings showed active portfolio repositioning. Illinois Municipal Retirement Fund trimmed its stake by 19.5%, selling 41,292 shares, while Thrivent Financial cut its position by 50.9%, selling 39,435 shares.
At the same time, CIBC World Market increased its stake by 25% to 322,781 shares worth about $15.25 million, Canada Post Corp boosted its holdings by 275.4%, and firms including Caprock Group LLC and Carrera Capital Advisors initiated new positions, signaling continued institutional engagement with the stock.
At the World Economic Forum in Davos, U.S. Energy Secretary Chris Wright said the world needs to “more than double oil production,” noting global supply stood at 107.4 million barrels per day last month, while Occidental CEO Vicki Hollub emphasized oil’s long-term role amid regulatory pressures in Europe and California.
The discussion reinforced the structural demand backdrop that continues to influence sentiment toward U.S. energy producers.
See analysts’ growth forecasts and price targets for Occidental Petroleum (It’s free) >>>
Is Occidental Petroleum Undervalued?
Under valuation assumptions, the stock is modeled using:
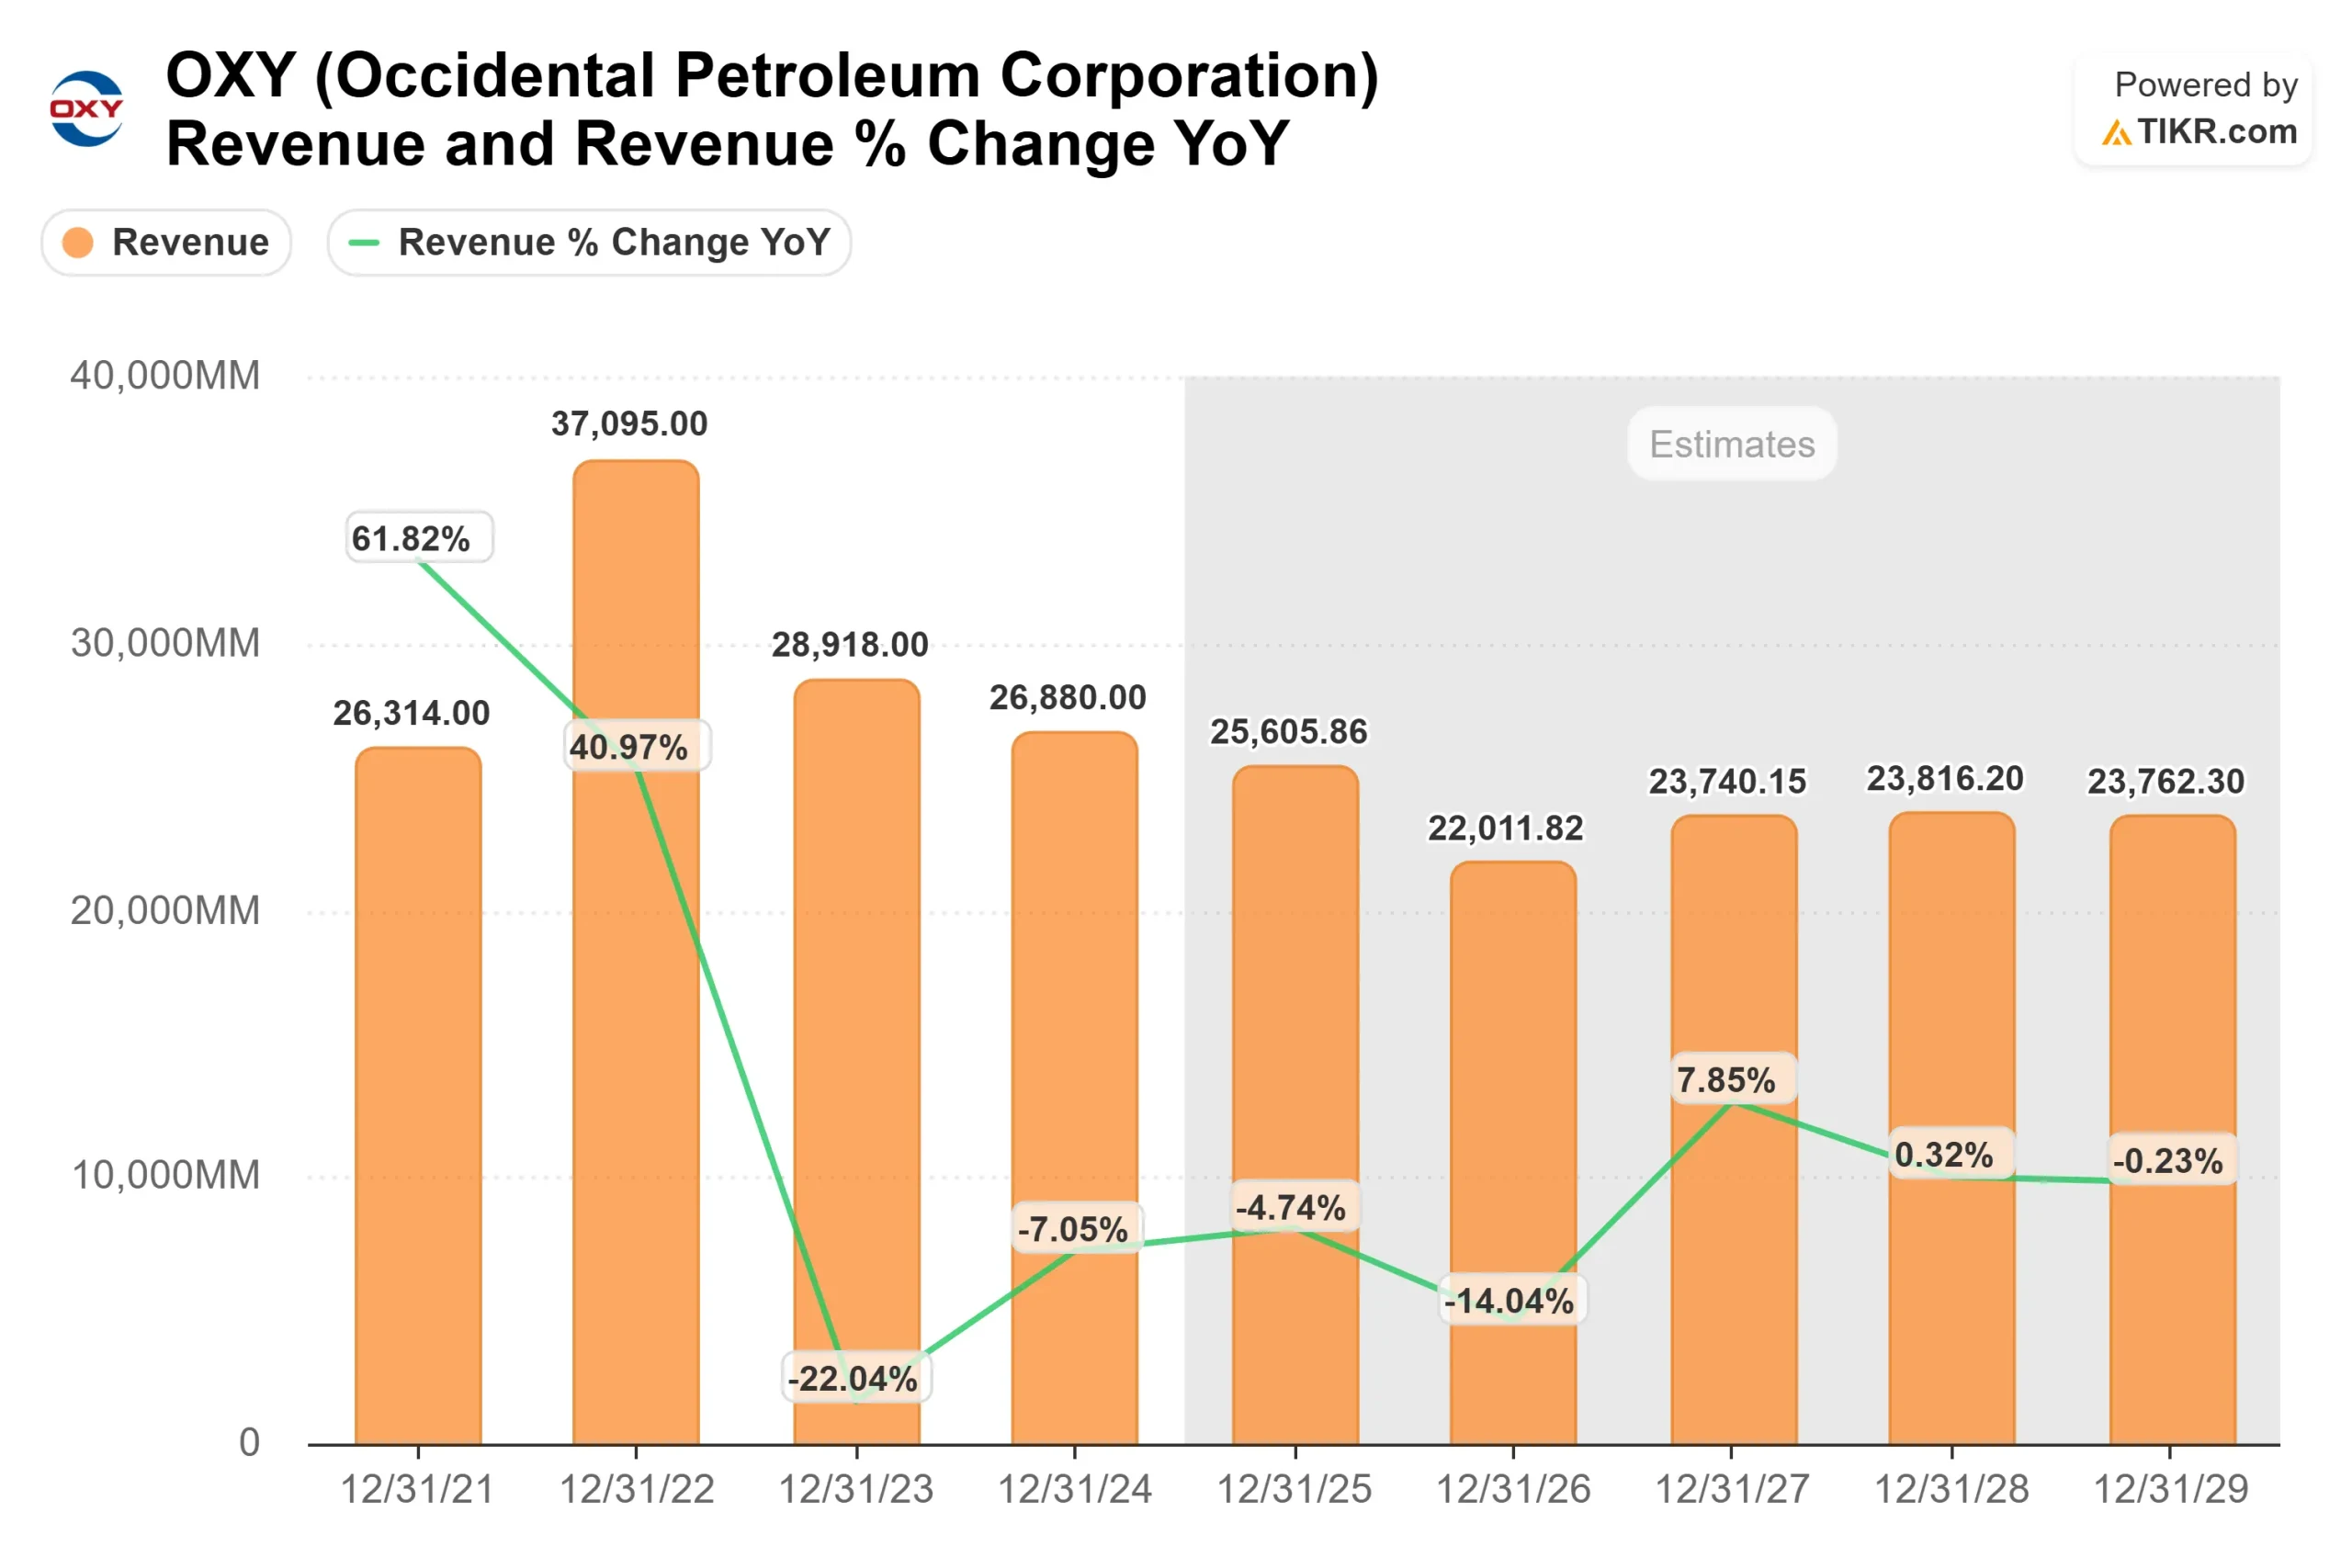
- Revenue Growth (CAGR): -4.1%
- Operating Margins: 15.9%
- Exit P/E Multiple: 34x
Revenue expectations reflect normalization in oil prices compared to prior peaks, yet OXY’s portfolio remains concentrated in the Permian Basin, where lower lifting costs and high-margin drilling inventory support meaningful free cash flow even in a mid-cycle pricing environment.
CrownRock integration strengthens this positioning by expanding premium drilling inventory and improving capital efficiency, allowing production growth without materially increasing spending, which supports return on capital over time.
Direct Air Capture and carbon management initiatives provide longer-term optionality, as federal incentives and industrial partnerships could create incremental revenue streams beyond traditional upstream production.
Continued debt reduction lowers interest expense and increases financial flexibility, expanding capacity for dividends and buybacks if commodity prices remain stable.
Based on these inputs, the model estimates a target price of $54, implying about 17% total upside over roughly 1.9 years, indicating the stock appears undervalued at current prices.
At current levels near $46, valuation largely reflects mid-cycle oil assumptions, while performance over the next 12 months will likely be driven by Permian execution, disciplined capital allocation, CrownRock integration, and sustained free cash flow generation.
Estimate a company’s fair value instantly (Free with TIKR) >>>
Value Any Stock in Under 60 Seconds (It’s Free)
With TIKR’s new Valuation Model tool, you can estimate a stock’s potential share price in under a minute.
All it takes is three simple inputs:
- Revenue Growth
- Operating Margins
- Exit P/E Multiple
From there, TIKR calculates the potential share price and total returns under Bull, Base, and Bear scenarios so you can quickly see whether a stock looks undervalued or overvalued.
If you’re not sure what to enter, TIKR automatically fills in each input using analysts’ consensus estimates, giving you a quick, reliable starting point.
See a stock’s true value in under 60 seconds (Free with TIKR) >>>