Key Stats for Fastenal Stock
- Year-to-Date Performance: 20%
- 52-Week Range: $35 to $51
- Valuation Model Target Price: $54
- Implied Upside: 17%
Value your favorite stocks like Fastenal with 5 years of analysts’ forecasts using TIKR’s new Valuation Model (It’s free) >>>
What Happened?
Fastenal Company stock is up about 20% year to date, recently trading near $46 per share as investors reacted to strong fourth-quarter results and record full-year performance.
Shares have steadily climbed following the company’s January 20 earnings release, reflecting renewed confidence in its growth trajectory despite a mixed industrial backdrop.
The stock moved higher because Fastenal delivered double-digit Q4 sales growth and record annual revenue, reinforcing that it is gaining market share even while industrial production remains uneven.
The company reported Q4 net sales of $2.03 billion, up 11%, with net income rising 12.2% to $294.1 million and EPS of $0.26. For full-year 2025, sales reached a record $8.2 billion, up close to 9%, while net income increased 9.4% to $1.26 billion.
Management highlighted structural growth drivers heading into 2026. In Q4, 46.1% of sales were transacted through FMI devices and 62.1% of total revenue flowed through its combined digital footprint.
Contract customers increased by 241 accounts, up just over 7%, and the installed base of active FMI devices grew 7.6% year over year to about 136,600 units.
CEO Dan Florness said the team “feel really good about the momentum” and noted the company anticipates double-digit net sales growth in 2026 supported by digital integration and key account expansion.
The rally reflects growing investor confidence that Fastenal can continue gaining share, leveraging its digital infrastructure, and expanding margins even if broader industrial production remains flat.

See analysts’ growth forecasts and price targets for Fastenal (It’s free) >>>
Is Fastenal Undervalued?
Under valuation assumptions, the stock is modeled using:
- Revenue Growth (CAGR): 8%
- Operating Margins: 21
- Exit P/E Multiple: 33x
Fastenal currently trades at about 42x trailing earnings, above its longer-term historical average, but the valuation assumes earnings growth continues through share gains and operating leverage rather than multiple expansion.
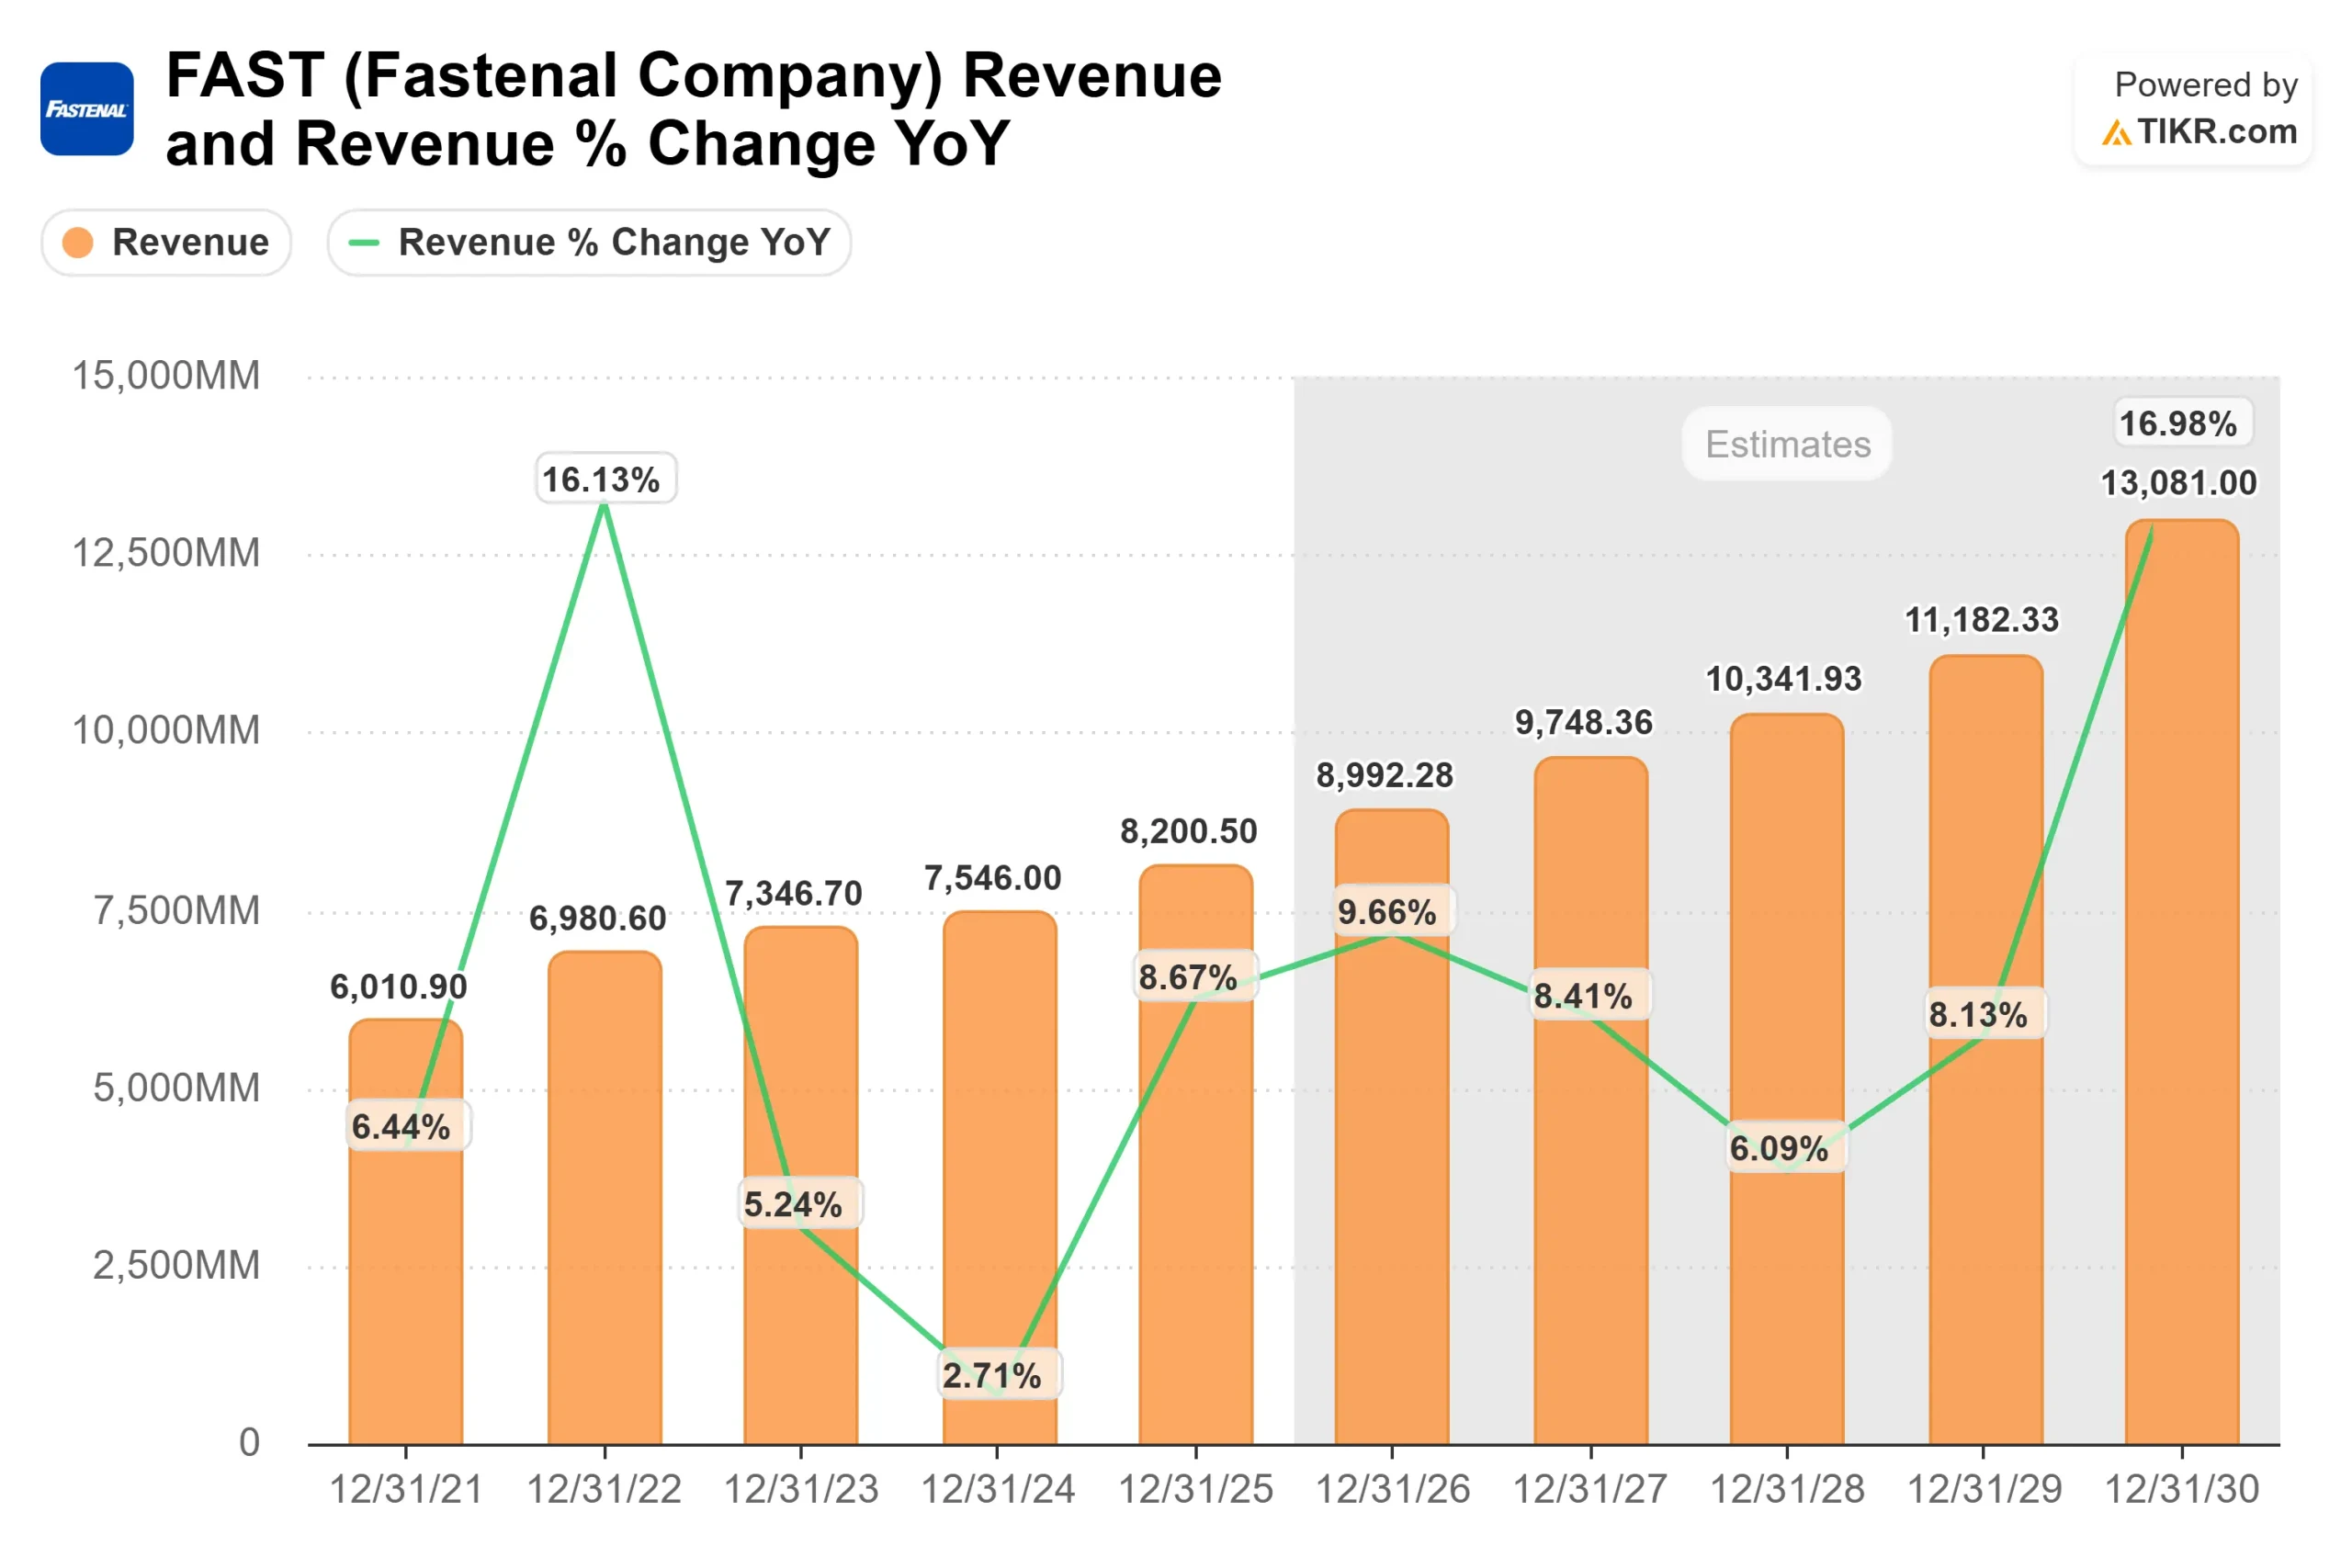
Revenue is projected to grow from approximately $8.2 billion in 2025 to about $9.0 billion in 2026, reflecting continued contract signings and strong digital penetration.
Analyst estimates show revenue continuing to expand toward roughly $10.3 billion by 2028, supporting the view that growth has reaccelerated after 2024’s slowdown.
Digital integration remains a key earnings driver. In Q4, 46.1% of revenue flowed through FMI devices and 62.1% through the broader digital footprint.
As vending, bin programs, and e-business scale further in 2026, customer retention strengthens and operating leverage improves through higher throughput and lower servicing costs per dollar of revenue.
Margin discipline also supports the outlook. SG&A declined to 25.4% of sales in Q4 from 25.9% a year earlier, and return on invested capital increased by 90 basis points to around 31%.
If management delivers anticipated double-digit net sales growth in 2026, incremental margins could expand without a proportional rise in costs.
Based on these inputs, the valuation model estimates a target price of $54, implying about 17% total upside.
Despite the strong 20% year-to-date rally, Fastenal appears undervalued, with 2026 performance likely driven by sustained market share gains, digital expansion, and disciplined execution rather than multiple expansion alone.
Estimate a company’s fair value instantly (Free with TIKR) >>>
Value Any Stock in Under 60 Seconds (It’s Free)
With TIKR’s new Valuation Model tool, you can estimate a stock’s potential share price in under a minute.
All it takes is three simple inputs:
- Revenue Growth
- Operating Margins
- Exit P/E Multiple
From there, TIKR calculates the potential share price and total returns under Bull, Base, and Bear scenarios so you can quickly see whether a stock looks undervalued or overvalued.
If you’re not sure what to enter, TIKR automatically fills in each input using analysts’ consensus estimates, giving you a quick, reliable starting point.
See a stock’s true value in under 60 seconds (Free with TIKR) >>>