Stock prices reflect a combination of current earnings and expectations for the future. While most investors focus on forecasting a company’s earnings, a more disciplined approach is to work backward from the current market price. This process helps you understand exactly what level of growth the market is already willing to pay for today.
By reverse-engineering the implied growth rate, you shift from guessing to evaluating market assumptions. This section of your analysis is vital because it reveals whether a stock is priced for perfection or for pessimism. You can then decide if those expectations are realistic based on historical performance and industry trends.
The goal is to find a disconnect between the market’s implied growth rate and the company’s fundamental reality. If the market expects 15% annual growth but the business has structural limits at 8%, the stock is likely overvalued. Conversely, if a durable business is priced for zero growth, you may have found an undervalued opportunity.
The Purpose of Reverse Discounted Cash Flow
A reverse Discounted Cash Flow (DCF) model is the primary tool for this analysis. This section is included because it removes the bias often found in traditional forecasting. Instead of projecting numbers to reach a target price, you adjust the growth inputs until the model’s value matches the current stock price.
This method forces you to confront the market’s consensus directly. It provides a specific number that represents the required growth rate to justify your investment. If a stock trades at a high multiple, the implied growth rate will often be significantly higher than the company’s historical average.
Understanding the market’s starting point helps you avoid overpaying for growth that is already priced in. You are not necessarily looking for the highest-growth company, but for the best gap between expectations and reality. This disciplined framework ensures you stay focused on the price you pay relative to the value you receive, and this holds for companies as large as Walmart and even those much smaller.
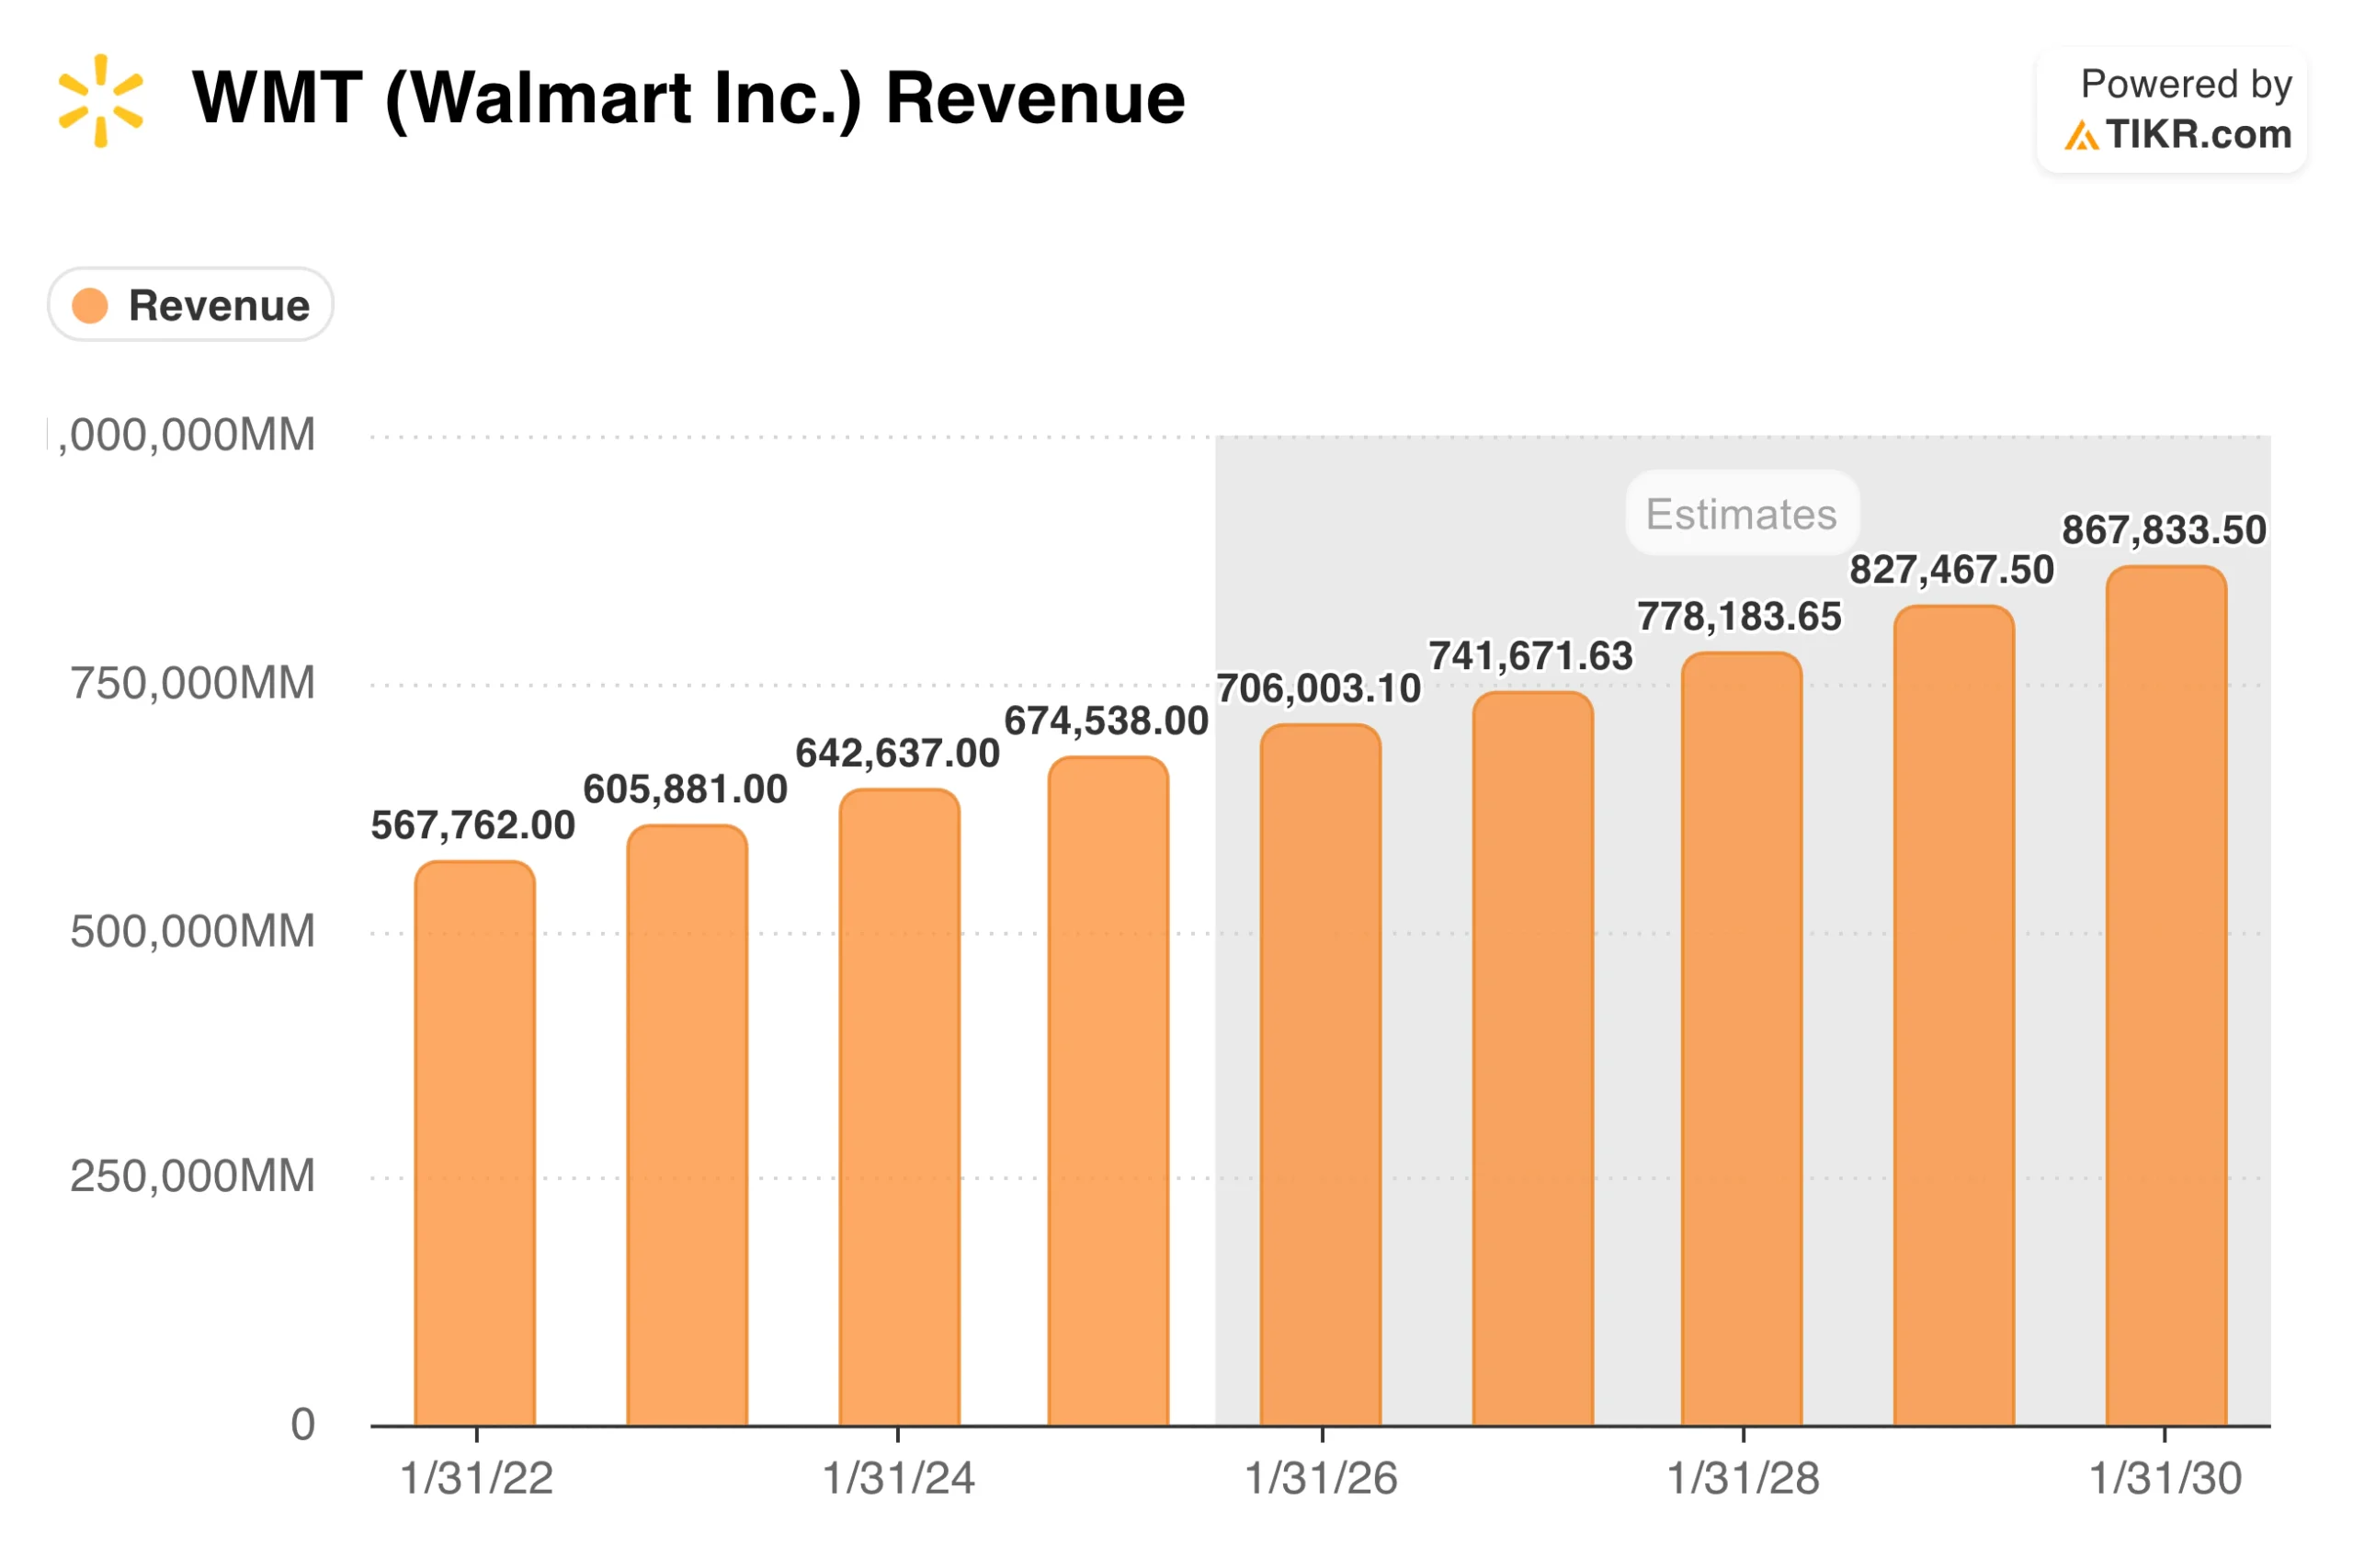
TIKR Tip: Use the Estimates tab in TIKR to see what Wall Street analysts currently project for revenue and earnings growth for companies like Walmart (WMT) over the next several years to compare against your implied growth findings.
Evaluate analyst estimates for revenue growth in under 60 seconds (Free with TIKR) >>>
Valuation Multiples as Growth Proxies
Valuation multiples such as P/E or EV/EBITDA serve as shorthand for implied growth and returns. This section explains how to use these ratios to quickly gauge market sentiment. A high multiple indicates the market expects rapid expansion or significant margin improvement in the future.
Comparing a company’s current multiple to its historical range reveals shifts in market expectations. If a business trades at 25x earnings but has historically traded at 15x, the market is implying a permanent acceleration in growth or a lower risk profile. You must determine if the business has fundamentally changed to justify this new valuation.
Multiples are also useful for peer comparisons within the same industry. If one company trades at a significant premium to its rivals, it implies the market expects it to gain share or operate more efficiently. Using multiples as a starting point allows you to see where the market is placing its bets before you dive into the detailed math.
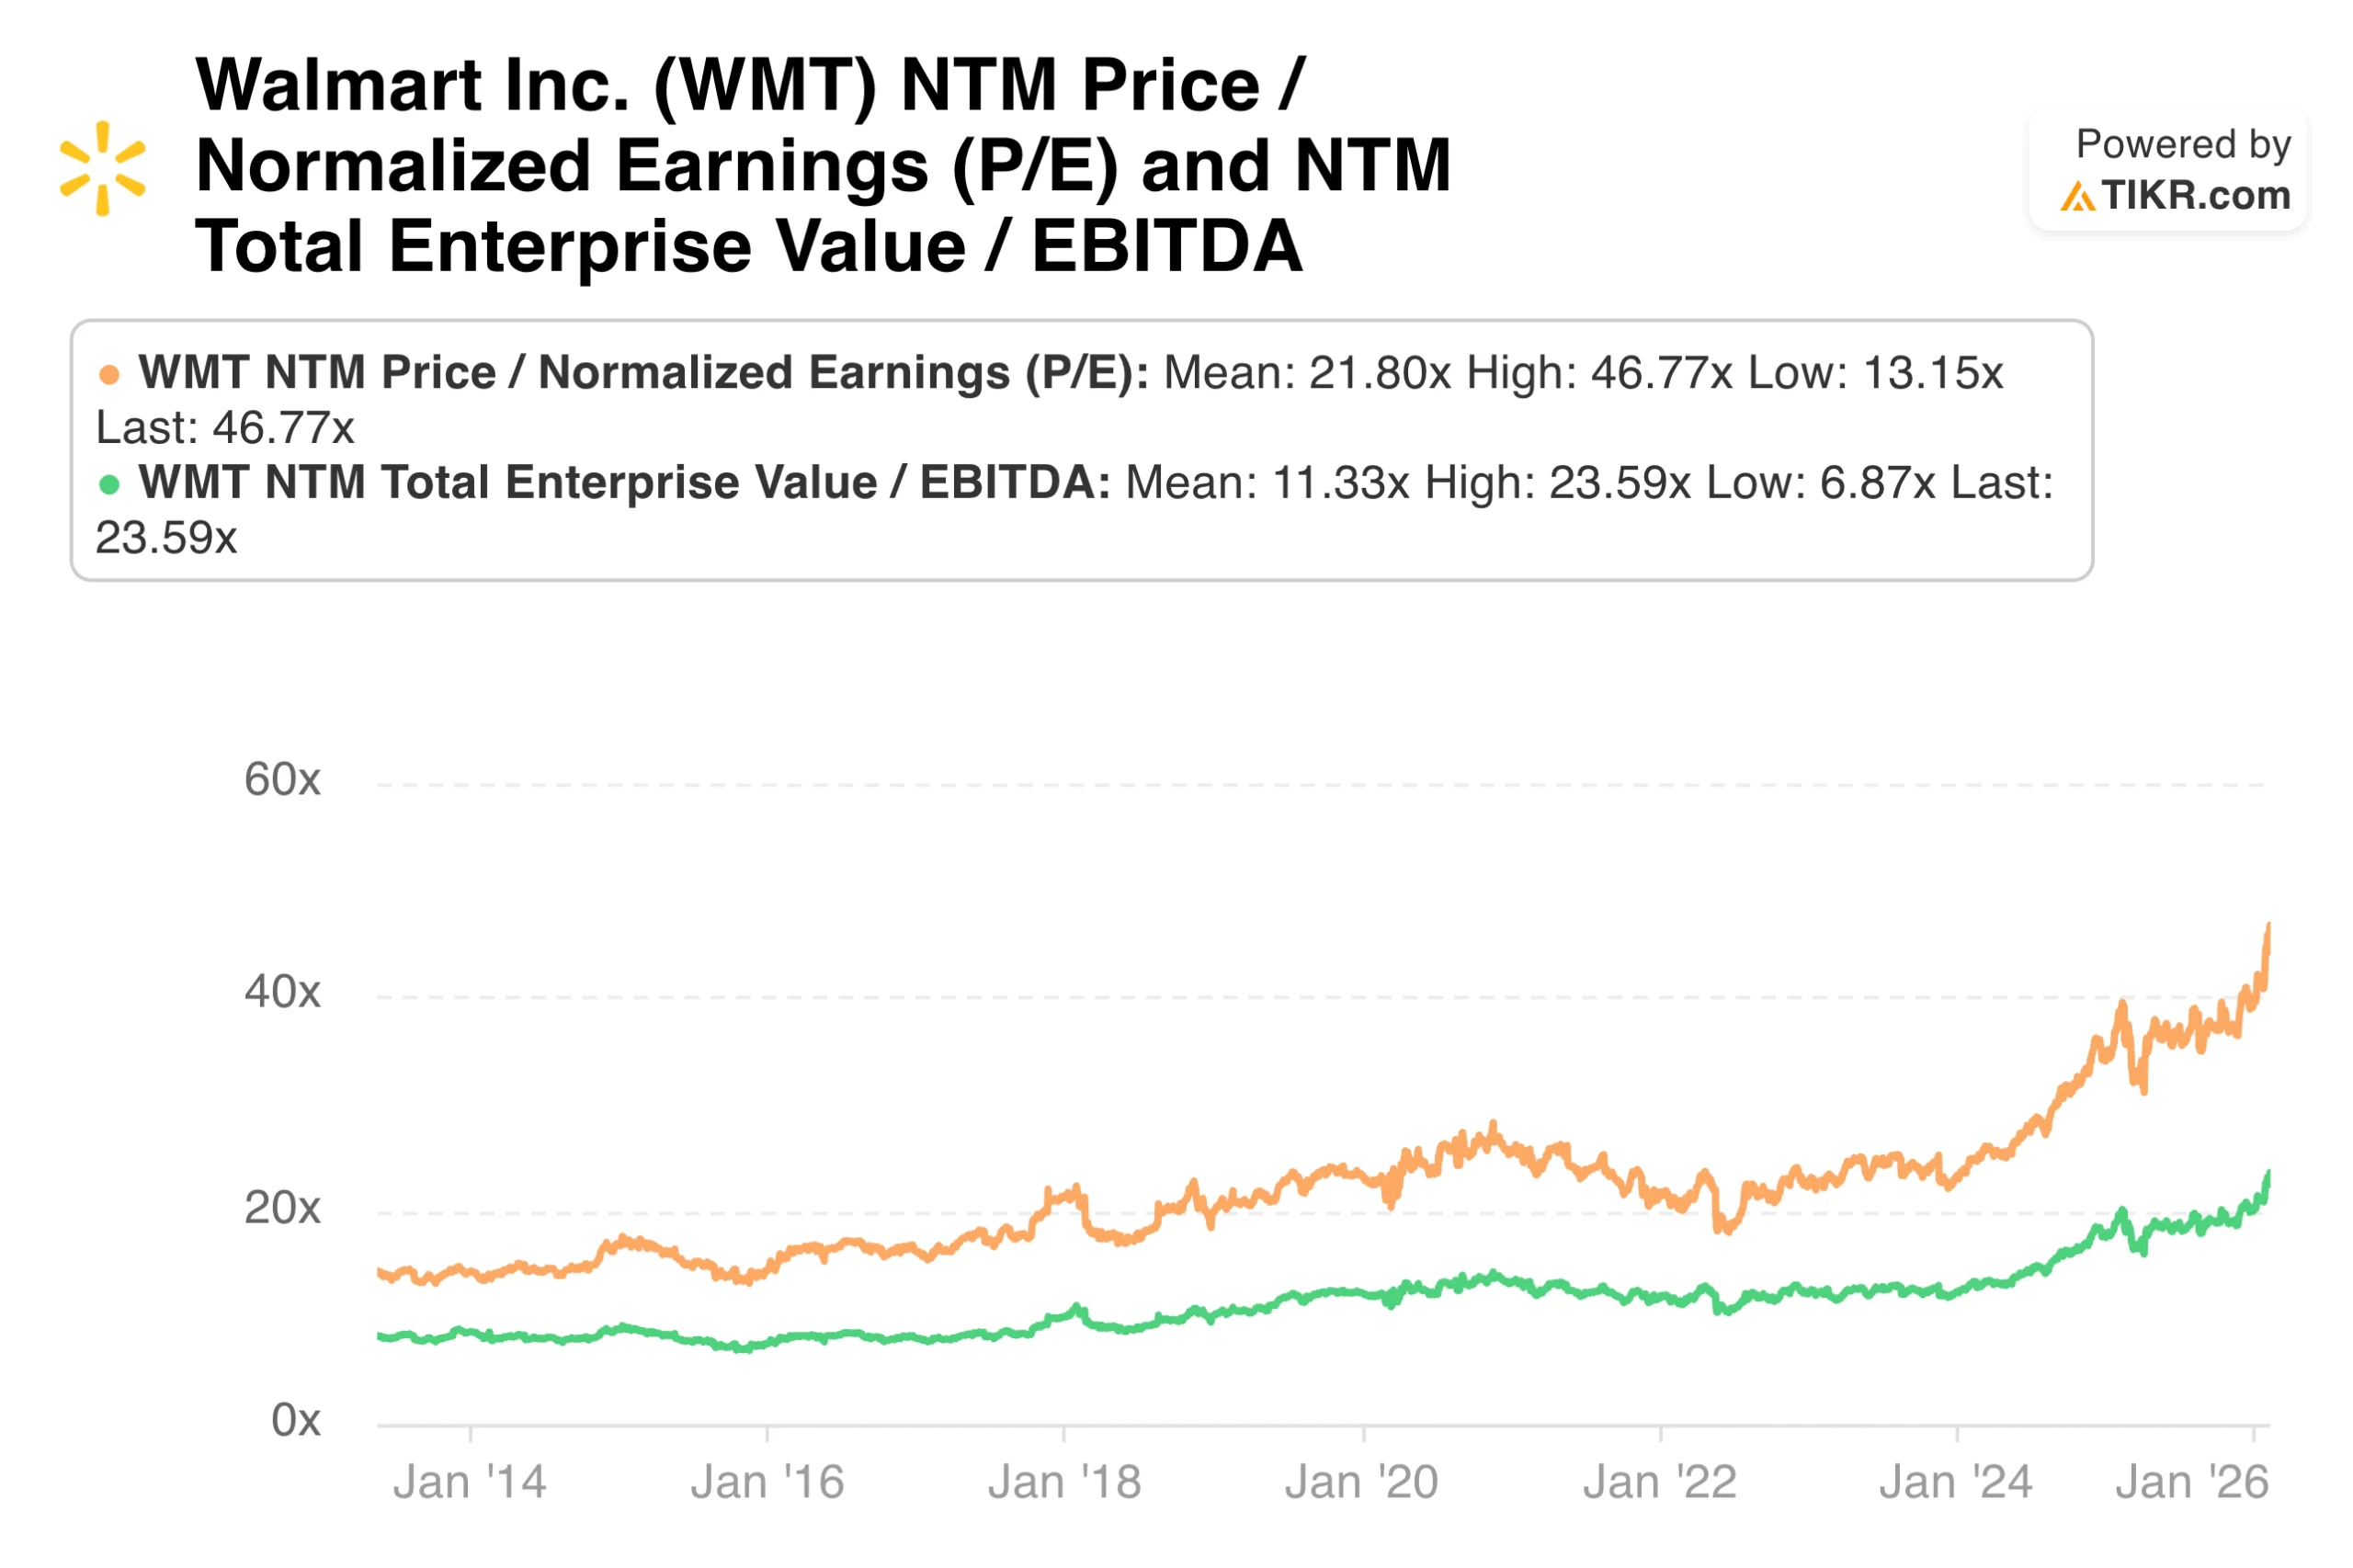
TIKR Tip: Check the Valuation section in TIKR to view historical NTM P/E and TEV/EBITDA charts, which help you see how the market’s growth expectations have fluctuated over time.
Assessing the Reliability of Growth Drivers
Once you know the implied growth rate, you must evaluate the company’s ability to achieve it. This section is essential because growth requires capital, market share gains, or pricing power. You are assessing whether the company has the operational tools necessary to meet the market’s high standards.
Examine the company’s historical Return on Capital (ROC) to see if it can fund this growth internally. High-growth expectations are easier to meet if the company generates enough cash from operations to reinvest without taking on debt. If growth requires heavy external financing, the risk of missing market expectations increases significantly.
Management’s track record of meeting guidance also signals future reliability. Consistent execution suggests that the implied growth rate might be a conservative estimate. If a company regularly misses its targets, the market’s implied growth rate is likely a trap that will lead to a downward valuation re-rating.
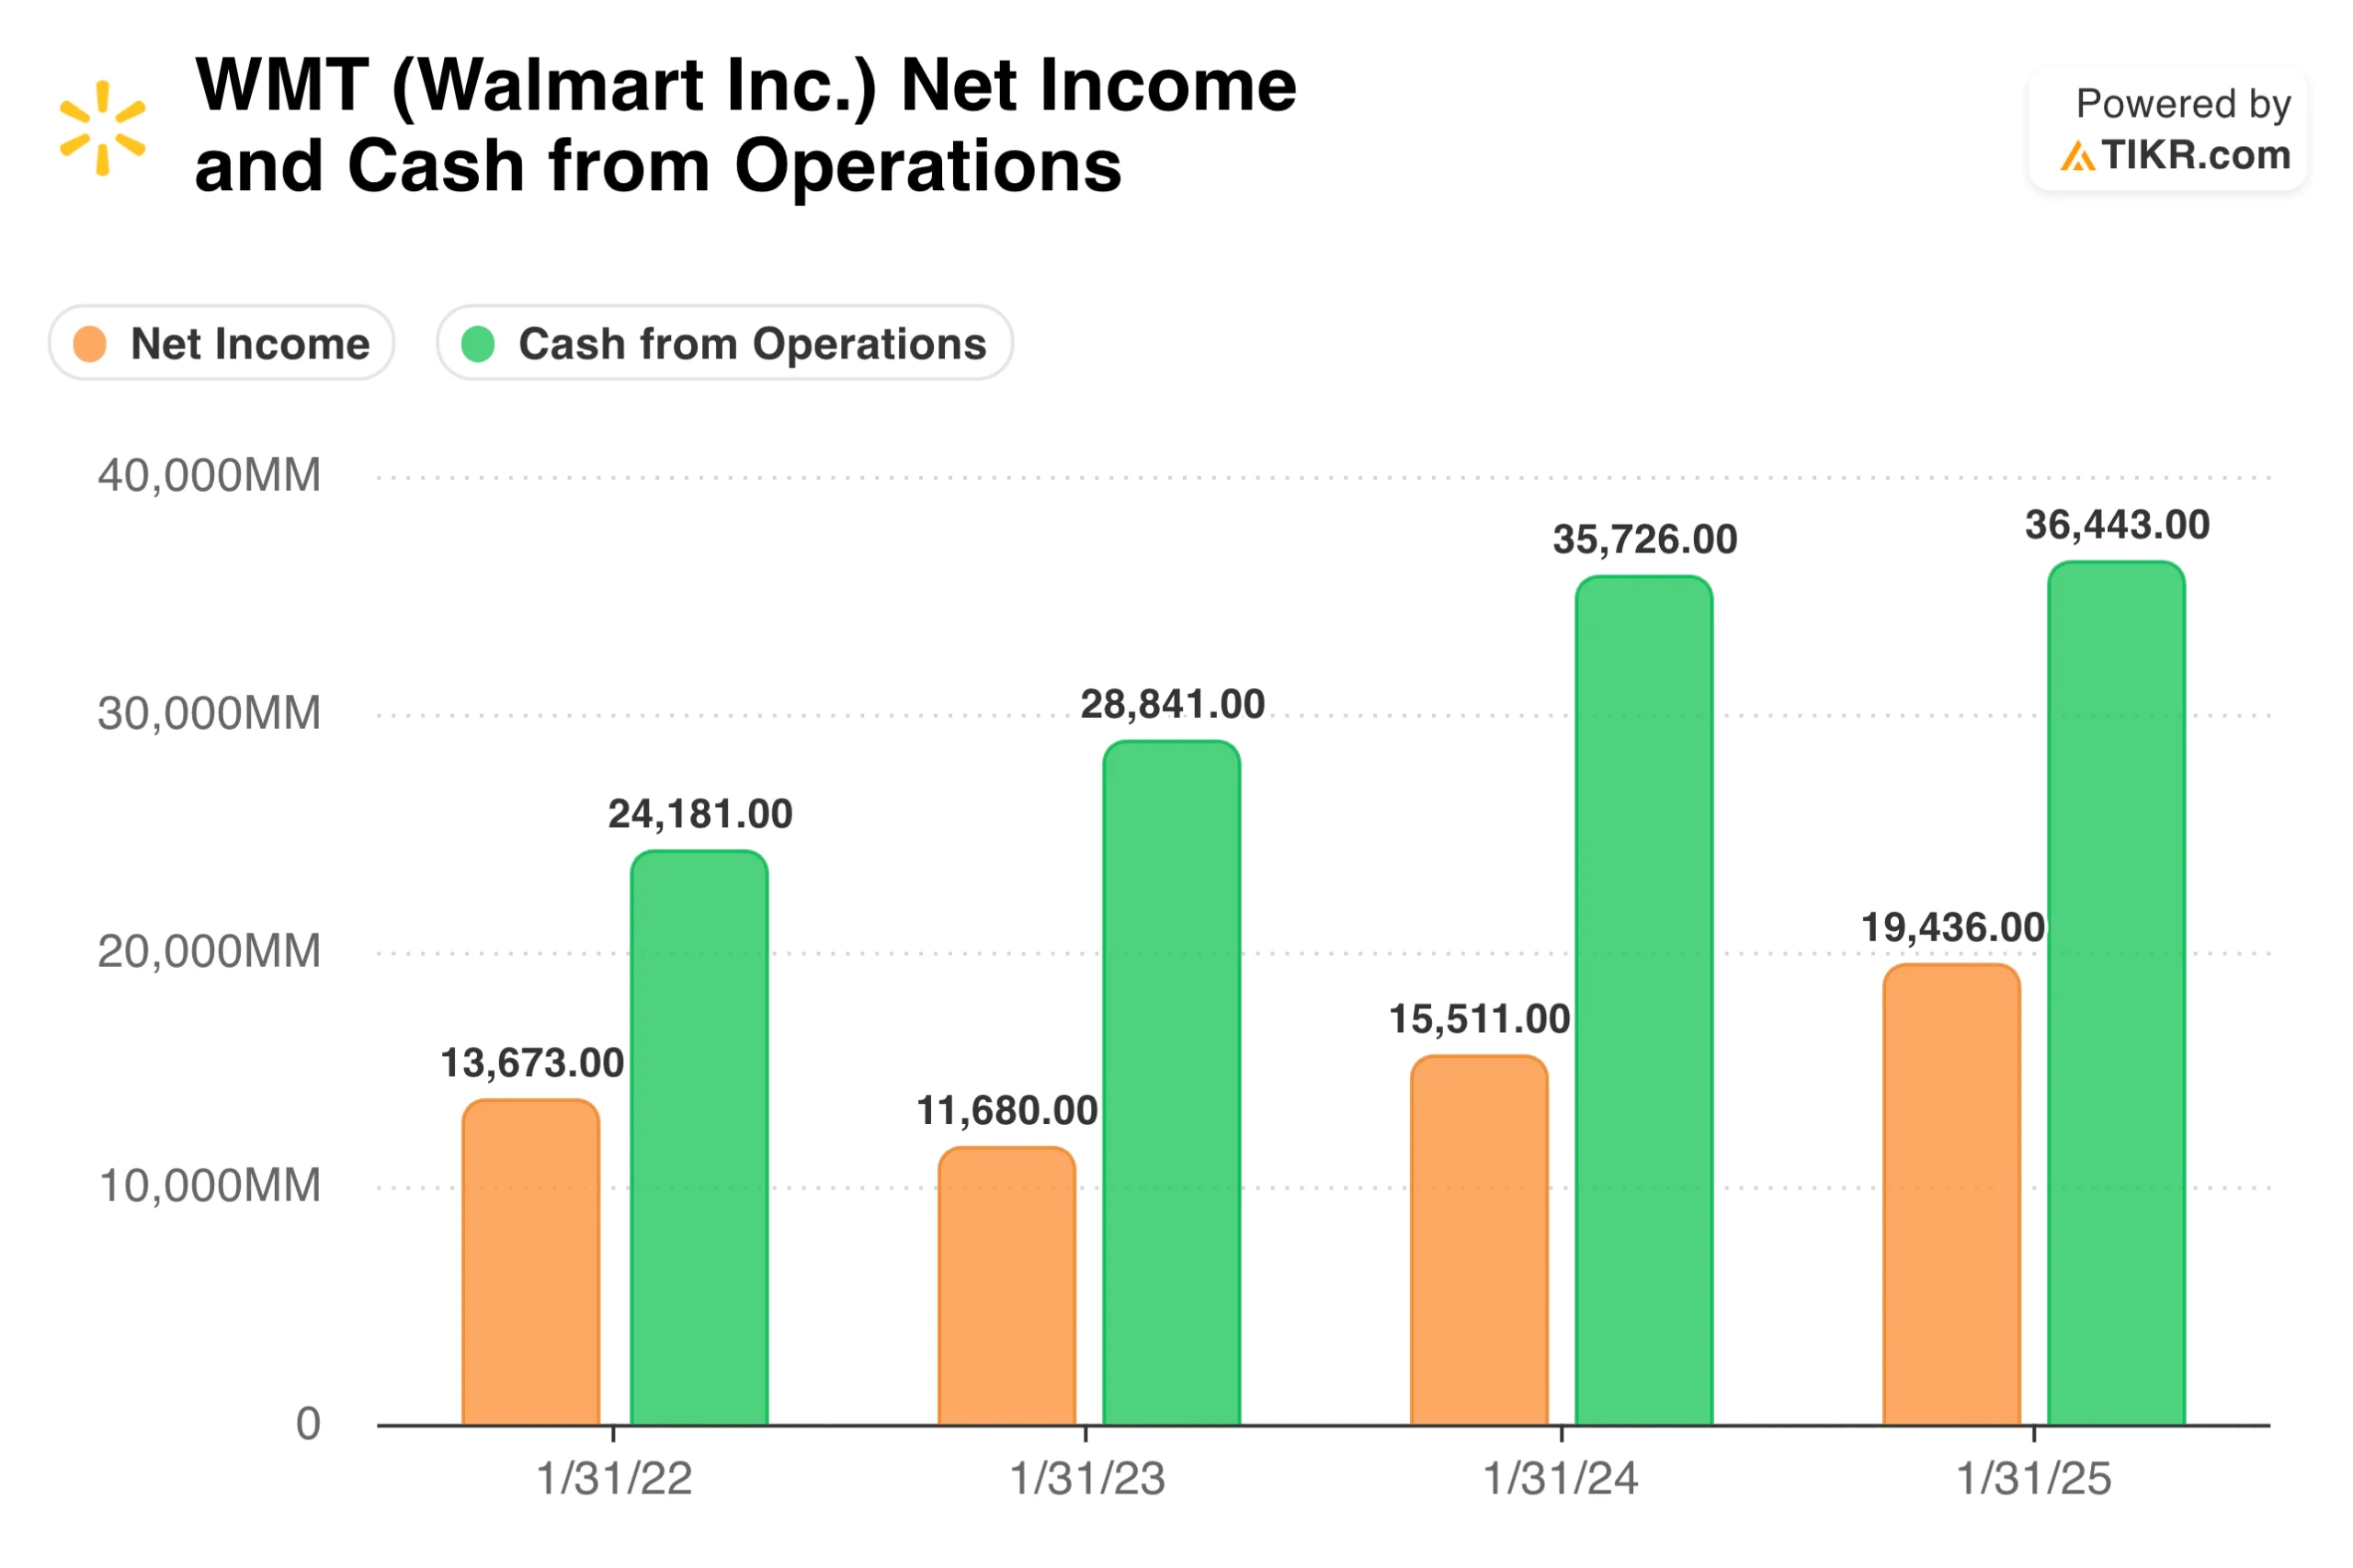
TIKR Tip: Look at the Cash Flow Statement in TIKR’s Detailed Financials to see if “cash from operations” is growing in line with net income, which confirms the quality of the growth.
Get the most up-to-date net income information across thousands of stocks with TIKR (It’s free) >>>
The Role of Margin Expansion in Implied Growth
Implied growth does not always come from higher sales; it can also come from expanding profit margins. This section is included because the market often prices in significant efficiency gains for maturing businesses. If the implied growth rate is high but revenue is flat, the market is betting on a leaner cost structure.
You must analyze whether current margins are at peak levels or if there is room for further improvement. If a company already has industry-leading margins, the market’s expectation for further expansion may be unrealistic. This is a common trap in sectors where competition eventually forces prices down.
Sustainability is the most important factor when analyzing margin-driven growth. One-time cost-cutting measures provide a temporary boost but do not drive long-term compounding. True value comes from structural advantages that allow a company to maintain or grow its margins even as it scales.
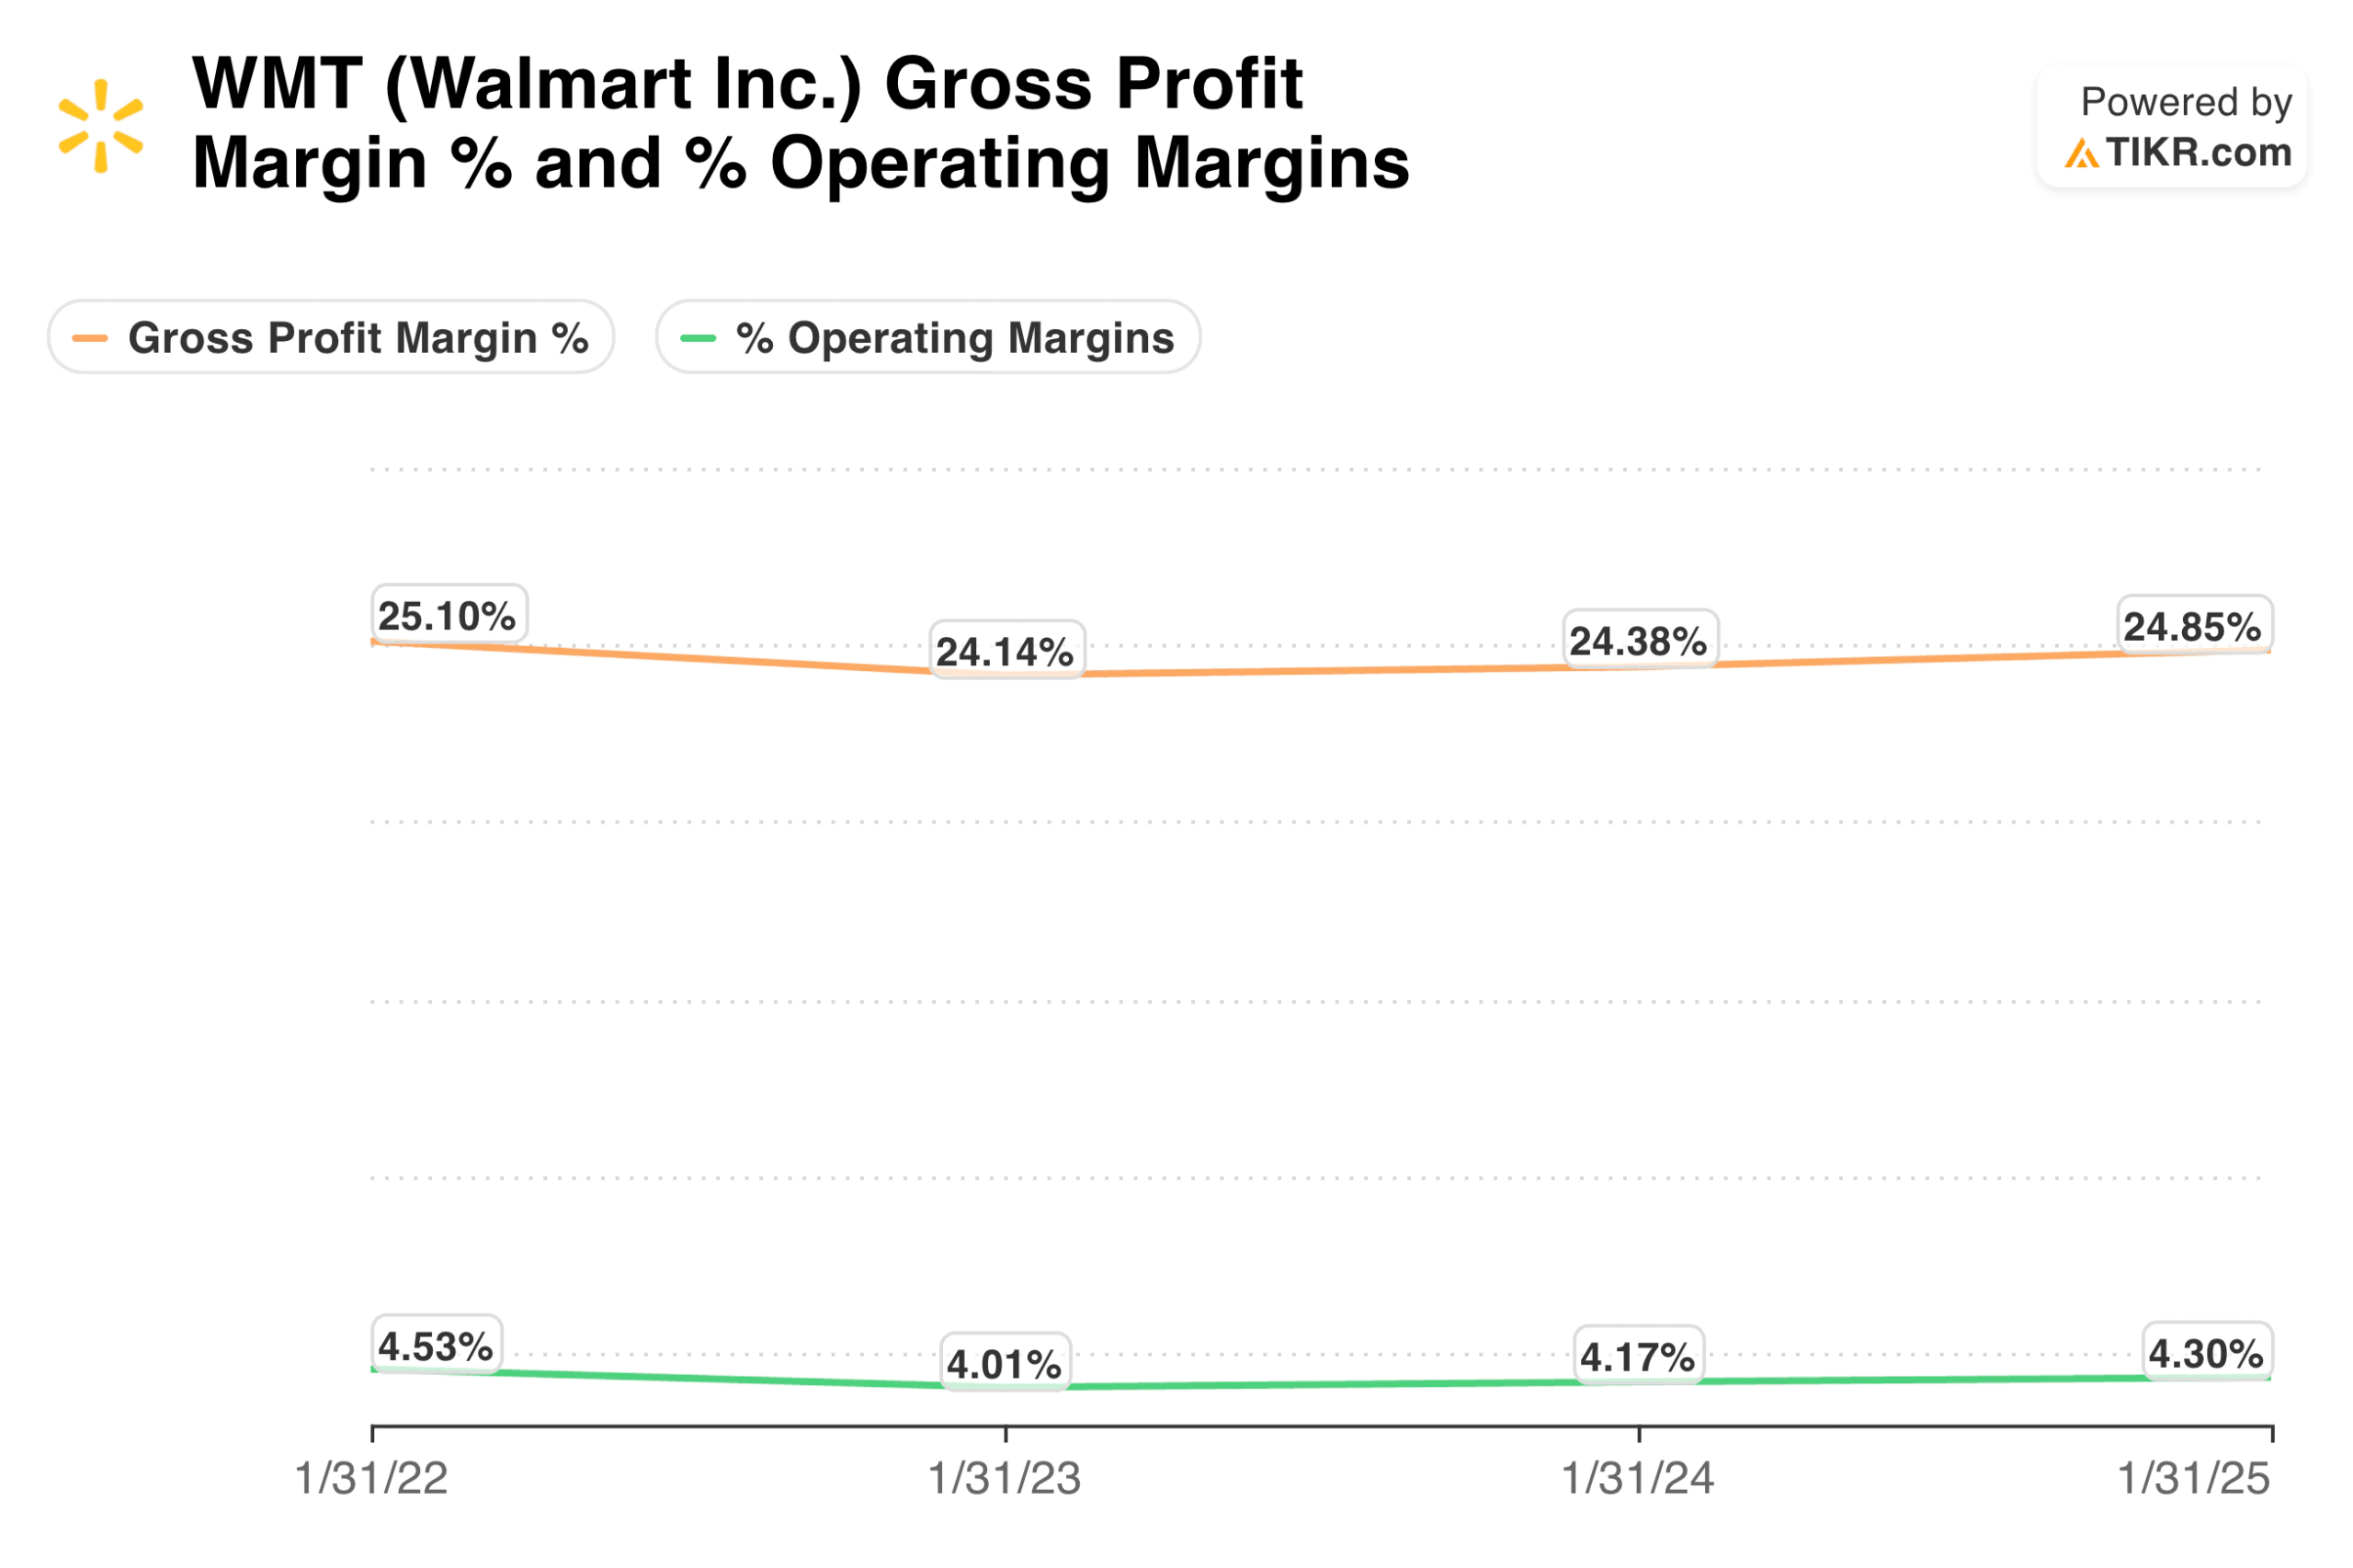
TIKR Tip: Use the Ratios section in TIKR to compare current Gross and Operating margins with historical averages to assess whether the market is assuming record-breaking efficiency.
Track company margin information with TIKR (It’s free) >>>
The TIKR Takeaway
Reverse-engineering a stock’s implied growth rate is the best way to determine whether a stock is a sound investment or a valuation risk. By working backward from the price, you move away from speculative forecasts and toward a cold assessment of market assumptions. This process ensures you only buy when market expectations are below the business’s ability to deliver.
The discipline of this approach protects you from the hype of high-growth narratives. When you know exactly what the market expects, you can make an informed decision about the probability of an outcome. TIKR provides the historical data and analyst estimates needed to perform this check on any global stock.
Find undervalued stocks in less than 60 seconds with TIKR’s new Valuation Model (It’s free) >>>
Value Any Stock in Under 60 Seconds with TIKR
With TIKR’s new Valuation Model tool, you can estimate a stock’s potential share price in under a minute.
All it takes is three simple inputs:
- Revenue Growth
- Operating Margins
- Exit P/E Multiple
If you’re not sure what to enter, TIKR automatically fills in each input using analysts’ consensus estimates, giving you a quick, reliable starting point.
From there, TIKR calculates the potential share price and total returns under Bull, Base, and Bear scenarios so you can quickly see whether a stock looks undervalued or overvalued.
See a stock’s true value in under 60 seconds (Free with TIKR) >>>
Looking for New Opportunities?
- Discover which stocks billionaire investors are purchasing, so you can follow the smart money.
- Analyze stocks in as little as 5 minutes with TIKR’s all-in-one, easy-to-use platform.
- The more rocks you overturn… the more opportunities you’ll uncover. Search 100K+ global stocks, global top investor holdings, and more with TIKR.
Disclaimer:
Please note that the articles on TIKR are not intended to serve as investment or financial advice from TIKR or our content team, nor are they recommendations to buy or sell any stocks. We create our content based on TIKR Terminal’s investment data and analysts’ estimates. Our analysis might not include recent company news or important updates. TIKR has no position in any stocks mentioned. Thank you for reading, and happy investing!