Key Takeaways:
- Data Center Inflection: Arm Holdings’ data center revenue has already crossed into the teens as a percentage of total sales, and management expects it to reach parity with the smartphone segment, currently 40–45% of total revenue, within 2–3 years, representing a structural expansion worth billions in incremental royalties at structurally higher rates.
- Memory Headwind Overblown: Arm Holdings’ own CFO quantified a 20% decline in smartphone unit volumes as a worst-case 2% hit to smartphone royalties and only 1–2% to total royalties, yet the stock dropped 8% on February 4, 2026 after Q3 FY26 earnings — a reaction the company’s own $1.47B Q4 guidance, already above the $1.44B Street estimate, directly contradicts.
- Price Target: Arm Holdings stock could reach $203 by March 31, 2028, based on a 21% revenue CAGR applied to the LTM revenue base of $4.67B, a 46% operating margin assumption, and a 64x P/E multiple reflecting the company’s royalty-model durability and AI infrastructure positioning.
- Total Upside: At a current price of $125, the $203 target represents 62% total upside over approximately 2 years, equivalent to an annualized return of 26%, grounded in a business compounding at 20%+ with 97% gross margins and an irreplaceable role across every AI-capable compute platform on earth.
Breaking Down the Case for Arm Holdings
Arm Holdings (ARM) delivered its best quarterly performance in company history during Q3 FY2026, reporting total revenue of $1.24B, up 26% year-over-year, with royalties alone growing 27% to $737M and beating the $708M consensus by nearly $30M.
The quarter was not without friction, as licensing revenue of $505M fell short of the $520M estimate, contributing to a post-earnings selloff that pushed ARM shares down 8% in after-hours trading on February 4, 2026, and an additional 3% the following session.
Revenue has compounded at 24% annually over the last year, gross margins stand at a near-pristine 97%, and the LTM revenue base has reached $4.67B, yet the GAAP operating picture has historically been distorted by $2.62B in LTM R&D spend that management frames explicitly as investment in next-generation architectures, compute subsystems, and chiplet exploration.
“The strength of customer demand we are seeing today, combined with a growing base of long-duration contracts at structurally higher royalty rates, provides increasing confidence in our future revenue profile,” said CFO Jason Child on the February 4, 2026 earnings call.
SoftBank, now embedded as a $200M-per-quarter licensing customer following its AI compute buildout through acquisitions of Ampere and Graphcore, has become a structural revenue anchor, with CEO Rene Haas confirming that SoftBank’s Masayoshi Son has no intention of selling a single share of ARM stock.
Last January, Susquehanna upgraded ARM to “Positive,” citing undisclosed initiatives it believes will “dramatically” expand Arm’s total addressable market, and with 23 of 40 brokerages already at Buy or higher and a median price target of $165, institutional conviction on March 24 product event is quietly building.
Now, the central question for investors is whether the market’s post-earnings fixation on a 1–2% royalty headwind from memory shortages is obscuring a data center revenue line growing at a pace that, in the CFO’s own words, “more than compensates” for all mobile-side risks — with v9 CSS royalty rates escalating contractually each device cycle and premium smartphone demand structurally insulated.
At 64x forward earnings and a current price of $125, ARM trades at a meaningful discount to its 1-year trailing P/E of 72x, yet management has reaffirmed 20%+ growth through FY27 and declined to pull back on FY28, leaving the tension between short-term memory noise and a multi-year royalty compounding story entirely unresolved for the market to price.
What the Model Says for ARM Stock
Arm Holdings grew revenue 23.9% last year, and the post-earnings selloff in early February pushed the stock down 8% despite Q3 royalties beating estimates by nearly $30M, creating a gap between price and actual business performance.
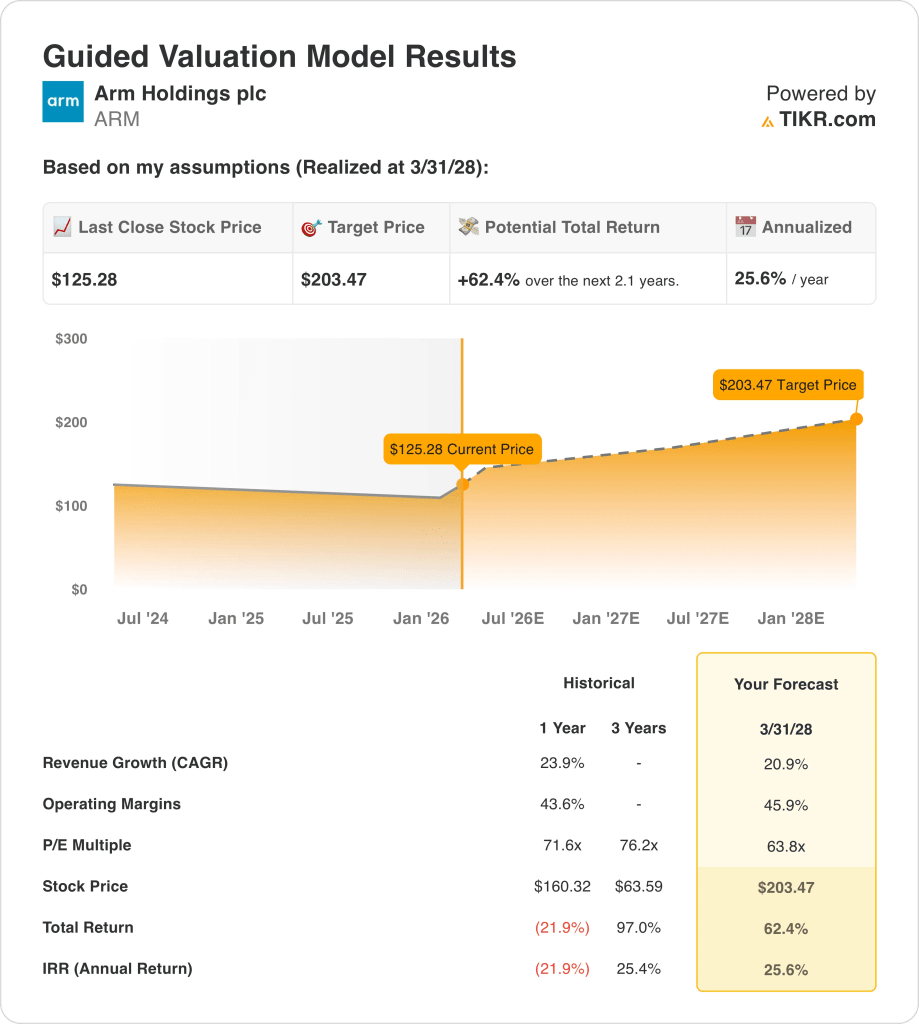
The model assumes 20.9% revenue growth and 45.9% operating margins by March 2028, both reasonable given last year’s 23.9% growth and 43.6% margins, and applies a 63.8x P/E exit, slightly below the current forward P/E of 63.84x, arriving at a $203.47 target price.
That target represents a 62.4% total return from $125.28, or 25.6% per year, more than double the standard 10% annual return investors typically expect from equities.
The model’s assumptions are not aggressive relative to recent history, the exit P/E is actually lower than where the stock trades today, the margin assumption is an improvement of only 2 percentage points over last year, and the growth assumption is a modest step down from the 23.9% the company just posted.
The model signals a Buy.
The model’s 25.6% annualized return far exceeds the 10% equity hurdle rate, with conservative assumptions relative to recent performance, justifying capital appreciation rather than mere capital preservation at current prices.
Our Valuation Assumptions
TIKR’s Valuation Model lets you plug in your own assumptions for a company’s revenue growth, operating margins, and P/E multiple, and calculates the stock’s expected returns.
Here’s what we used for Arm Holdings stock:
1. Revenue Growth: 20.9%
Arm Holdings stock posted 23.9% revenue growth last fiscal year, reaching $4.01B, as royalty revenue from premium smartphones and early data center adoption came in stronger than expected.
Last February’s Q3 FY2026 results showed royalties up 27% year-over-year to $737M, beating estimates by $30M, while the company guided Q4 revenue at $1.47B, already above the $1.44B Street estimate.
The model’s 20.9% growth assumption sits modestly below last year’s 23.9% pace, pricing in the memory-driven smartphone headwind that management itself quantified at only 1% to 2% of total royalties, while data center revenue continues to outpace expectations.
The real execution risk is concentration: SoftBank alone contributes $200M per quarter in licensing revenue, and any delay in its AI buildout road map would remove a structural pillar of the licensing line without an immediate replacement.
This sits below the 1-year revenue growth of 23.9%, as the model prices in modest deceleration from memory-related smartphone pressure, and any simultaneous softness in data center ramp would pull actual growth further below the assumption than the model currently prices.
2. Operating Margins: 45.9%
ARM stock’s EBIT margin averaged 46.7% over the past year, and the non-GAAP operating margin for Q3 FY2026 already came in at 41%, both pointing to a business where the underlying margin structure is already close to the model’s assumption.
R&D expenses grew 37% year-over-year in Q3 FY2026 to $716M for the quarter alone, and management guided another low double-digit sequential step-up into Q1 FY2027 before expecting that pace to moderate through the rest of the year.
The 45.9% assumption requires R&D growth to slow meaningfully relative to revenue, which is plausible as CSS designs move into royalty-generating silicon and development costs get distributed across a larger revenue base.
If R&D spend does not moderate as expected, or if the March 24, 2026 product announcement requires material new engineering investment, the margin path to 45.9% breaks and the target price falls with it.
This sits below the 1-year EBIT margin of 46.7%, as ongoing R&D acceleration keeps near-term costs elevated, and sustained margin above 45% through FY2028 requires that revenue scales faster than engineering headcount additions.
3. Exit P/E Multiple: 63.8x
The exit P/E of 63.8x capitalizes the model’s terminal earnings under the assumption that ARM stock, by March 2028, is a business with durable royalty growth, expanding data center exposure, and contractually locked-in rate escalation across its CSS customer base.
The model already assumes 45.9% operating margins and 20.9% revenue growth by FY2028, so the 63.8x multiple is not adding a second layer of optimism on top of generous inputs; it is treating those inputs as fully earned and pricing the exit accordingly.
The current market assumption for ARM’s forward P/E as of February 13, 2026 stands at 63.84x, meaning the model’s exit multiple of 63.8x is nearly identical to where the market prices the stock today, and the model is not assuming any re-rating whatsoever.
Applying today’s market P/E assumption to FY2028 earnings is a disciplined choice: the stock gets to $203.47 purely through earnings growth, not through investors paying more per dollar of earnings than they do right now.
This sits below the 1-year historical P/E of 71.6x, as the model deliberately avoids assuming any sentiment recovery from the stock’s 21.9% decline over the past year, and reaching $203.47 requires only that earnings grow as modeled while the market continues pricing ARM at today’s multiple.
What Happens If Things Go Better or Worse?
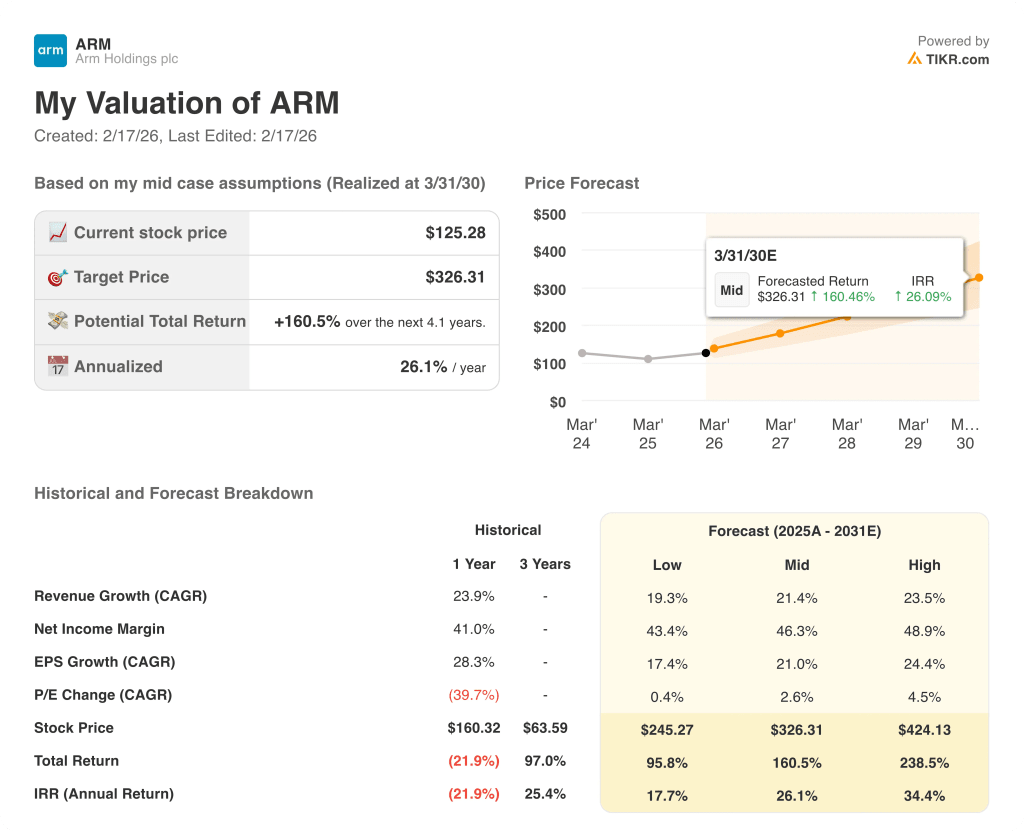
Arm Holdings stock scenarios through March 2030 turn on royalty rate escalation, data center revenue mix, and whether R&D spend moderates enough to let earnings grow faster than costs.
- Low Case: If smartphone volumes stay pressured and data center ramp slows, revenue grows around 19.3% and net income margins hold near 43.4%, returning 17.7% annualized.
- Mid Case: With v9 CSS adoption broadening and SoftBank’s $200M quarterly licensing run rate holding, revenue grows near 21.4% and margins reach 46.3%, returning 26.1% annualized.
- High Case: If the March 24 product event unlocks meaningful new licensing revenue and data center share approaches smartphone-level contribution ahead of schedule, revenue reaches 23.5% and margins approach 48.9%, returning 34.4% annualized.
How Much Upside Does Arm Holdings Stock Have From Here?
With TIKR’s new Valuation Model tool, you can estimate a stock’s potential share price in under a minute.
All it takes is three simple inputs:
- Revenue Growth
- Operating Margins
- Exit P/E multiple
If you’re not sure what to enter, TIKR automatically fills in each input using analysts’ consensus estimates, giving you a quick, reliable starting point.
From there, TIKR calculates the potential share price and total returns under Bull, Base, and Bear scenarios so you can quickly see whether a stock looks undervalued or overvalued.
Looking for New Opportunities?
- See what stocks billionaire investors are buying so you can follow the smart money.
- Analyze stocks in as little as 5 minutes with TIKR’s all-in-one, easy-to-use platform.
- The more rocks you overturn… the more opportunities you’ll uncover. Search 100K+ global stocks, global top investor holdings, and more with TIKR.
Disclaimer:
Please note that the articles on TIKR are not intended to serve as investment or financial advice from TIKR or our content team, nor are they recommendations to buy or sell any stocks. We create our content based on TIKR Terminal’s investment data and analysts’ estimates. Our analysis might not include recent company news or important updates. TIKR has no position in any stocks mentioned. Thank you for reading, and happy investing!