Return on invested capital measures how effectively a company converts capital into profits. A business earning 20% ROIC generates twenty cents of operating profit for every dollar invested. One earning 8% generates only eight cents. This difference compounds dramatically over time. The high-ROIC company can reinvest profits at attractive rates and grow intrinsic value rapidly. The low-ROIC company struggles to create value regardless of how much it invests.
Yet many investors calculate ROIC incorrectly or rely on figures that distort the true picture. Different data sources use different formulas, producing ROIC numbers that vary by several percentage points for the same company. Some calculations include cash that inflates the capital base. Others use operating income without tax adjustments. These errors lead to flawed comparisons and mistaken conclusions about business quality.
Measuring ROIC properly requires understanding what the metric captures, applying a consistent formula, making appropriate adjustments, and interpreting results in context. A company with a 15% ROIC may be excellent or mediocre, depending on its industry, capital intensity, and cost of capital. The number alone means nothing without a framework for interpretation.
Understand What ROIC Actually Measures
ROIC answers a simple question: how much operating profit does the company generate relative to the capital required to run the business? This ratio reveals the fundamental economics of converting investment into returns. High ROIC indicates a business that requires relatively little capital to generate substantial profits. A low ROIC indicates that capital is tied up for modest returns.
The metric matters because it determines the value growth it creates. A company reinvesting profits at 25% ROIC builds value quickly with each dollar retained. One reinvesting at 6% ROIC barely exceeds the cost of capital and creates minimal value regardless of growth rate. Two companies with identical earnings growth will produce vastly different shareholder returns if their reinvestment rates differ significantly.
ROIC also reveals a competitive advantage. Businesses with durable moats typically earn returns well above their cost of capital for extended periods. Those without advantages see returns compressed toward the cost of capital over time. Sustained high ROIC signals something special about the business. Declining ROIC signals eroding competitive position.
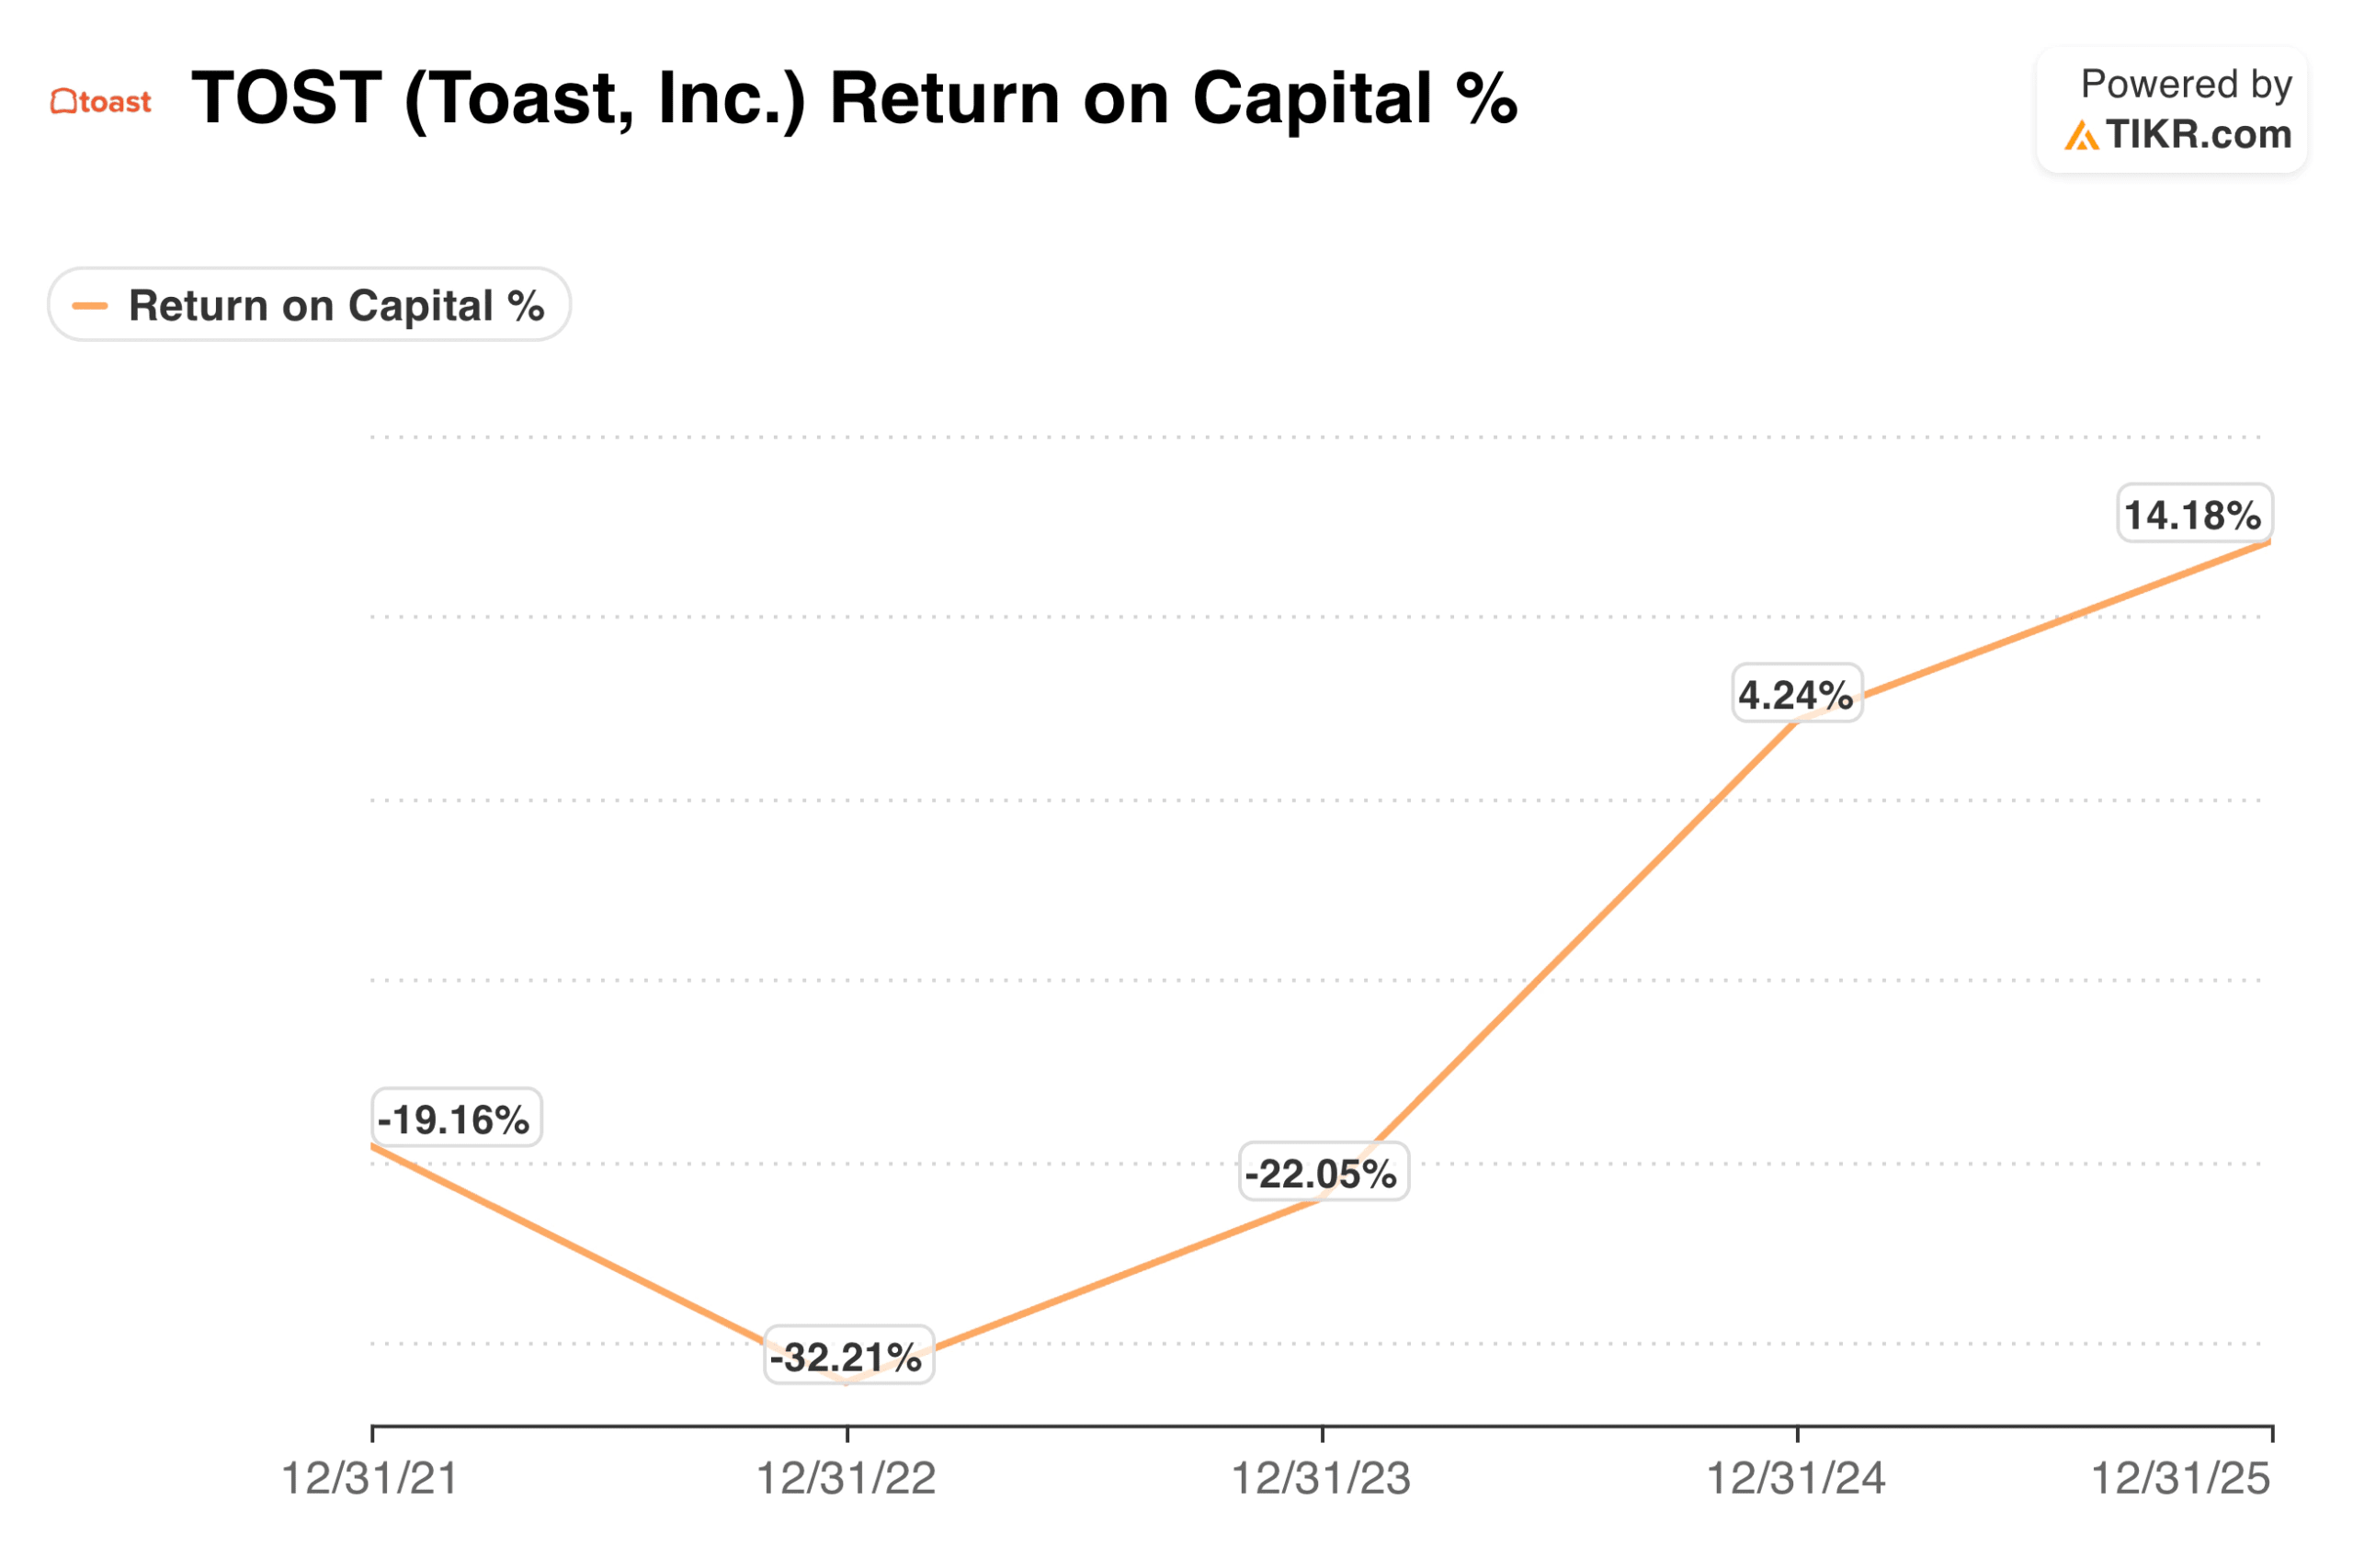
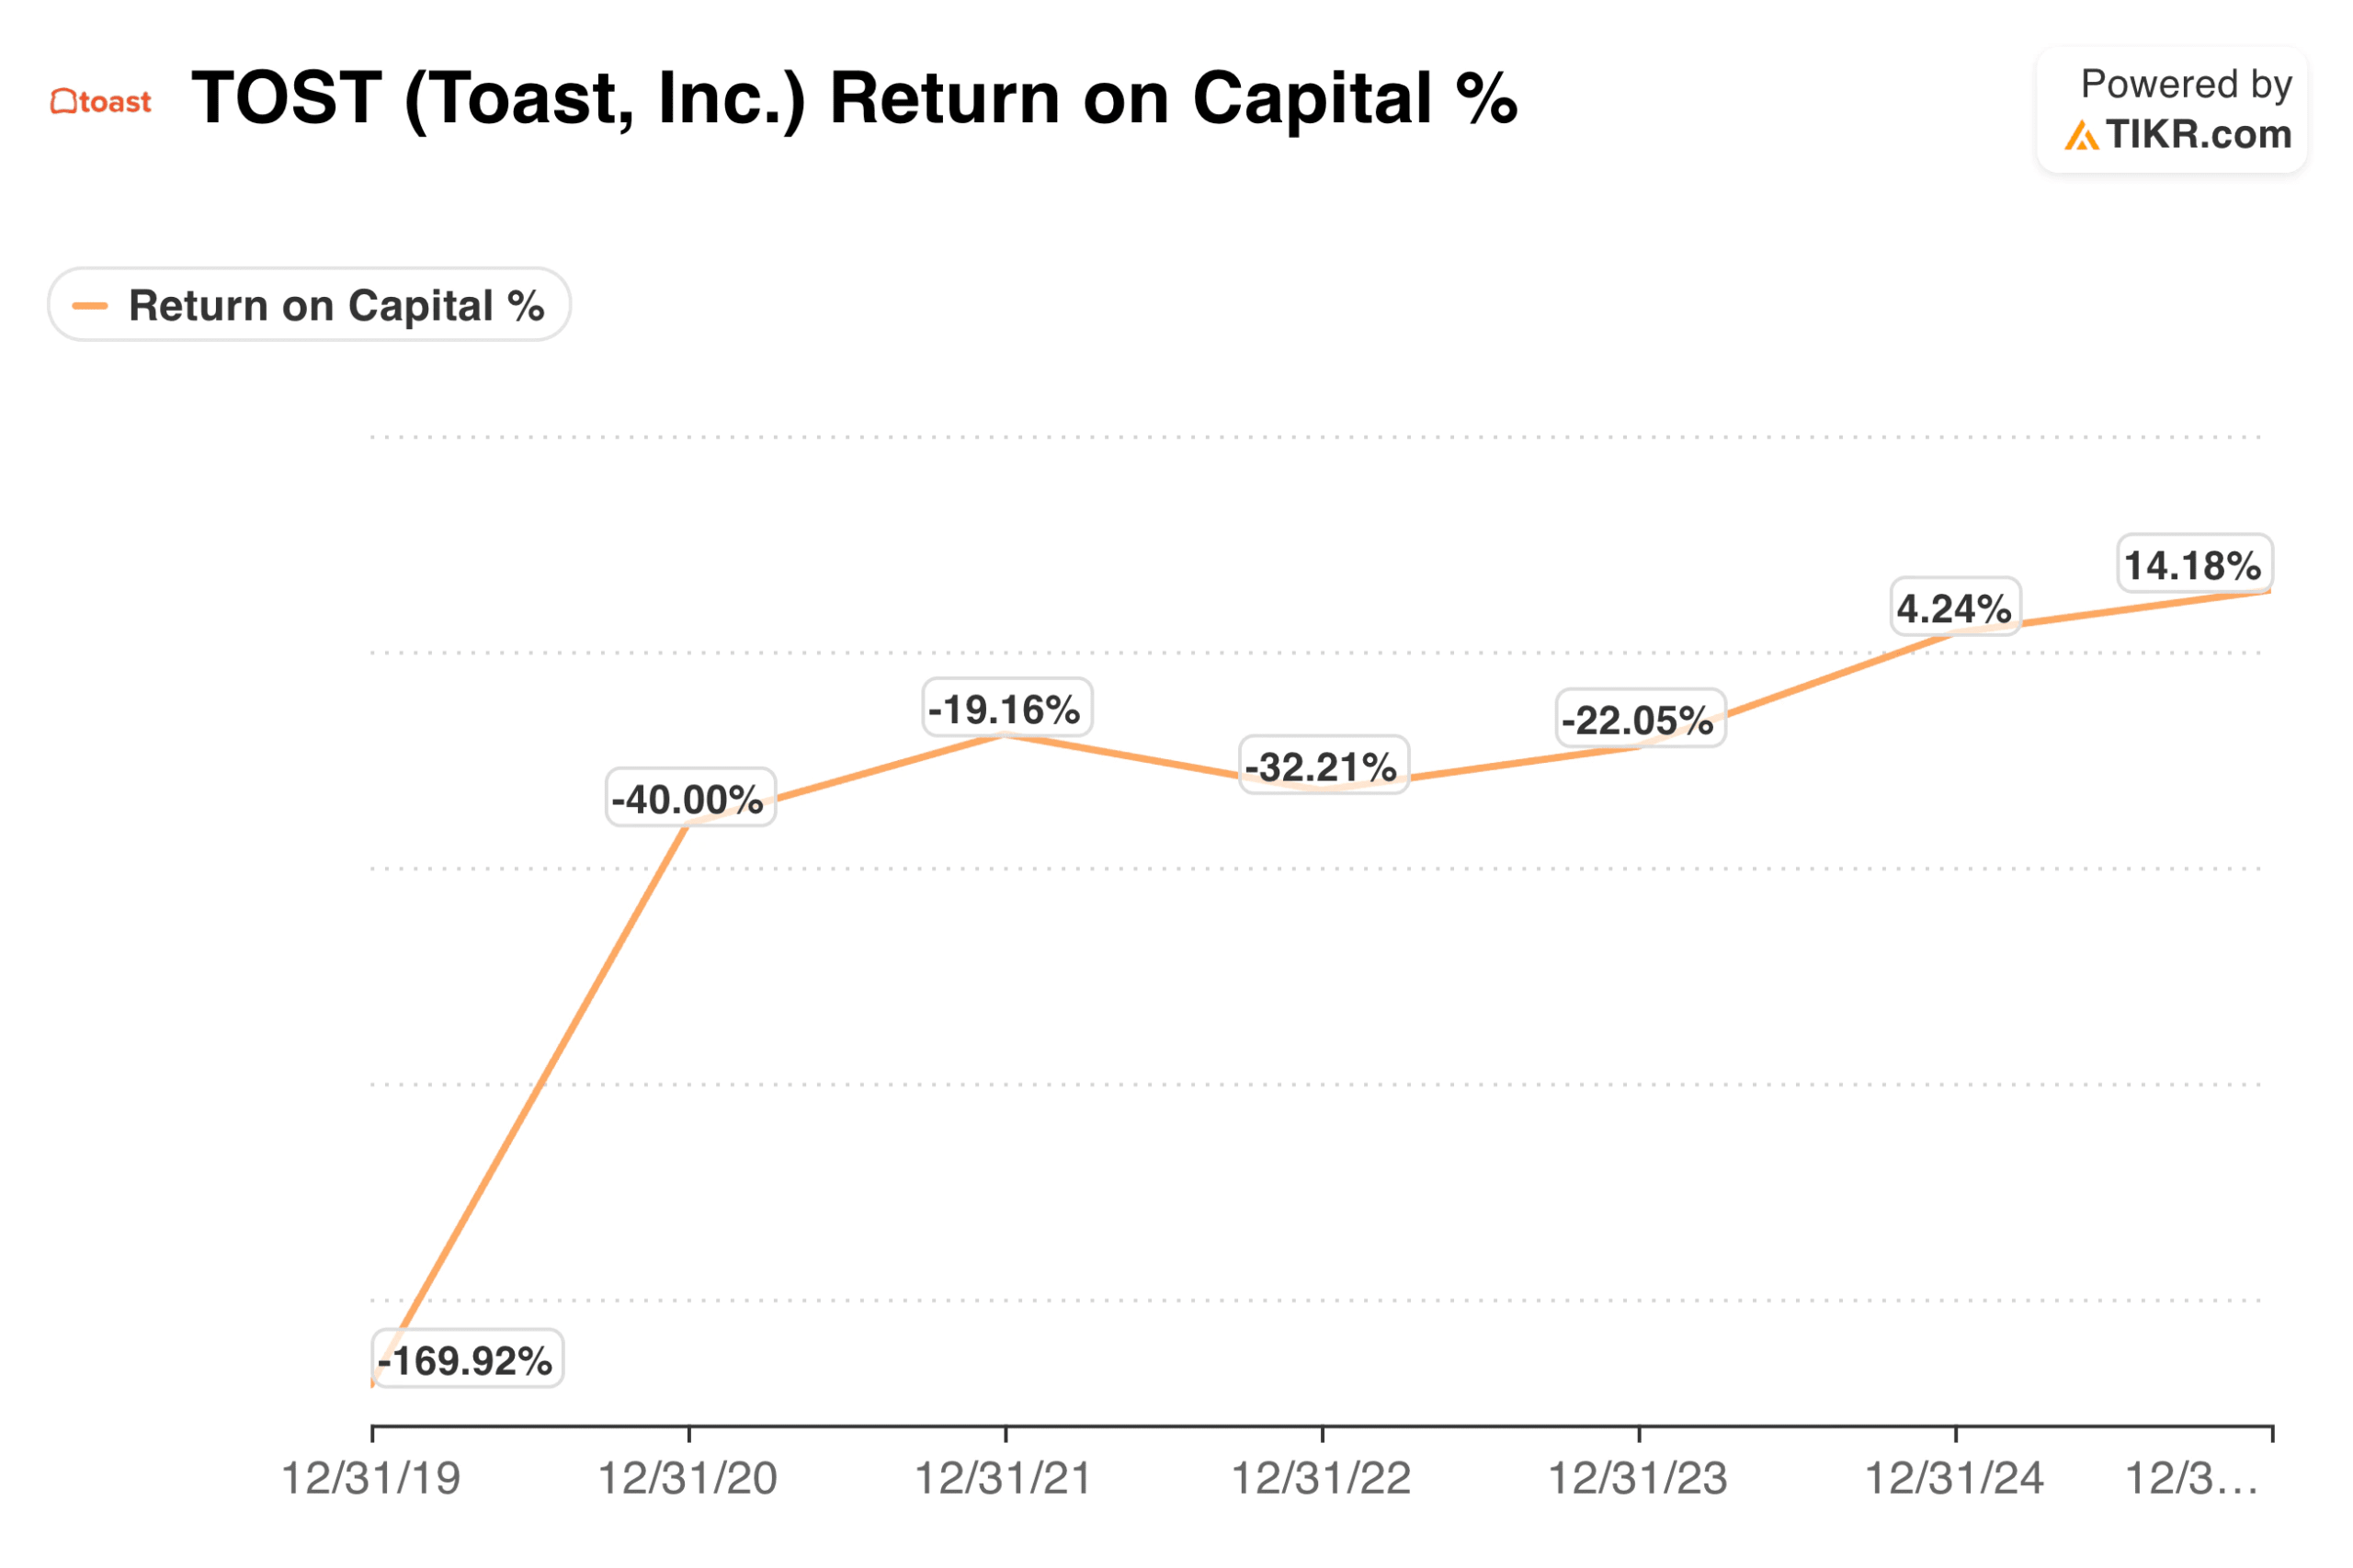
TIKR tip: TIKR displays ROC (Return on Capital) in the Ratios section under Detailed Financials. While calculation methods vary slightly across platforms, ROC serves the same analytical purpose as ROIC by measuring profit generation relative to capital employed. You can see how companies like Toast (TOST) have performed over different years.
Review return on capital history for thousands of stocks in under 60 seconds (Free with TIKR) >>>
Apply the Correct Formula
ROIC consists of two components: net operating profit after taxes (NOPAT) in the numerator and invested capital in the denominator. Getting both right produces a meaningful figure. Getting either wrong distorts the result.
Calculate NOPAT by starting with operating income and adjusting for taxes. The formula is Operating Income multiplied by (1 minus the tax rate). This represents the profit available to all capital providers before interest payments. Using operating income rather than net income removes the effects of capital structure, allowing comparison across companies with different debt levels. A company with heavy debt and one with no debt can have identical ROIC despite very different net income figures.
Calculate invested capital by summing the funding sources that finance operations. The simplest approach adds total debt to total equity and subtracts excess cash. Alternatively, sum operating assets minus non-interest-bearing operating liabilities. Both methods should produce similar results. The key is to capture the capital actually deployed in the business rather than leaving it idle. Excess cash earns minimal returns and inflates the denominator if included, depressing the calculated ROIC below the true operating return.
Use average invested capital over the period rather than ending capital for a more accurate picture. If invested capital grew significantly during the year, ending capital overstates the base used to generate the year’s profits. Averaging the beginning and ending capital better matches the numerator and denominator.
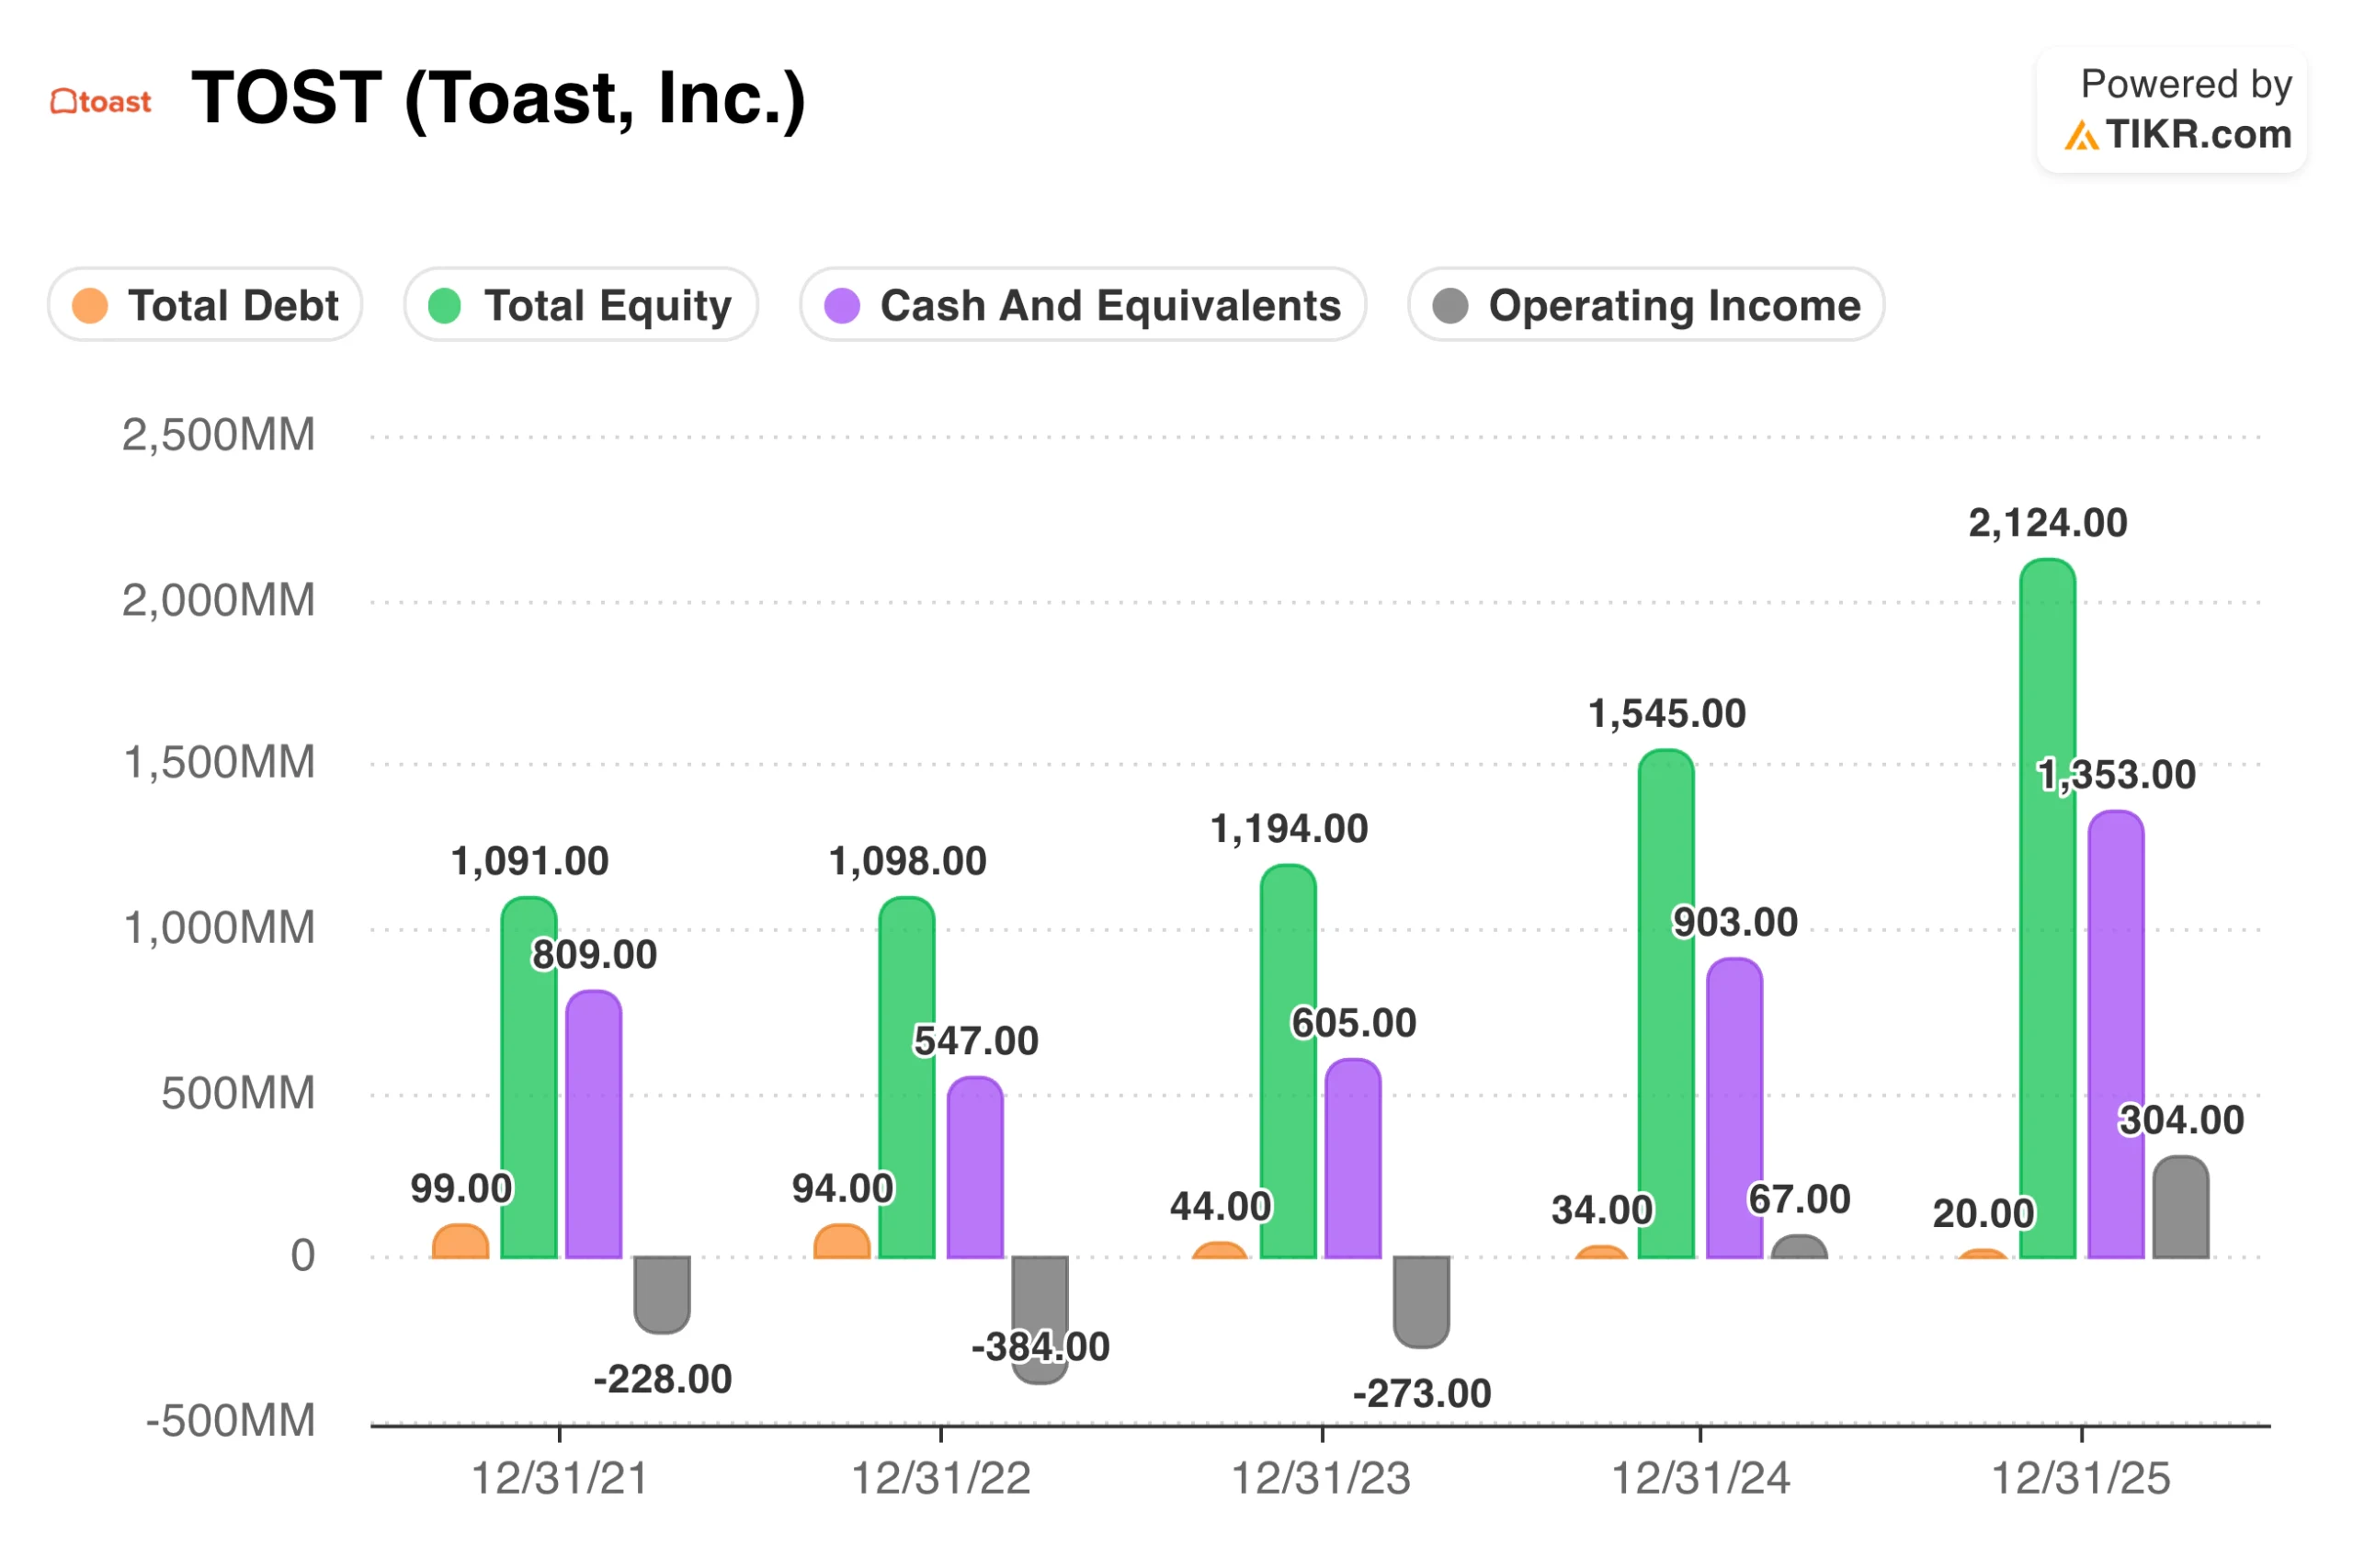
TIKR tip: Find operating income on TIKR’s Income Statement and total debt, total equity, and cash on the Balance Sheet. These inputs enable you to manually calculate ROIC when precision is required or to verify published figures.
Review complete financials for any stock in less than 60 seconds (It’s free) >>>
Avoid Common Calculation Mistakes
Several errors frequently distort ROIC calculations. Recognizing these pitfalls helps you produce accurate figures and identify when published numbers may mislead.
Including excess cash in invested capital is the most common mistake. A company holding $5 billion in cash beyond operational needs shows lower ROIC if that cash sits in the denominator. The cash earns treasury rates, not operating returns, and including it penalizes conservative balance sheets. Subtract cash that exceeds reasonable working capital needs, typically estimated as a small percentage of revenue, to isolate capital actually deployed in operations.
Using net income instead of NOPAT distorts comparisons across capital structures. Net income reflects interest expense, which depends on the amount of debt a company carries rather than on how well it operates. Two identical businesses with different financing choices show different net income, but should show identical ROIC. Using operating income adjusted for taxes removes this distortion.
Ignoring operating leases understates invested capital for companies that lease rather than own assets. A retailer leasing all its stores shows lower invested capital than one owning them, even if their economic footprints are identical. Accounting standards now capitalize most leases, but older data or certain lease structures may still require adjustment. Add the present value of operating lease commitments to invested capital for an accurate comparison.
Goodwill treatment affects comparisons between acquirers and organic growers. A company that grew through acquisitions carries goodwill that inflates invested capital and depresses ROIC. One that grew organically shows no goodwill for internally developed advantages. Some analysts exclude goodwill to compare operating returns. Others include it to capture the true cost of building the business. Choose a consistent approach and understand how it affects interpretation.
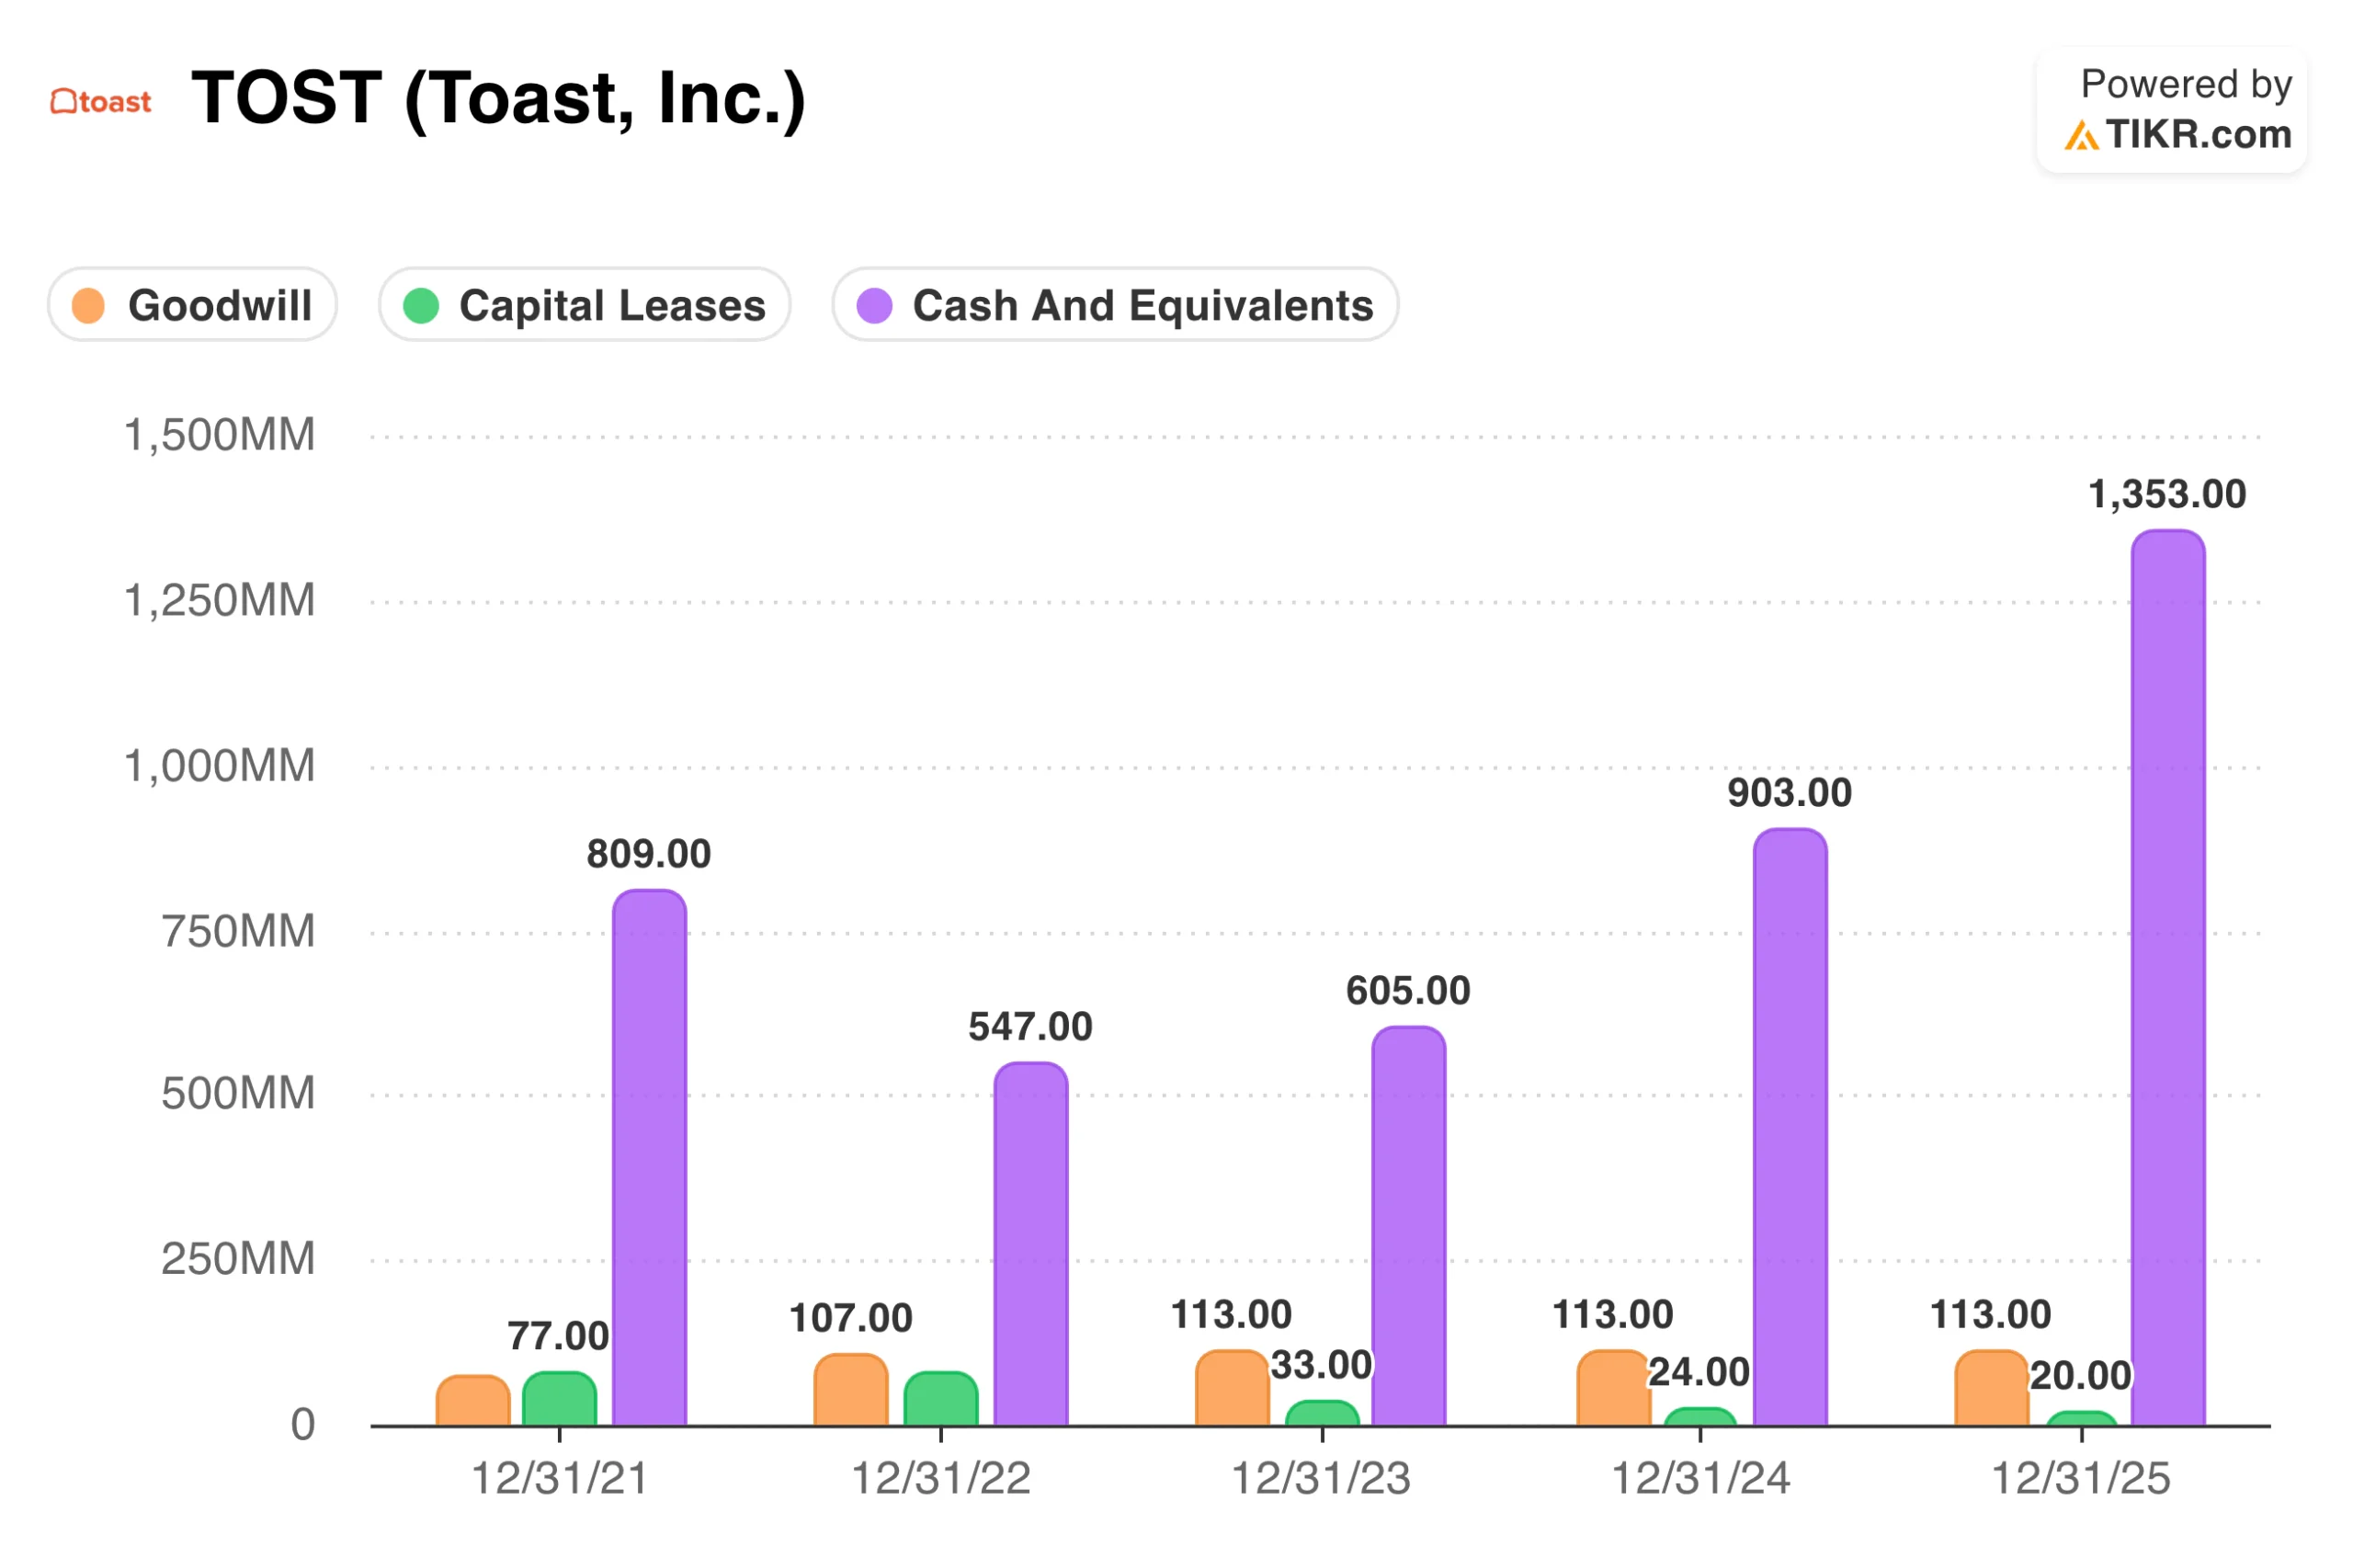
TIKR tip: Review the Balance Sheet in TIKR’s Detailed Financials for goodwill, lease liabilities, and cash levels. Understanding these components helps you assess whether published ROC figures capture the economics you care about.
Build your own screener to find stocks with solid return on capital (Free with TIKR) >>>
Interpret ROIC In Context
A raw ROIC number requires context to be meaningful. What counts as good ROIC depends on the industry, the company’s cost of capital, and how returns have trended over time.
Compare ROIC to the weighted average cost of capital (WACC). A company earning ROIC above its WACC creates economic value with each dollar invested. Earnings below WACC destroy value, even if accounting profits appear positive. Most companies have a cost of capital between 7% and 12%, so ROIC consistently above 15% typically indicates genuine value creation. ROIC below 10% raises questions about whether the business earns adequate returns.
Examine industry norms before judging absolute levels. Asset-light software businesses routinely earn ROICs of 25%+ because they require minimal capital. Capital-intensive utilities and manufacturers often earn 8-12% because their business models require significant capital investment. A utility earning 10% ROIC may be well-managed, while a software company earning the same return may face serious problems. Compare to direct competitors rather than the market overall.
Track ROIC trajectory over multiple years. Stable or rising ROIC indicates a maintained or strengthening competitive position. Declining ROIC signals eroding advantages even if the current level remains respectable. A company whose ROIC has fallen from 22% to 14% over five years is becoming a worse business, regardless of what the income statement shows.
TIKR tip: Review ROC over five to ten years in TIKR’s Ratios section to identify the trajectory. Stable high returns signal durable competitive advantages. Declining returns warrant an investigation into what is changing.
Look for improving returns on capital on TIKR for the top stocks in your portfolio (It’s free) >>>
The TIKR Takeaway
Measuring ROIC properly requires calculating NOPAT by adjusting operating income for taxes, determining invested capital by summing debt and equity while excluding excess cash, and comparing the two consistently over time. The formula matters because small changes in methodology produce meaningfully different results.
The interpretation matters as much as the calculation. ROIC above the cost of capital creates value. ROIC below the cost of capital destroys it. Industry context determines what constitutes a good return. Trajectory reveals whether competitive advantages are holding or eroding.
TIKR displays ROC in the Ratios section, providing a starting point for assessing returns on capital across companies. Historical data reveals whether high returns persist or are fading. Balance sheet details provide inputs for manual calculations when greater precision is needed. Together, these tools help you identify businesses that truly convert capital into profits efficiently versus those that merely appear to.
Find undervalued stocks in less than 60 seconds with TIKR’s new Valuation Model (It’s free) >>>
Value Any Stock in Under 60 Seconds with TIKR
With TIKR’s new Valuation Model tool, you can estimate a stock’s potential share price in under a minute.
All it takes is three simple inputs:
- Revenue Growth
- Operating Margins
- Exit P/E Multiple
If you’re not sure what to enter, TIKR automatically fills in each input using analysts’ consensus estimates, giving you a quick, reliable starting point.
From there, TIKR calculates the potential share price and total returns under Bull, Base, and Bear scenarios so you can quickly see whether a stock looks undervalued or overvalued.
See a stock’s true value in under 60 seconds (Free with TIKR) >>>
Looking for New Opportunities?
- Discover which stocks billionaire investors are purchasing, so you can follow the smart money.
- Analyze stocks in as little as 5 minutes with TIKR’s all-in-one, easy-to-use platform.
- The more rocks you overturn… the more opportunities you’ll uncover. Search 100K+ global stocks, global top investor holdings, and more with TIKR.
Disclaimer:
Please note that the articles on TIKR are not intended to serve as investment or financial advice from TIKR or our content team, nor are they recommendations to buy or sell any stocks. We create our content based on TIKR Terminal’s investment data and analysts’ estimates. Our analysis might not include recent company news or important updates. TIKR has no position in any stocks mentioned. Thank you for reading, and happy investing!