
Key Stats for Paramount Skydance Stock
- Current Price: $11.09
- Target Price (Mid): ~$14
- Street Target: ~$13
- Potential Total Return: ~23%
- Annualized IRR: ~5% / year
- Earnings Reaction: +10.04% (Q4 2025, reported 2/26/26)
- Max Drawdown: 55.45% on 3/27/26
Now Live: Discover how much upside your favorite stocks could have using TIKR’s new Valuation Model (It’s free) >>>
What Happened?
Wall Street spent most of 2026 selling Paramount Skydance (PSKY). On May 1, Morgan Stanley broke ranks in a big way.
Morgan Stanley upgraded PSKY from Underweight to Overweight and raised its price target to $14 from $11, calling the proposed Warner Bros. Discovery acquisition a “big, bold, and game-changing move” and pointing to confidence in the $6 billion synergy target and a clear path to de-levering. Analyst Sean Diffley called it Morgan Stanley’s “riskiest and most out-of-consensus call” and the stock jumped 8%, snapping a six-day losing streak.
The pessimism had real backing. PSKY sits 55.45% below its peak as of March 27 and is still down roughly 17% in 2026, pressured by antitrust uncertainty after the DOJ opened a review of the $110 billion WBD deal. Going into the upgrade, 19 of 20 analyst firms had PSKY at Hold or worse. The central debate: is this a broken media company layering on unsustainable debt, or a discounted entry into a deal the market is mispricing?
Q1 2026 earnings arrive Monday, May 4, and will be the first test of whether Paramount’s standalone business is building momentum before it absorbs Warner Bros. Discovery.
Why Morgan Stanley Flipped
The upgrade is built around the transaction, not the quarter.
In late February, Paramount and Warner Bros. Discovery signed a definitive merger agreement under which Paramount will acquire WBD for $31.00 per share in cash, valuing the deal at $81 billion in equity and $110 billion in enterprise value, with Q3 2026 targeted for close. WBD stockholders voted overwhelmingly to approve the merger at a Special Meeting on April 23, removing a major non-regulatory hurdle.
On the March 2 M&A call, CFO Dennis Cinelli put specific financial targets on the combined company: $69 billion in estimated 2026 pro forma revenue, $18 billion in estimated 2026 EBITDA inclusive of the full $6 billion-plus in expected synergies, and over $10 billion in annual free cash flow by 2030 at approximately 50% conversion. Management also targets mid-20% EBITDA margins by 2030. Those targets are the financial architecture Diffley is pricing in.
CEO David Ellison framed the strategic logic directly on that call: “This is not about consolidation. It’s about reinventing the business.” The combined DTC platform would hold over 200 million subscribers at close, which Ellison described as “roughly the size of Disney.” The combined sports portfolio, covering the NFL, Olympics, UFC, PGA Tour, all of March Madness, and Champions League, adds advertising leverage that no standalone media player outside Netflix can match.
Diffley also flagged three underappreciated elements to the merger: the potential for AI to unlock cost savings and increase ad revenue, confidence in achieving the $6 billion in synergies, and a clear mix shift toward faster-growing streaming and studio assets.
See historical and forward estimates for Paramount Skydance stock (It’s free!) >>>
The Synergy Case and the Debt Reality
Chief Strategy and Operating Officer Andy Gordon confirmed on the March 2 call that the majority of the $6 billion in synergies comes from non-labor sources and includes no reduction in production capacity. The primary drivers are consolidating the Paramount+ and HBO Max technology stacks, global procurement efficiencies, real estate rationalization, and migrating to a single enterprise resource planning system. The studio output commitment stays intact: at least 30 theatrical films per year, with a minimum 45-day window before PVOD release.
The debt is the legitimate bear case. The pro forma entity will carry approximately $79 billion in net debt at close at 4.3x synergized EV/EBITDA. Management targets a 3x ratio within three years. On a standalone basis today, TIKR shows PSKY at $11.82 billion in LTM net debt at 4.41x LTM net debt/EBITDA. Stacking $79 billion at close is a structural bet that combined free cash flow outpaces debt service. Cinelli’s $10 billion-plus annual FCF target by 2030 is the proof point the market is waiting on.
On valuation, PSKY trades at 7.09x NTM EV/EBITDA per TIKR, below the media peer group mean of 8.93x. Fox Corporation trades at 8.47x and Nexstar Media Group at 6.29x. That discount reflects deal and leverage risk, not a fundamental business discount. If the merger closes and de-levering begins, multiple re-rating is where much of the upside lives.

See how Paramount Skydance performs against its peers in TIKR (It’s free!) >>>
TIKR Advanced Model Analysis
- Current Price: $11.09
- Target Price (Mid): ~$14
- Potential Total Return: ~23%
- Annualized IRR: ~5% / year

See analysts’ growth forecasts and price targets for Paramount Skydance stock (It’s free!) >>>
The TIKR mid-case targets approximately $14 by 12/31/30, implying approximately 23% total return and approximately 5% annualized IRR. This model reflects PSKY’s standalone business, making it conservative relative to what a closed WBD deal could unlock.
The two revenue CAGR drivers in the mid-case are DTC subscribers and revenue growth, and Filmed Entertainment licensing from PSKY’s 15-plus film annual slate. The margin driver is operating leverage from the Skydance integration efficiency program. The mid-case assumes approximately 1% revenue CAGR and approximately 4% net income margins through 12/31/30.
The high case at approximately $18 requires approximately 1.5% revenue CAGR and approximately 4% net income margins, a scenario where WBD closes cleanly, and synergies materialize within three years. The downside at approximately $13 reflects approximately 1% revenue CAGR with flat margins, where deal delays or linear TV deterioration outpace cost savings.
The TIKR Street mean target stands at approximately $13, with 1 Buy, 2 Outperforms, 11 Holds, 1 No Opinion, 2 Underperforms, and 4 Sells as of May 1, 2026. Morgan Stanley’s double upgrade is a direct challenge to that still-skeptical consensus.
Conclusion
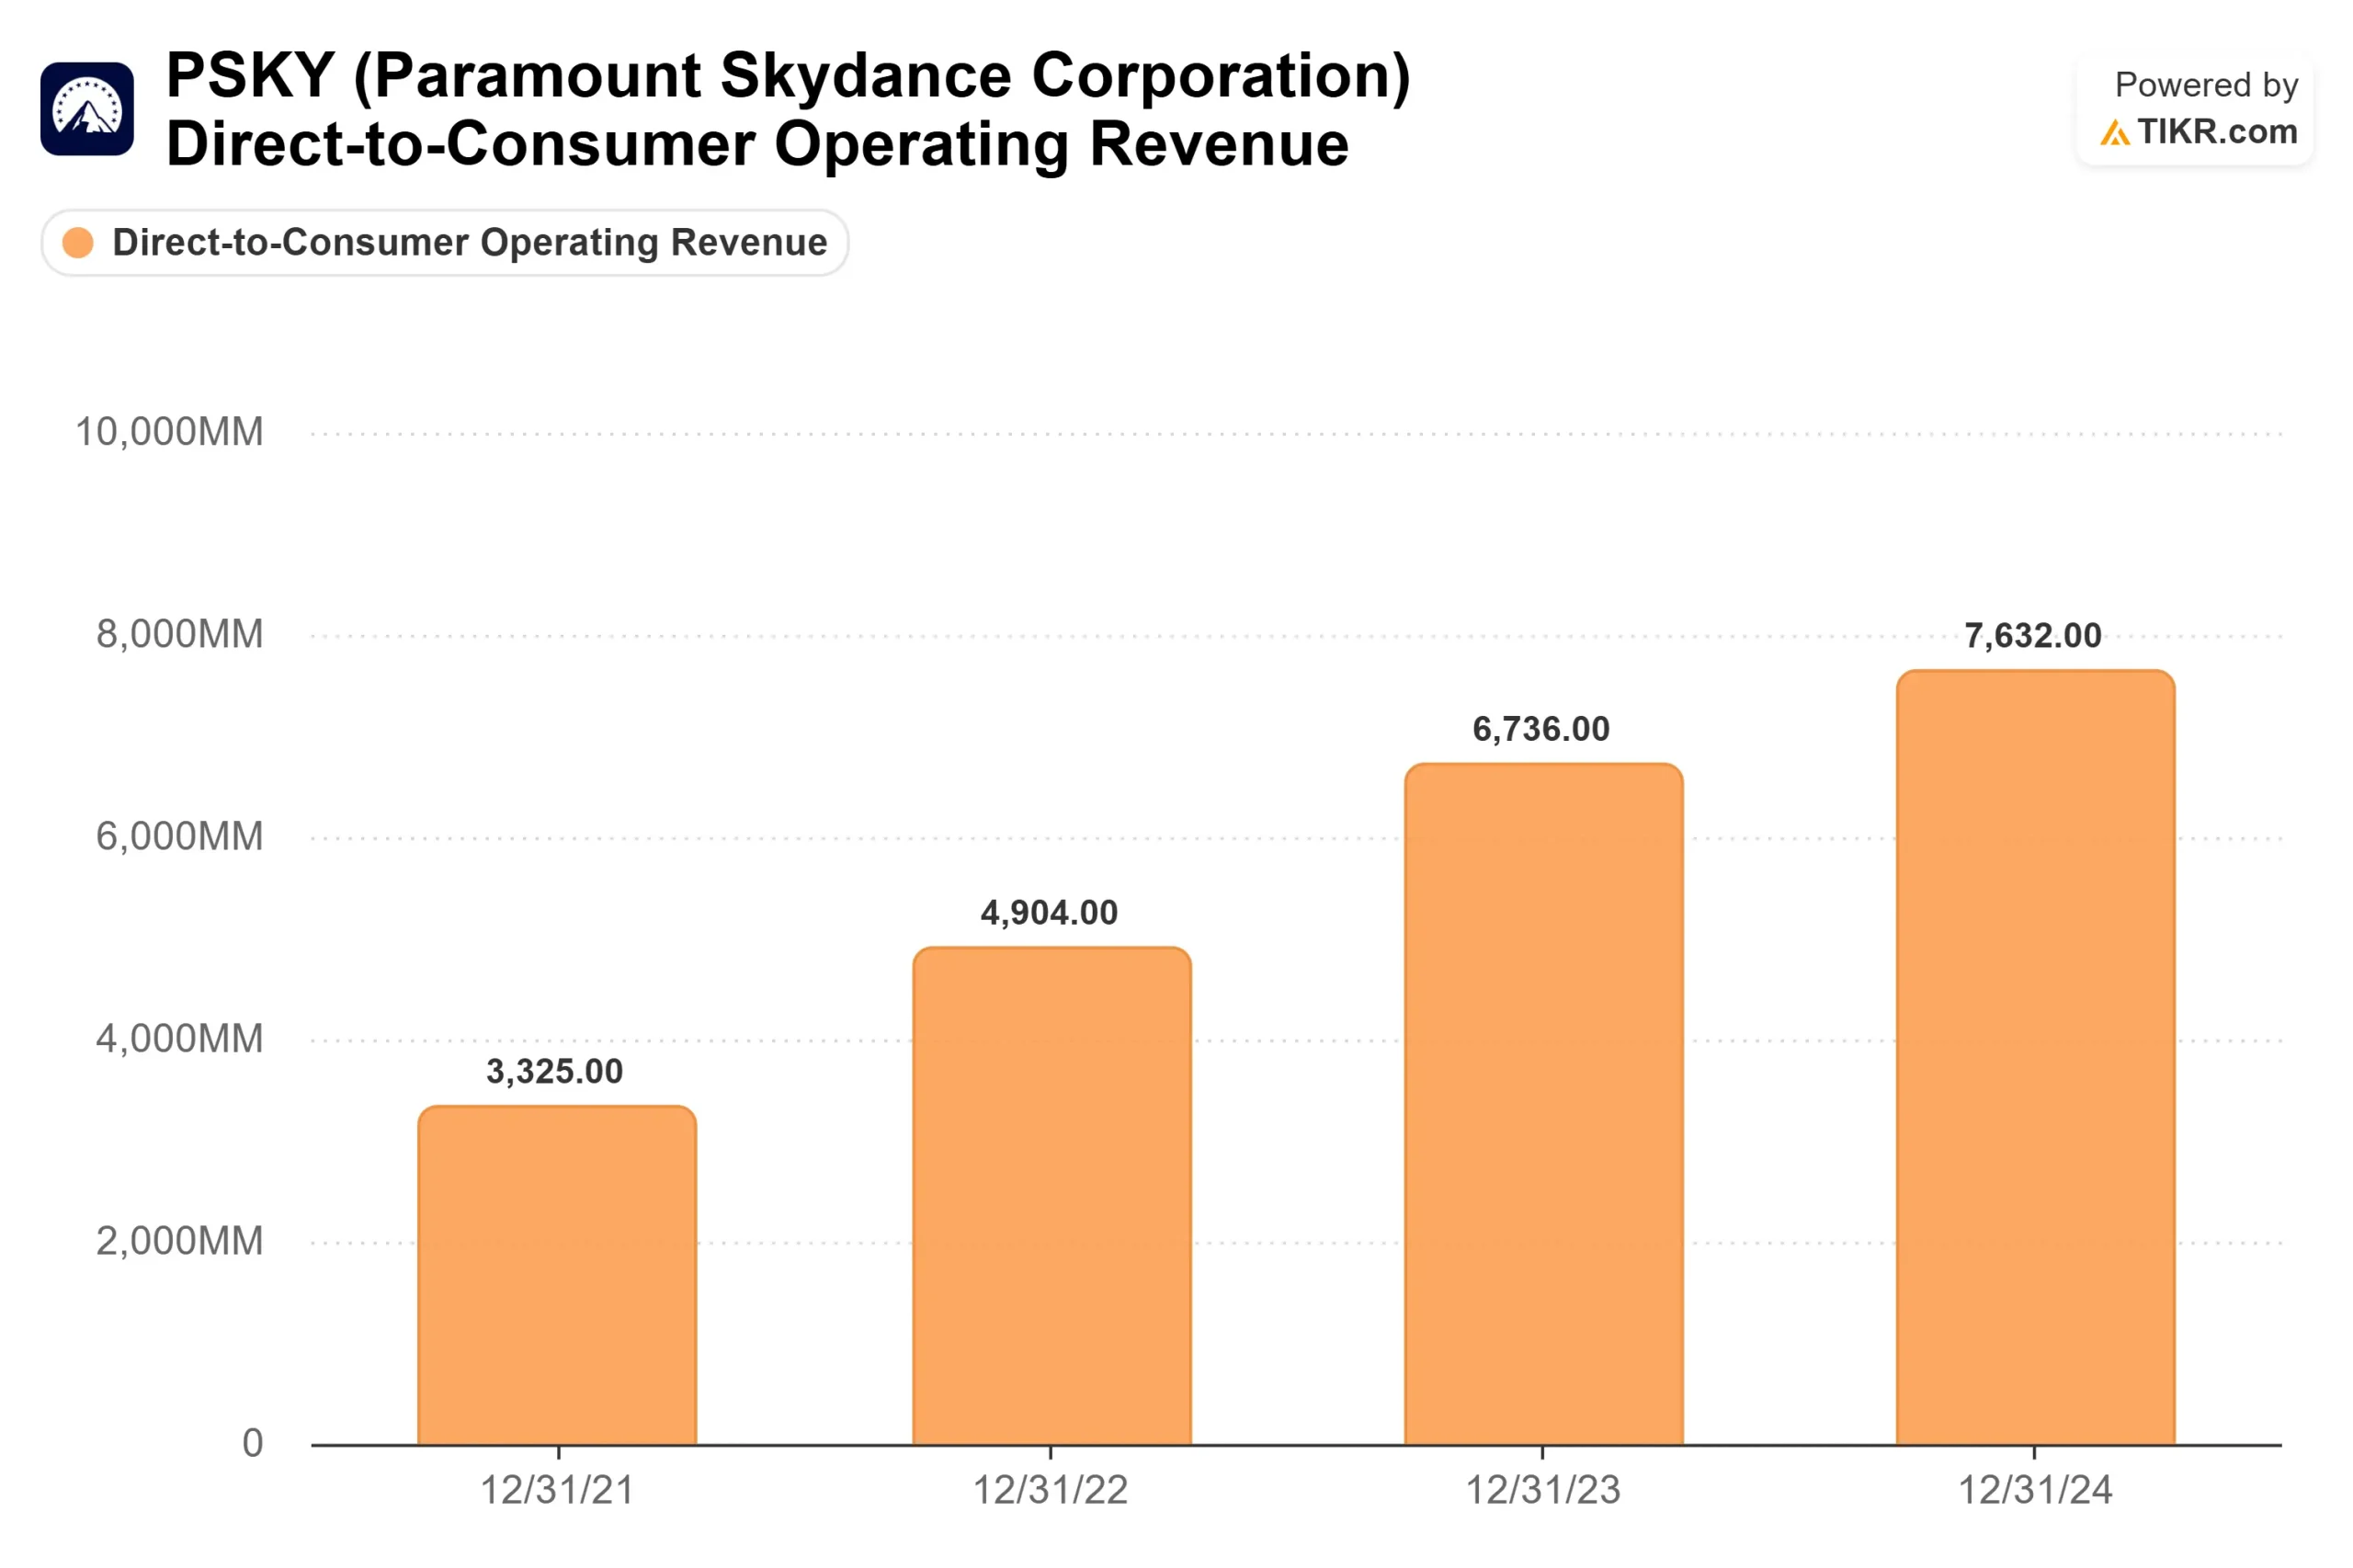
Watch DTC revenue in Monday’s Q1 2026 report. The DTC segment delivered 10% year-over-year growth in Q4 2025, per the company’s Q4 2025 shareholder letter. A repeat or better signal that the streaming engine is running independently of the WBD deal. Anything below 5% growth complicates the standalone story and gives bears more ammunition before regulators have cleared the merger.
PSKY is priced at maximum skepticism about whether David Ellison can execute the largest media deal in a generation. Monday’s earnings print is the first real data point that tests that bet.
See what stocks billionaire investors are buying so you can follow the smart money with TIKR.
Should You Invest in Paramount Skydance?
The only way to really know is to look at the numbers yourself. TIKR gives you free access to the same institutional-quality financial data that professional analysts use to answer exactly that question.
Pull up Paramount Skydance, and you’ll see years of historical financials, what Wall Street analysts expect for revenue and earnings in the quarters ahead, how valuation multiples have moved over time, and whether price targets are trending up or down.
You can build a free watchlist to track Paramount Skydance alongside every other stock on your radar. No credit card required. Just the data you need to decide for yourself.
Analyze Paramount Skydance on TIKR Free →
Looking for New Opportunities?
- See what stocks billionaire investors are buying so you can follow the smart money.
- Analyze stocks in as little as 5 minutes with TIKR’s all-in-one, easy-to-use platform.
- The more rocks you overturn… the more opportunities you’ll uncover. Search 100K+ global stocks, global top investor holdings, and more with TIKR.
Disclaimer:
Please note that the articles on TIKR are not intended to serve as investment or financial advice from TIKR or our content team, nor are they recommendations to buy or sell any stocks. We create our content based on TIKR Terminal’s investment data and analysts’ estimates. Our analysis might not include recent company news or important updates. TIKR has no position in any stocks mentioned. Thank you for reading, and happy investing!