Key Takeaways:
- Earnings Beat: McKesson Corporation reported Q3 adjusted EPS of $9.34 against estimates of $9.22 on February 4, prompting the company to raise full-year adjusted EPS guidance to $38.80–$39.20, representing 17%–19% growth over the prior year.
- Norwegian Exit: McKesson Corporation completed the sale of its Norwegian retail and distribution businesses to NorgesGruppen on January 30, marking its final European exit and redirecting capital toward oncology and biopharma services, which delivered 57% operating profit growth in Q3.
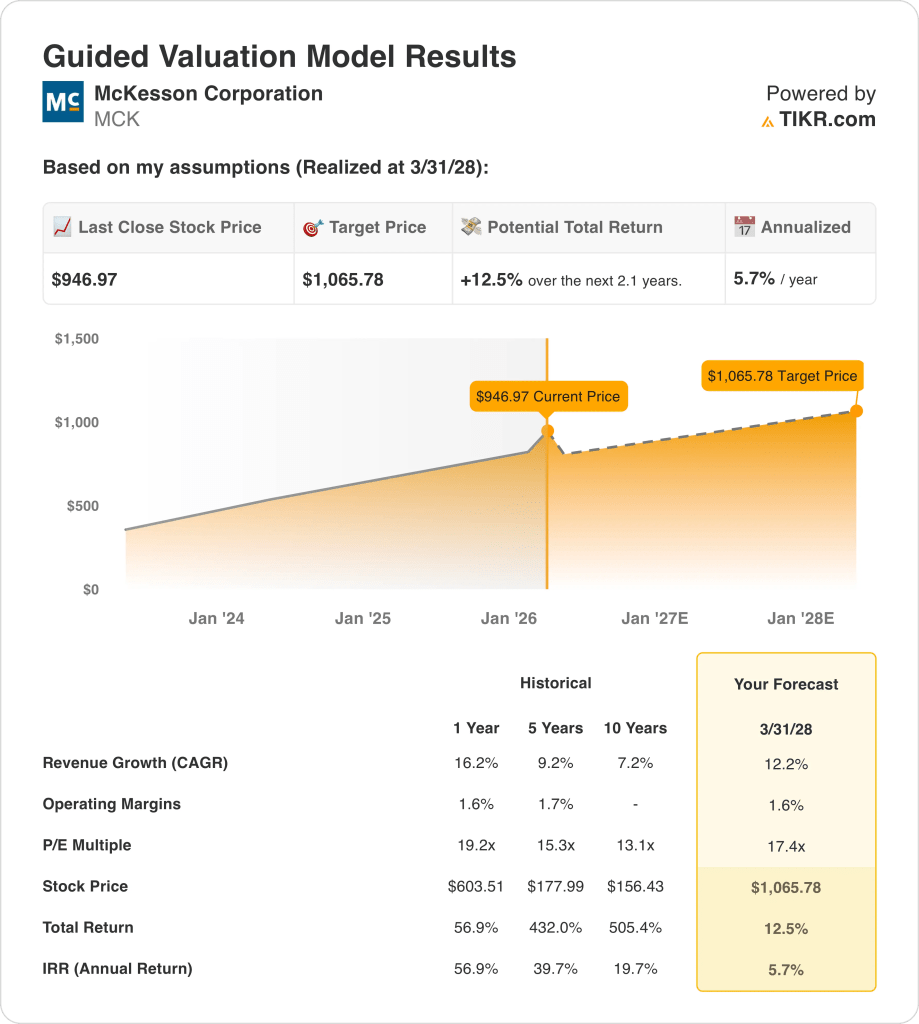
- Price Target: Based on 12% revenue growth, 1.6% operating margins, and a 17.4x exit multiple, McKesson stock could reach $1,066 by March 2028 from $947 today.
- Return Profile: McKesson Corporation implies 13% total upside from $947 to $1,066 over 2.1 years, equating to a 6% annualized return supported by $2.5 billion in planned share repurchases and trailing 12-month free cash flow of $9.6 billion.
Breaking Down the Case for McKesson Corp.
McKesson Corporation (MCK) reported Q3 revenue of $106.2 billion last first week of February, beating estimates by $300 million, as the oncology and multispecialty segment delivered 37% revenue growth and 57% operating profit growth to $366 million.
Fiscal 2025 revenue of $359 billion grew 16% on gross profit of $12.8 billion at 3.6% margins, yet operating income of $4.9 billion held at just 1.4% operating margins as $7.9 billion in SG&A consumed the majority of gross profit across the distribution network.
GLP-1 distribution revenues alone reached $14 billion in Q3, up $3 billion or 26% YoY, with sequential growth of 7%, reinforcing specialty drug volume as the primary revenue engine heading into fiscal 2026’s fourth quarter.
CEO Brian Tyler stated on the February 4 earnings call that “the consistency of our strategy, operational execution and disciplined portfolio management have led to outstanding long-term results,” referencing a 5-year adjusted EPS CAGR of 18% and return on invested capital now exceeding 30%.
Last January 30, the completed Norwegian divestiture freed capital allocation toward oncology infrastructure, with the U.S. Oncology Network now supporting approximately 3,400 providers and PRISM Vision adding over 200 retina and ophthalmology specialists.
Three separate insider share disposals by the SVP Controller, Chief Legal Officer, and Chief HR Officer between February 9 and February 19 introduce a cautionary signal against the 43% stock appreciation delivered in 2025.
The investment tension centers on whether McKesson stock sustains 12% revenue growth and 1.6% operating margins through the Medical-Surgical IPO separation targeted for the second half of 2027, against a backdrop of $947 current price, 17.4x exit multiple, and a 6% annualized return through March 2028 that sits below the 10% equity hurdle rate.
What the Model Says for MCK Stock
McKesson stock’s Q3 beat of $300 million in revenue and the Norwegian divestiture completed January 30 sharpen the oncology and biopharma growth thesis, yet the 1.4% operating margin structure on a $397 billion revenue base leaves almost no room for cost absorption before earnings deteriorate.
The model’s assumption of 12.2% revenue growth, 1.6% operating margins, and a 17.4x exit multiple produces a $1,066 target price by March 2028, with the margin assumption in line with fiscal 2025’s 1.4% reported level and the growth assumption sitting above the 5-year CAGR of 9.2% but below the 1-year 16.2%.
The market assumption for the forward P/E as of February 18 stands at 21.90x, expanding from 16.45x at December 2024, as GLP-1 distribution revenues growing 26% and oncology segment operating profit surging 57% drove investor willingness to pay above 20x, placing the model’s 17.4x exit well below the current market assumption and requiring meaningful de-rating to reach the target price.

The street mean target of $980 against a $947 close produces a target-to-price ratio of 103.5%, compressing from 114.7% at December 2024 as the stock ran faster than analyst targets, while the current recommendation breakdown of 10 Buys, 3 Outperforms, 4 Holds, and 1 Underperform reflects stable conviction that has not materially strengthened despite the 43% gain in 2025.
The model delivers 12.5% total upside from $947 to $1,066, equating to a 5.7% annualized return that falls materially below the 10% equity hurdle, supported by $9.6 billion in trailing free cash flow but constrained by a market already pricing the stock above the model’s exit multiple.
Three senior executives, the SVP Controller, Chief Legal Officer, and Chief HR Officer, disposed of shares between February 9 and February 19, adding a cautionary insider signal to a stock already trading above the model’s 17.4x exit at a market assumption of 21.90x.
This is a high-conviction Sell: the 5.7% annualized return falls materially below the 10% hurdle, the market assumption of 21.90x already trades 26% above the model’s 17.4x exit multiple requiring de-rating to reach $1,066, the street mean at 103.5% of current price signals near-term upside exhaustion, and three insider disposals in 10 days reinforce the signal.
Our Valuation Assumptions
TIKR’s Valuation Model lets you plug in your own assumptions for a company’s revenue growth, operating margins, and P/E multiple, and calculates the stock’s expected returns.
Here’s what we used for McKesson stock:
1. Revenue Growth: 12.2%
McKesson stock delivered 16.2% revenue growth in fiscal 2025 to $359 billion, driven by GLP-1 distribution revenues growing 26% and oncology segment revenue surging 37%, yet both tailwinds now face natural deceleration as the GLP-1 launch cycle matures.
The fiscal 2026 estimate of $408 billion reflects 13.8% growth, nearly in line with the model’s assumption, as North American Pharmaceutical segment revenues of $88.3 billion in Q3 grew 9% while oncology acquisitions including PRISM Vision and Florida Cancer Specialists added incremental revenue not present in the prior year base.
The 12.2% model’s assumption through March 2028 rests on GLP-1 sequential growth sustaining above 7% per quarter, the Medical-Surgical IPO separation completing without disrupting distribution revenues, and North American Pharmaceutical operating profit growth holding within the guided 8%–12% range.
Any deceleration in GLP-1 sequential volume below 7%, combined with Medical-Surgical separation costs and IRA Part D price reductions on the first 10 drugs taking effect in January, compounds revenue shortfalls faster than oncology acquisition contributions can absorb, as each 1% revenue miss on $408 billion represents $4 billion in foregone top-line growth.
This sits below the 1-year revenue growth of 16.2%, as GLP-1 launch-cycle volumes and oncology acquisition step-ups from PRISM and Florida Cancer Specialists created a non-repeating base effect, and sustaining 12.2% requires specialty distribution growth to remain above 9% without further IRA pricing headwinds reducing branded drug revenue contribution.
2. Operating Margins: 1.6%
McKesson stock reported 1.6% operating margins in fiscal 2025 on $4.92 billion in operating income, as gross profit of $12.82 billion at 3.6% margins funded $7.91 billion in SG&A, leaving less than 2 cents of every revenue dollar as operating income across a $359 billion distribution base.
The 1.6% model’s assumption sits in line with fiscal 2025’s 1.6% reported level, consistent with the fiscal 2026 EBIT margin estimate of 1.6%, as the 138 basis point improvement in operating expenses as a percentage of gross profit in Q3 offsets technology infrastructure investment headwinds of approximately $0.05 per share in Q4.
Holding 1.6% through March 2028 requires SG&A to grow slower than the 13.8% revenue pace forecast for fiscal 2026, Medical-Surgical separation costs to stay within planned bounds ahead of the second half 2027 IPO, and oncology segment margin improvement from PRISM and Florida Cancer integration to offset corporate expense growth above $620 million.
The market assumption for the forward P/E as of February 18 stands at 21.90x, expanding from 19.91x at December 2025, as the Q3 adjusted EPS beat of $9.34 versus $9.22 estimates and the raised full-year guidance drove investor willingness above 20x, creating a sentiment premium the model’s flat 1.6% margin assumption does not fully support.
Any failure in SG&A discipline, combined with Medical-Surgical separation legal and operational costs and Q4 technology infrastructure investments of approximately $0.05 per share, pushes operating margins back toward the 1.5% reported in fiscal 2024 faster than oncology platform scale can recover, as each 10 basis point margin shortfall on $408 billion of forward revenue represents $408 million in missed operating income.
This sits in line with the 1-year operating margin of 1.6%, as the model embeds no structural improvement beyond what the business already delivers, and sustaining 1.6% through March 2028 requires the Medical-Surgical separation to proceed without margin dilution while GLP-1 mix dynamics do not erode the distribution fee structure below current levels.
3. Exit P/E Multiple: 17.4x
The 17.4x exit multiple capitalizes McKesson stock’s normalized net income at March 2028 under conditions of 12.2% revenue growth and 1.6% operating margins, treating the multiple as a terminal earnings anchor for a pharmaceutical distribution platform with structurally thin margins and high prescription volume dependency.
The model already embeds 12.2% revenue growth and stable 1.6% operating margins through March 2028, meaning the 17.4x exit multiple does not require additional credit for GLP-1 volume expansion or oncology acquisition contributions, as both are absorbed in the earnings trajectory.
The market assumption for the forward P/E as of February 18 stands at 21.90x, expanding from 16.45x at December 2024, as oncology segment operating profit growth of 57% and the raised full-year EPS guidance to $38.80–$39.20 drove investor willingness above 20x, placing the model’s 17.4x exit well below the current market assumption and requiring meaningful de-rating to reach the $1,066 target price.
If Medical-Surgical separation costs escalate, three concurrent senior insider share disposals in February signal peak-cycle sentiment, and IRA Part D pricing reductions compress North American Pharmaceutical operating profit growth below 8%, earnings pressure pushes the sustainable multiple toward 13.1x (the 10-year historical P/E) rather than sustaining near 17.4x, collapsing the $1,066 target price materially.
This sits below the 1-year historical P/E of 19.2x, as the model embeds a de-rating from current market pricing of 21.90x toward a more normalized distribution multiple, and sustaining even 17.4x through March 2028 requires GLP-1 volume growth and oncology platform execution to hold without IRA pricing headwinds compressing the earnings base below the model’s trajectory.
What Happens If Things Go Better or Worse?
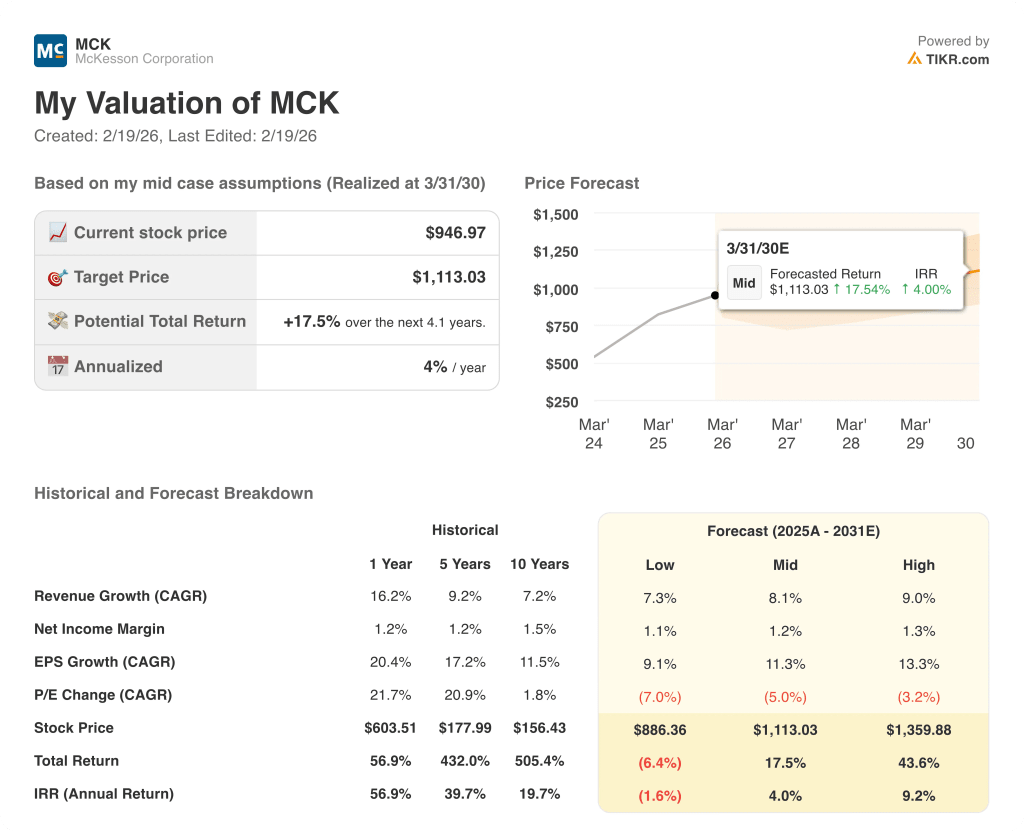
McKesson stock scenarios through March 2030 center on whether GLP-1 distribution volumes sustain sequential momentum, oncology platform integration delivers margin stability, and the Medical-Surgical separation executes without disrupting the core distribution business.
- Low Case: If GLP-1 sequential growth slows and Medical-Surgical separation costs weigh on earnings, revenue grows around 7% and net income margins stay near 1.1% → negative 2% annualized return.
- Mid Case: With specialty distribution growth holding and oncology integration progressing as guided, revenue growth near 8% and margins steady at 1.2% → 4% annualized return.
- High Case: If oncology provider network expansion accelerates and biopharma services annual verification volumes grow faster than guided, revenue reaches about 9% and margins improve toward 1.3% → 9% annualized return.
How Much Upside Does McKesson Stock Have From Here?
With TIKR’s new Valuation Model tool, you can estimate a stock’s potential share price in under a minute.
All it takes is three simple inputs:
- Revenue Growth
- Operating Margins
- Exit P/E multiple
If you’re not sure what to enter, TIKR automatically fills in each input using analysts’ consensus estimates, giving you a quick, reliable starting point.
From there, TIKR calculates the potential share price and total returns under Bull, Base, and Bear scenarios so you can quickly see whether a stock looks undervalued or overvalued.
Looking for New Opportunities?
- See what stocks billionaire investors are buying so you can follow the smart money.
- Analyze stocks in as little as 5 minutes with TIKR’s all-in-one, easy-to-use platform.
- The more rocks you overturn… the more opportunities you’ll uncover. Search 100K+ global stocks, global top investor holdings, and more with TIKR.
Disclaimer:
Please note that the articles on TIKR are not intended to serve as investment or financial advice from TIKR or our content team, nor are they recommendations to buy or sell any stocks. We create our content based on TIKR Terminal’s investment data and analysts’ estimates. Our analysis might not include recent company news or important updates. TIKR has no position in any stocks mentioned. Thank you for reading, and happy investing!