
Stock-based compensation represents a significant but often misunderstood cost for modern businesses. While companies frequently add this expense back to their adjusted earnings so it doesn’t reduce reported profits, it remains a real economic cost to shareholders.
Each share issued to employees through SBC effectively dilutes existing shareholders. Understanding how this mechanism works helps you determine whether a company is truly profitable or merely shifting its labor costs from operating expenses to dilution through stock-based compensation.
The goal of this analysis is to identify where employee incentives align with shareholder interests. If a company issues excessive equity without achieving a corresponding rise in business value, the shareholders suffer. A disciplined approach to stock-based compensation helps you separate sustainable business models from those that rely on continuous dilution to survive.
Tracking the Magnitude of Stock-Based Compensation Expense
Measuring stock-based compensation as a percentage of revenue and cash from operations is the first step in this analysis. This section is included because it reveals how much of the company’s productivity is actually flowing to employees rather than owners. High-growth technology firms often use equity to attract talent, but this cost must eventually normalize for the business to create value for you.
You should compare this expense to the company’s net income to determine whether the business would be profitable without equity pay. Many companies report positive adjusted EBITDA while remaining deep in the red when you include the cost of issuing shares. This discrepancy matters because the market eventually values companies based on their true economic earnings, not adjusted figures that ignore real costs.
Tracking the trend over several years reveals whether management is becoming more disciplined or more aggressive with equity grants. If expenses grow faster than revenue, the business model may be structurally flawed. A company that cannot attract or retain talent without constantly increasing the rate of dilution faces a difficult path to long-term compounding.

TIKR Tip: Use TIKR’s Detailed Financials to find Stock-Based Compensation in the Cash Flow Statement and compare its size to Revenue and Net Income over the last ten years for companies like Plug Power (PLUG).
Evaluate a company’s stock-based compensation, net income, and total revenues (Free with TIKR) >>>
Analyzing the Dilutive Impact on Shareholders
The most direct way to measure the impact of equity pay is to monitor the number of shares outstanding. This section explains why you should consider the share count when assessing the true cost of employee grants. If the share count rises every year, your ownership stake in the company’s future profits is shrinking.
A rising share count acts as a headwind for earnings per share growth. Even if a company grows its total net income by 10%, your return will be zero if the share count also grows by 10%. You must ensure the business is growing fast enough to offset the dilution from its compensation practices.
Investors should look for a disconnect between reported “returns of capital” and the actual reduction in share count. Some companies spend billions on buybacks but only keep the share count flat because they are buying back shares they just gave to employees. This section helps you determine if a buyback program is a genuine return of cash or merely a hidden labor expense.

TIKR Tip: Review the Shares Outstanding row in TIKR’s Detailed Financials to see if the total equity base is actually shrinking or growing over time.
Review basic shares outstanding for any stock in less than 60 seconds with TIKR (It’s free) >>>
Evaluating Management Alignment and Incentives
Stock-based compensation should ideally turn employees into owners who think like you. This section is included because the structure of these grants determines whether management is incentivized to create long-term value. You must check whether the grants are tied to specific performance hurdles or if they are simply time-based awards that vest regardless of results.
Performance-based equity that rewards Return on Capital (ROC) or free cash flow per share growth aligns management’s interests with yours. Grants that only require the executive to remain employed for three years provide no protection for shareholders. If management receives massive equity awards while the stock price is declining, the incentive system is broken.
High levels of insider ownership generally suggest that the compensation program has worked as intended. When executives hold their vested shares rather than selling them immediately, they demonstrate conviction in the company’s future. Watching for open-market purchases by insiders provides the ultimate confirmation that the leadership team believes the stock is undervalued.
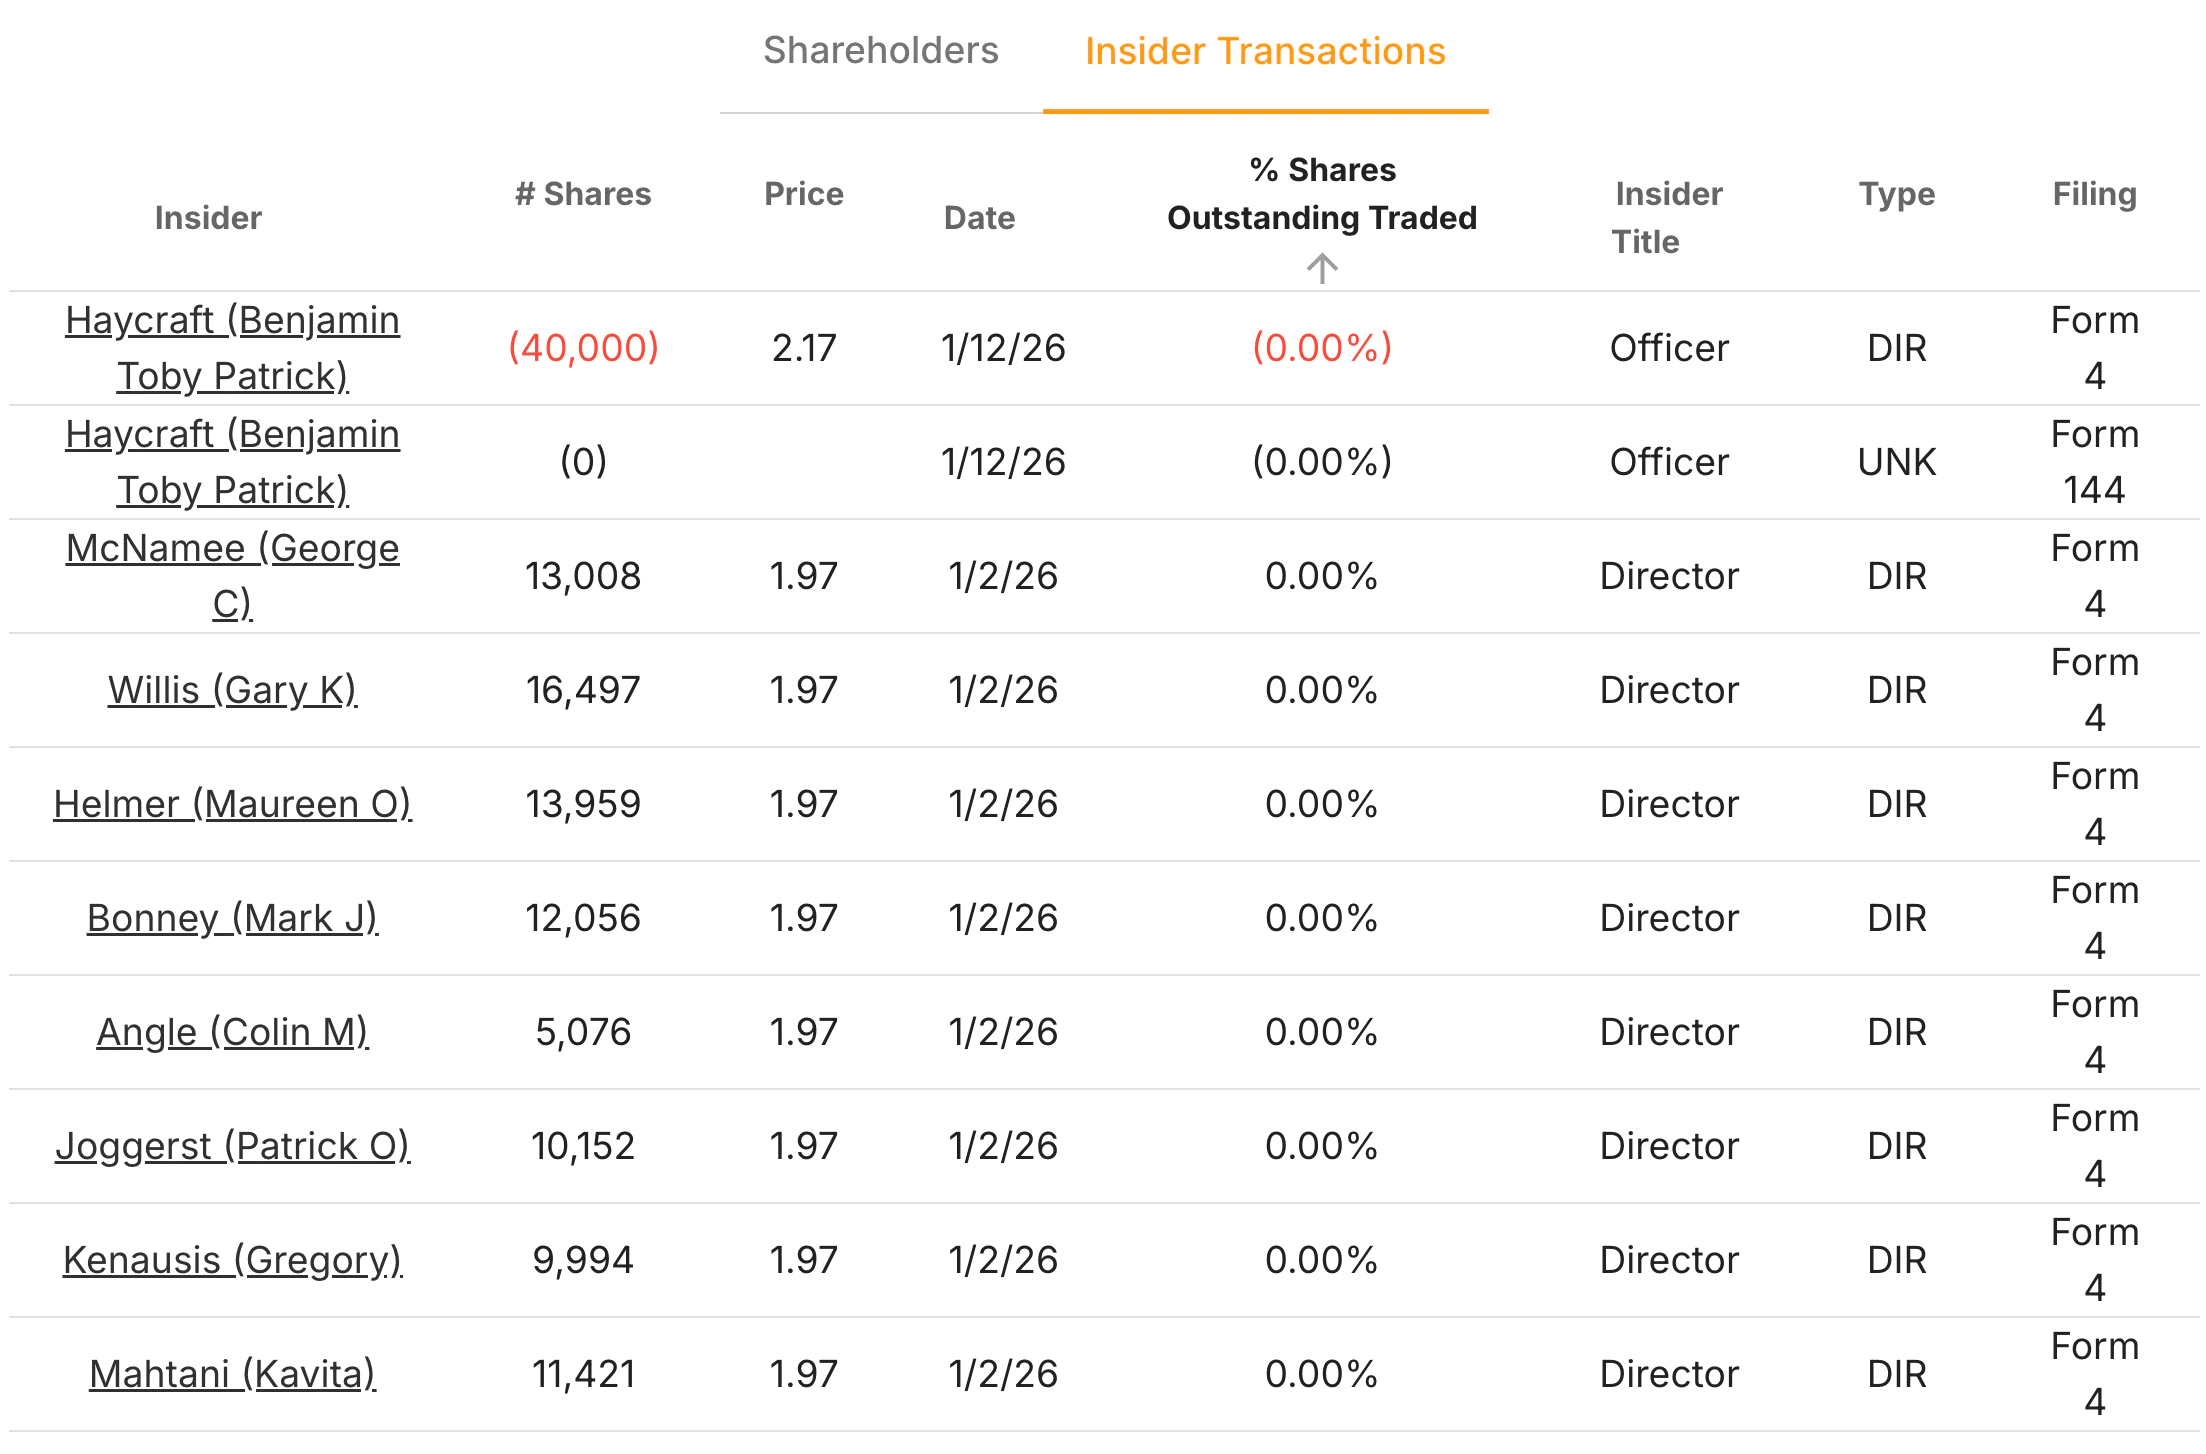
TIKR Tip: Use the Ownership tab in TIKR to monitor insider holdings and see if executives are retaining the shares they receive through compensation programs.
Assessing the Impact on Valuation Multiples
The market often assigns different multiples to companies based on how they handle equity pay. This section explains how stock-based compensation influences the price you should be willing to pay for a stock. A company with high dilution should trade at a discount to a peer that funds its labor costs entirely with cash.
When you use a P/E ratio, you are using a denominator that often excludes the impact of future dilution. If you ignore the shares that the company will issue next year, you are overstating the value of your current stake. Adjusting your valuation models to account for ongoing dilution ensures that you do not overpay for a business with a hidden cost structure.
Calculating a “diluted” free cash flow yield provides a clearer picture of the investment opportunity. You do this by subtracting the stock-based compensation expense from the cash from operations before calculating the yield. This conservative approach allows you to compare businesses on a level playing field, regardless of how they pay their employees.

TIKR Tip: Check the Estimates tab in TIKR to see if analyst forecasts for EPS account for projected increases in the share count over the next three years.
The TIKR Takeaway
Stock-based compensation is a real expense that requires careful analysis to avoid valuation traps. While companies often treat it as a non-cash item, the resulting dilution has a permanent impact on your ownership of the business. By tracking the share count and comparing equity pay to actual profitability, you can identify which companies are truly creating value for shareholders.
The best companies use equity pay sparingly and ensure it delivers higher returns for all owners. When management uses stock to align interests without diluting the share count, they create a powerful engine for compounding. TIKR gives you the historical data and ownership trends needed to verify that a company’s pay structure works for you, not against you.
Find undervalued stocks in less than 60 seconds with TIKR’s new Valuation Model (It’s free) >>>
Value Any Stock in Under 60 Seconds with TIKR
With TIKR’s new Valuation Model tool, you can estimate a stock’s potential share price in under a minute.
All it takes is three simple inputs:
- Revenue Growth
- Operating Margins
- Exit P/E Multiple
If you’re not sure what to enter, TIKR automatically fills in each input using analysts’ consensus estimates, giving you a quick, reliable starting point.
From there, TIKR calculates the potential share price and total returns under Bull, Base, and Bear scenarios so you can quickly see whether a stock looks undervalued or overvalued.
See a stock’s true value in under 60 seconds (Free with TIKR) >>>
Looking for New Opportunities?
- Discover which stocks billionaire investors are purchasing, so you can follow the smart money.
- Analyze stocks in as little as 5 minutes with TIKR’s all-in-one, easy-to-use platform.
- The more rocks you overturn… the more opportunities you’ll uncover. Search 100K+ global stocks, global top investor holdings, and more with TIKR.
Disclaimer:
Please note that the articles on TIKR are not intended to serve as investment or financial advice from TIKR or our content team, nor are they recommendations to buy or sell any stocks. We create our content based on TIKR Terminal’s investment data and analysts’ estimates. Our analysis might not include recent company news or important updates. TIKR has no position in any stocks mentioned. Thank you for reading, and happy investing!