Net income serves as the starting point for most investment research, but it rarely tells the full story of a company’s financial health. While accounting profits provide a theoretical view of earnings, they often include non-cash items and estimates that do not reflect actual money moving into the bank. This article explains how to bridge the gap between reported profits and the cash a business actually generates.
The goal of this analysis is to identify companies that convert their accounting earnings into tangible value. A business that reports high net income but consistently fails to produce cash faces structural risks that net income alone will not reveal. Conversely, a company with temporarily low net income but high cash generation may represent a misunderstood opportunity.
By comparing these two metrics, you can evaluate the quality of a company’s earnings and its ability to fund future growth. Understanding this relationship helps you avoid businesses that use accounting maneuvers to mask poor performance. You will learn how to verify that the profits you see on the income statement actually exist in the form of cold, hard cash.
Find out what a stock’s really worth in under 60 seconds with TIKR’s new Valuation Model (It’s free)>>>
The Structural Differences Between Profit and Cash
Net income relies on accrual accounting, which records revenue and expenses when they occur rather than when cash changes hands. This section is included because investors must understand that “profit” is an opinion while “cash” is a fact. High net income can coexist with a shrinking bank account if a company struggles to collect payments from customers.
Free Cash Flow (FCF) provides a more rigorous measure of performance by subtracting capital expenditures from cash from operations. This figure represents the actual cash available to pay dividends, buy back shares, or acquire other businesses. If net income consistently exceeds FCF over several years, the company may be overstating its true earning power through aggressive accounting.+1
A wide gap between these two figures often signals that a company has high reinvestment needs or poor working capital management. You must determine if the discrepancy is a temporary timing issue or a permanent feature of the business model. Monitoring this trend ensures that you only invest in businesses that turn their growth into liquid assets.

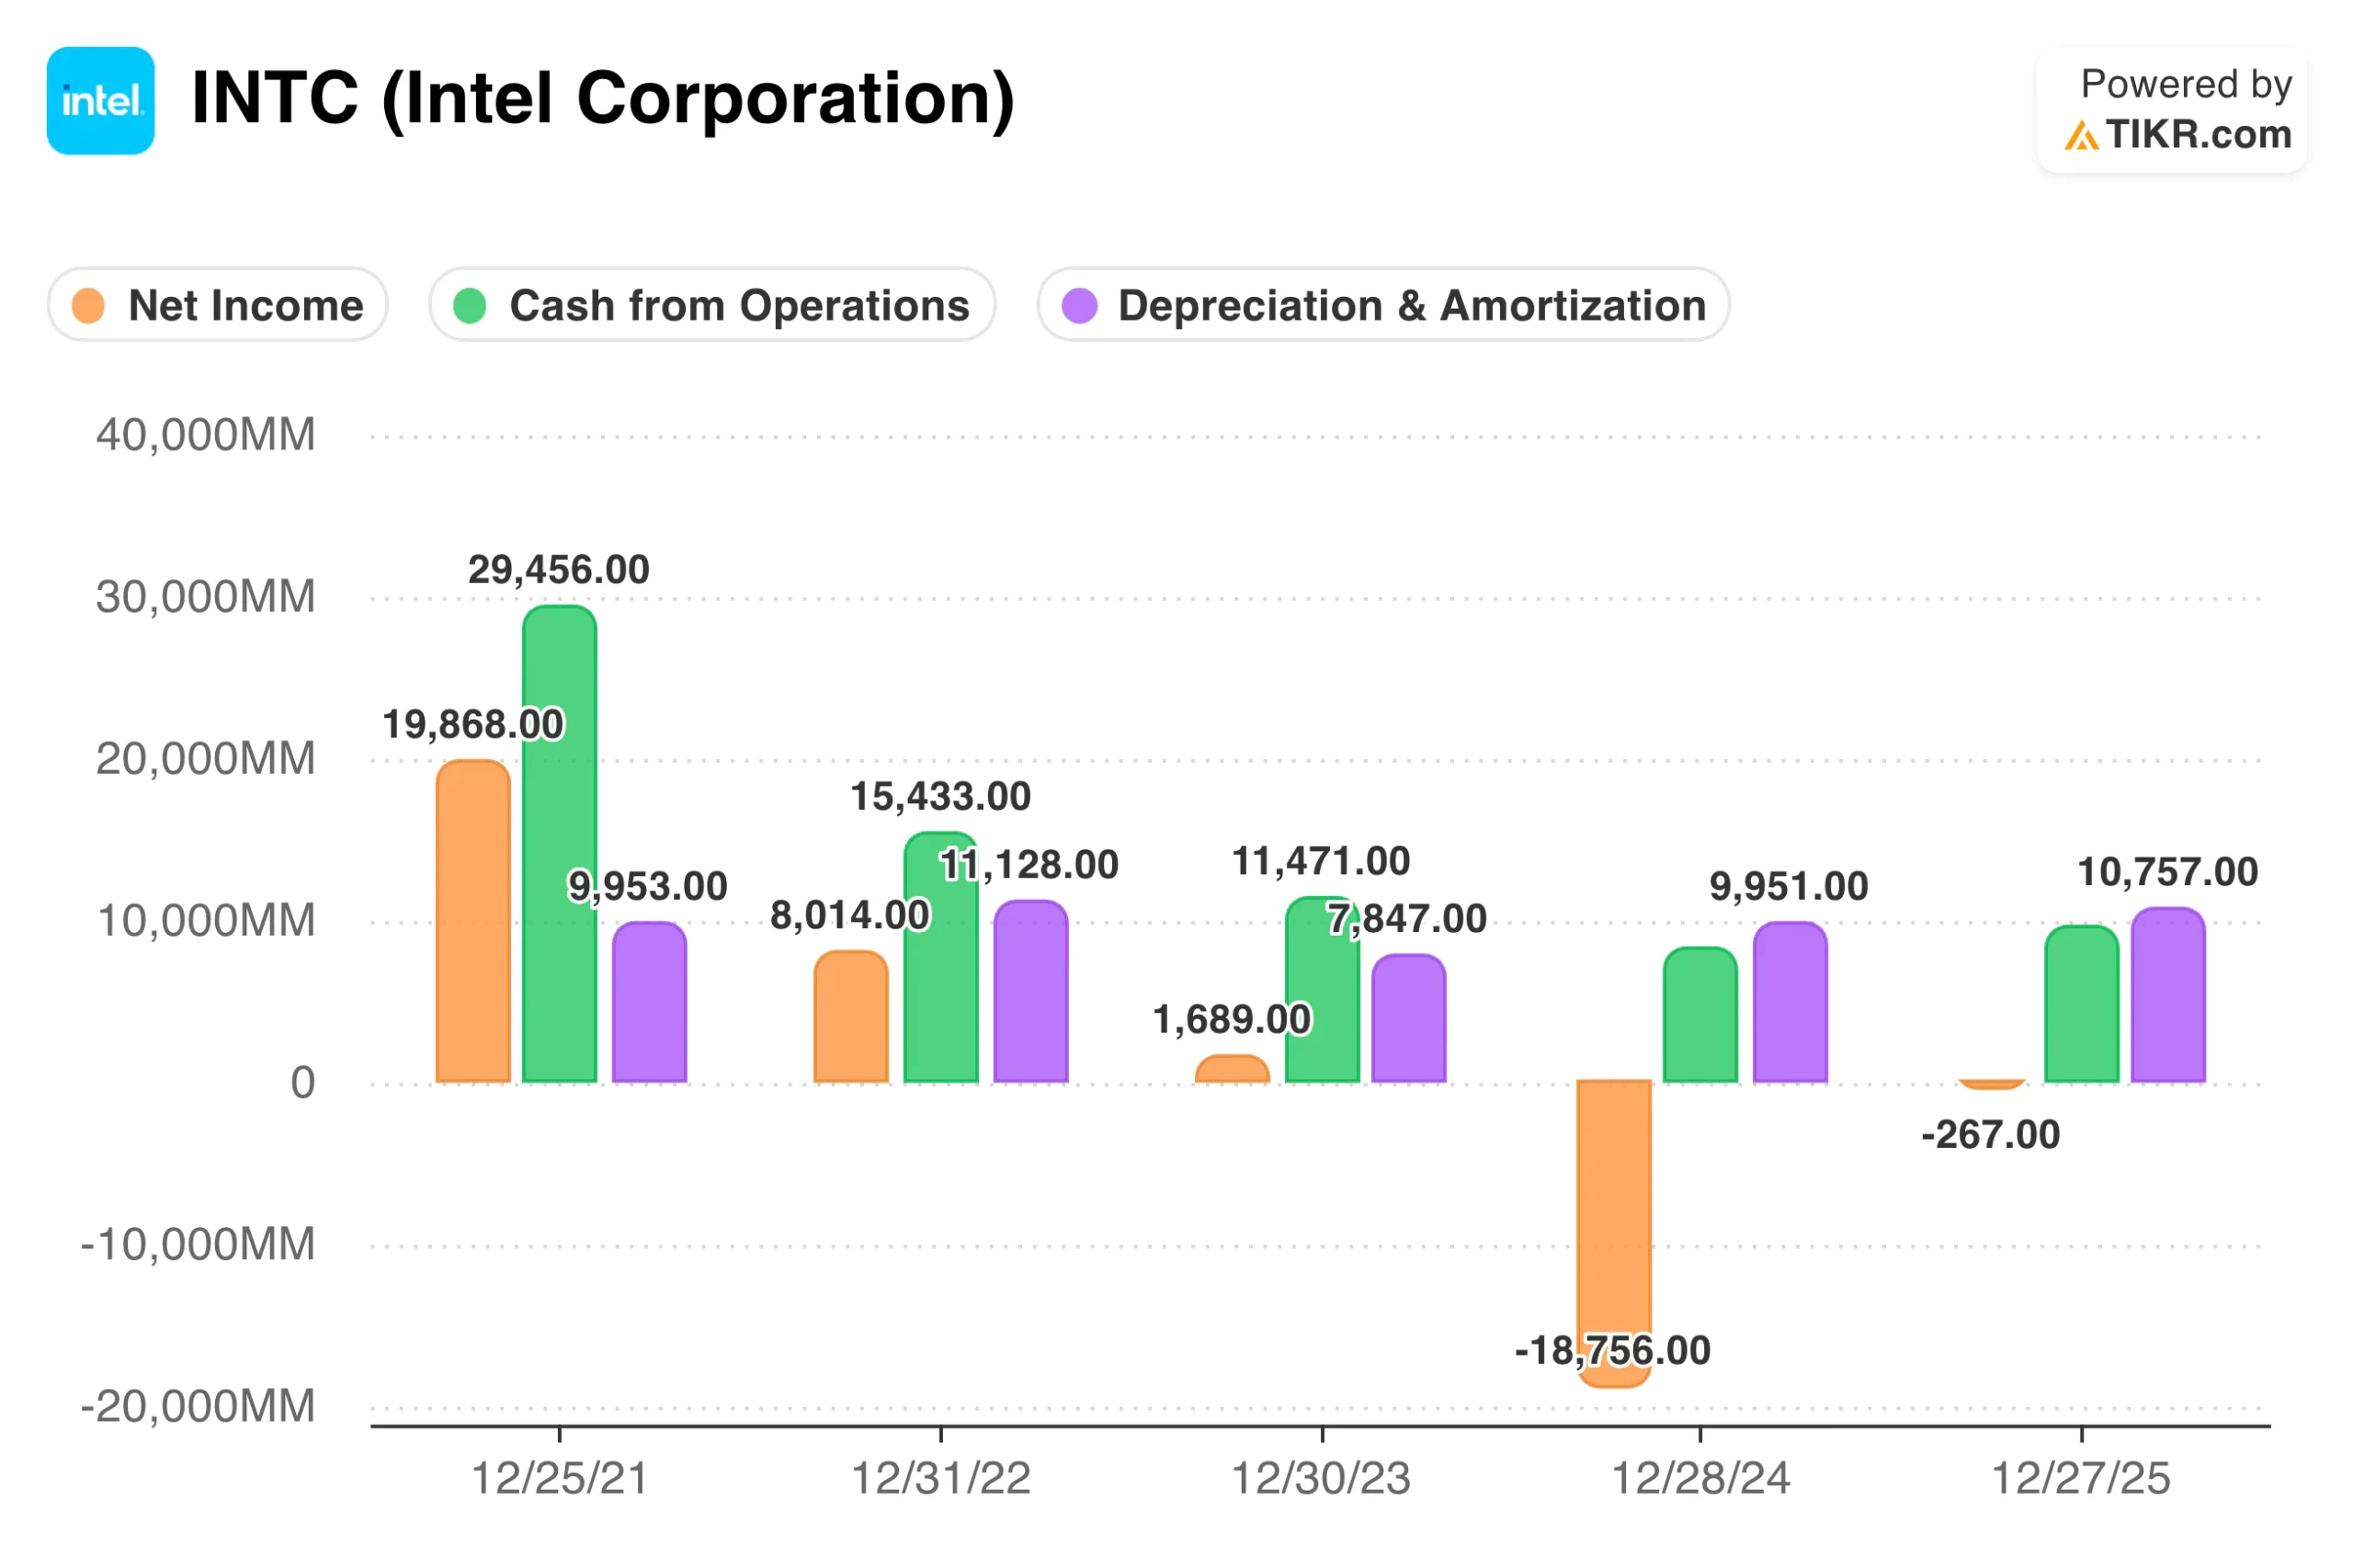
TIKR Tip: Use TIKR’s Detailed Financials to view the Cash Flow Statement of companies like Intel (INTC) and compare the “Net Income” line at the top to the “cash from operations” subtotal to assess earnings quality.
Review a stock’s detailed financials like cash flow statements instantly (Free with TIKR) >>>
Evaluating Capital Intensity and Maintenance Costs
Capital expenditures (CapEx) represent the primary wedge between net income and free cash flow. This section is vital because it explains how the cost of maintaining and growing a business impacts your returns. Some businesses require massive spending on equipment and infrastructure just to stay competitive, which drains the cash available to shareholders.
You must distinguish between growth CapEx, which expands the business, and maintenance CapEx, which simply keeps it running. A company might report strong net income because depreciation expenses on the income statement are lower than the actual cash cost of replacing aging assets. If a business must spend more on CapEx than it records in depreciation, its real economic profits are lower than its reported net income.
Analyzing this relationship reveals the true capital intensity of a business. High-quality compounders often have the ability to grow with minimal incremental capital, leading to FCF that closely tracks or exceeds net income. Asset-heavy businesses often face the opposite reality, where net income looks attractive but free cash flow remains elusive because the company must constantly buy new equipment.

TIKR Tip: Compare Capital Expenditures in the Cash Flow Statement to Depreciation and Amortization in the Income Statement; if CapEx is consistently higher, use the Transcripts section to search for “Maintenance CapEx” and see if accounting profits are overstating the company’s true health.
The Role of Working Capital in Cash Generation
Working capital adjustments often cause significant short-term swings between net income and cash flow. This section is included because changes in accounts receivable, inventory, and accounts payable can either trap or release massive amounts of cash. A company that grows quickly but requires huge amounts of inventory to do so may find itself “growing broke.”
If accounts receivable grow much faster than revenue, the company is booking sales but not collecting cash. This pattern often suggests that management is offering loose credit terms to hit short-term revenue targets. Similarly, a build-up in inventory might indicate that products are not selling as expected, which eventually leads to write-downs that hurt future net income.
Efficient companies manage their working capital as a source of strength. Some businesses even operate with negative working capital, meaning they collect cash from customers before they have to pay their suppliers. This creates a cash-rich environment where FCF consistently exceeds net income, providing management with more options for capital allocation.
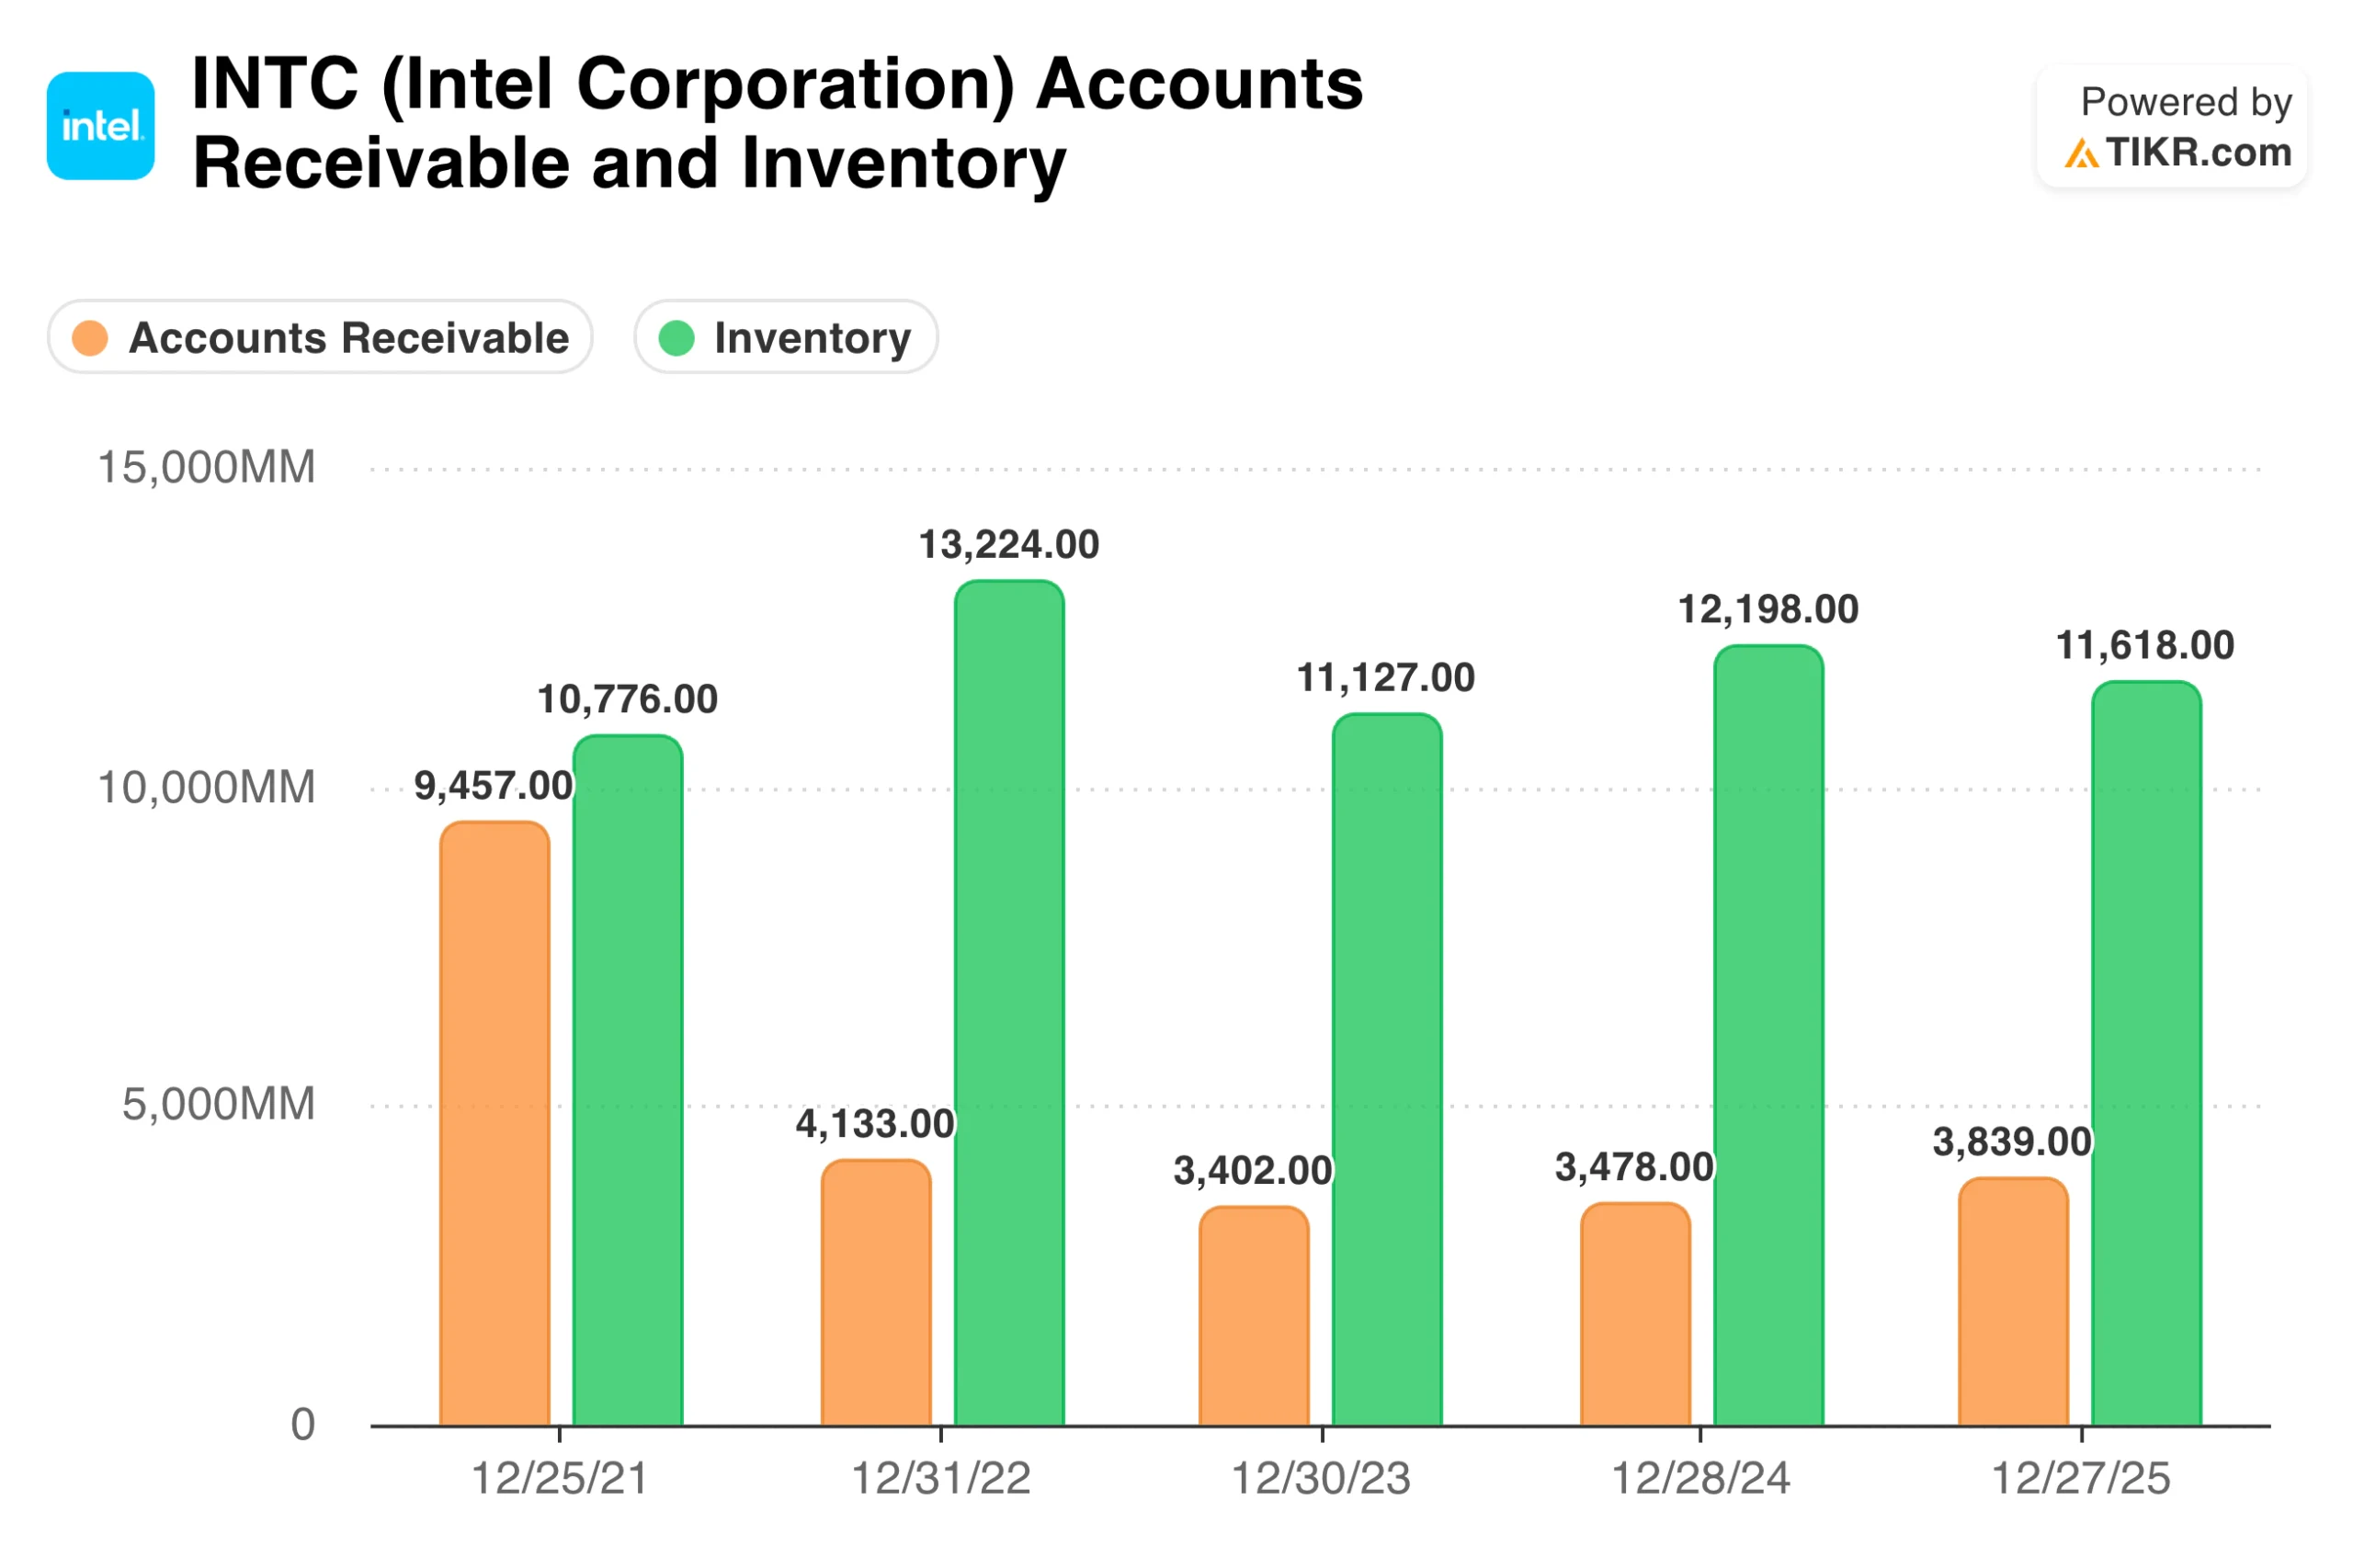
TIKR Tip: Examine the Balance Sheet in TIKR to track trends in Accounts Receivable and Inventory relative to Revenue growth over several consecutive quarters.
Identifying Red Flags in Non-Cash Adjustments
Management teams have several levers they can pull to adjust net income without impacting cash flow. This section is crucial because it helps you identify red flags like large non-cash gains or unusual tax adjustments. If a company relies on one-time accounting gains to meet earnings expectations, the quality of that net income is low.
Stock-based compensation is another major non-cash item that boosts “cash from operations” while diluting shareholders. While companies add this back to cash flow because it is a non-cash expense, you must remember that it is still a real cost. High-quality analysis involves subtracting stock-based compensation from FCF to arrive at a “true” owner’s cash flow.
Consistent write-downs or restructuring charges are also indicators of poor earnings quality. If a company frequently reports “one-time” expenses that occur every year, those costs are effectively part of the normal operations. Comparing the frequency of these charges to the actual cash outflows helps you see past the adjusted figures management wants you to focus on.
TIKR Tip: Review the Adjustments to Net Income section in the Cash Flow Statement; if adjustments like Stock-Based Compensation or Depreciation & Amortization drive the majority of your cash flow, the business may be less profitable than it appears.
The TIKR Takeaway
Analyzing the relationship between free cash flow and net income is the most effective way to verify the health of a business. Net income provides the narrative, but free cash flow provides the proof. By focusing on companies that generate high cash flows relative to their reported profits, you protect yourself from accounting traps and identify genuine compounders.
The best investments are businesses that convert a high percentage of their earnings into free cash flow with minimal capital intensity. This cash provides the fuel for dividends, buybacks, and smart acquisitions that drive long-term share price appreciation. TIKR provides the full suite of financial statements and ratios needed to perform this deep-dive analysis on any global company.
Find undervalued stocks in less than 60 seconds with TIKR’s new Valuation Model (It’s free) >>>
Value Any Stock in Under 60 Seconds with TIKR
With TIKR’s new Valuation Model tool, you can estimate a stock’s potential share price in under a minute.
All it takes is three simple inputs:
- Revenue Growth
- Operating Margins
- Exit P/E Multiple
If you’re not sure what to enter, TIKR automatically fills in each input using analysts’ consensus estimates, giving you a quick, reliable starting point.
From there, TIKR calculates the potential share price and total returns under Bull, Base, and Bear scenarios so you can quickly see whether a stock looks undervalued or overvalued.
See a stock’s true value in under 60 seconds (Free with TIKR) >>>
Looking for New Opportunities?
- Discover which stocks billionaire investors are purchasing, so you can follow the smart money.
- Analyze stocks in as little as 5 minutes with TIKR’s all-in-one, easy-to-use platform.
- The more rocks you overturn… the more opportunities you’ll uncover. Search 100K+ global stocks, global top investor holdings, and more with TIKR.
Disclaimer:
Please note that the articles on TIKR are not intended to serve as investment or financial advice from TIKR or our content team, nor are they recommendations to buy or sell any stocks. We create our content based on TIKR Terminal’s investment data and analysts’ estimates. Our analysis might not include recent company news or important updates. TIKR has no position in any stocks mentioned. Thank you for reading, and happy investing!