Key Takeaways:
- Record Earnings Beat: HCA Healthcare posted Q4 2025 adjusted EPS of $8.01, beating consensus by $0.55, while full-year net income rose 18% to $6.78 billion on $75.6 billion in revenue, marking 19 consecutive quarters of volume growth.
- ACA Headwind Quantified: HCA Healthcare faces a $600 million to $900 million adverse EBITDA impact in 2026 from expiring Enhanced Premium Tax Credits affecting the exchange segment, which represented 8% of admissions and 10% of revenue in 2025, partially offset by a $400 million resiliency program.
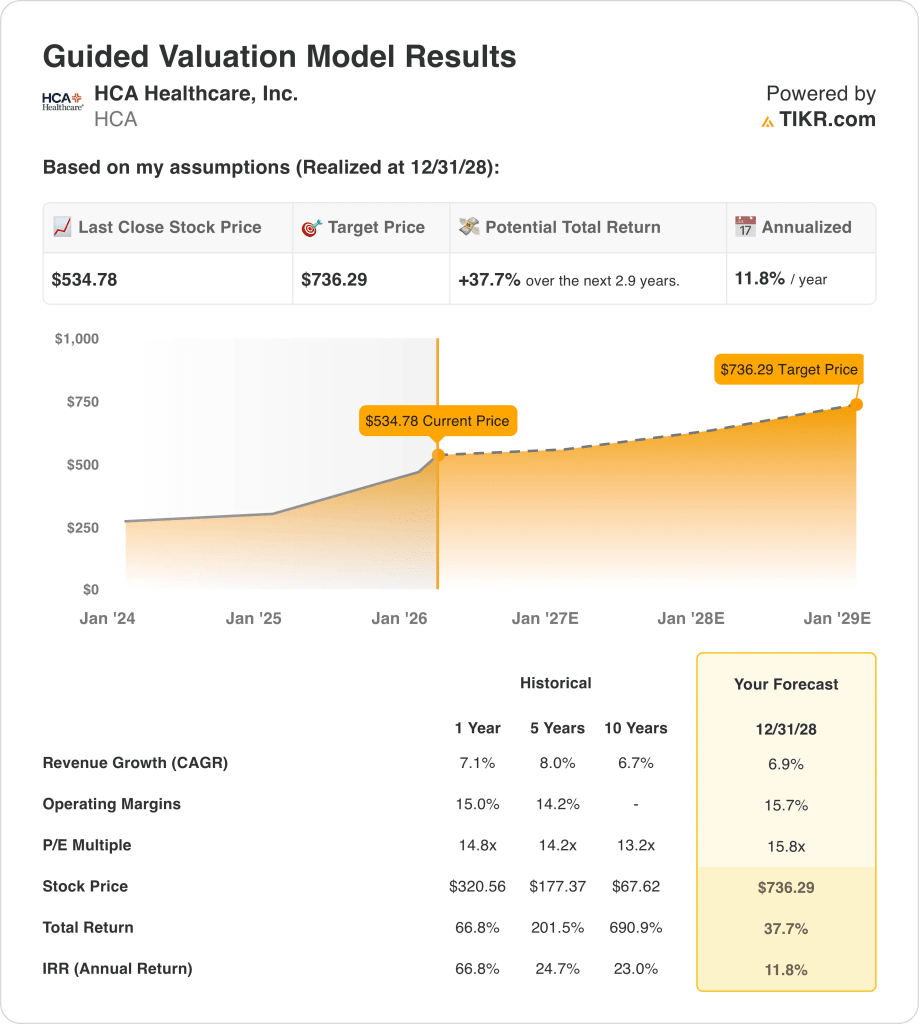
- Price Target: Based on 7% revenue growth, 16% operating margins, and a 15.8x exit multiple, HCA Healthcare stock could reach $736 by December 2028 from $535 today.
- Return Profile: HCA Healthcare implies 38% total upside from $535 to $736 over 2.9 years, equating to a 12% annualized return supported by a newly authorized $10 billion share repurchase program and a dividend increase from $0.72 to $0.78 per share.
Breaking Down the Case for HCA Healthcare, Inc.
Last January 27, HCA Healthcare (HCA) reported Q4 2025 adjusted EPS of $8.01, beating the $7.46 consensus by 7%, while authorizing a new $10 billion share repurchase program and lifting its quarterly dividend to $0.78 from $0.72, sending shares up 11% on the session.
Full-year 2025 revenue of $75.6 billion grew 7.1% on gross profit of $31.4 billion at 41.5% margins, with adjusted EBITDA expanding 12% to $15.6 billion, a 90 basis point margin improvement, on record patient encounters of 47 million.
Operating income of $11.97 billion at 15.8% margins reflected disciplined labor management, with salaries and benefits at 42.8% of Q4 revenues and contract labor holding at just 4.2% of total SWB heading into 2026.
CFO Mike Marks stated on the January Q4 2025 earnings call that “the resiliency plan is there to help us offset as much of the adverse impact of the exchange headwinds as possible,” underpinning $400 million in targeted 2026 cost savings across revenue integrity, labor efficiency, and AI-driven automation.
The company guided 2026 EPS to $29.10 to $31.50, above the $29.46 consensus, while absorbing a $250 million to $450 million decline in Medicaid supplemental payment net benefit, including a paused Texas program representing roughly one-third of that decline.
Capital expenditures are rising to $5.0 billion to $5.5 billion in 2026, funding nearly $7 billion of approved projects and a network already at 2,700 outpatient facilities targeting 18 to 20 per hospital by decade-end.
The investment tension centers on whether HCA executes its $400 million resiliency program to neutralize the $600 million to $900 million exchange headwind, against a backdrop of $535 current stock price, 15.8x exit P/E, and 12% projected annualized returns through December 2028 that require 7% revenue growth and 16% operating margins without Medicaid supplemental programs deteriorating further.
What the Model Says for HCA Stock
HCA’s $600 million to $900 million exchange headwind in 2026, affecting 8% of admissions and 10% of revenue, is partially offset by a $400 million resiliency program, leaving net earnings exposure that directly tests the model’s margin assumptions.
The model’s assumption of 6.9% revenue growth, 15.7% operating margins, and a 15.8x exit multiple produces a $736 target by December 2028, with margins modestly above the 15.8% fiscal 2025 actual and growth slightly below the 5-year 8% historical CAGR.
The market assumption for the forward P/E as of February 2026 stands at 17.65x, expanded from 12.60x at December 2024, meaning the stock already trades above the model’s 15.8x exit assumption and requires multiple compression over 2.9 years just to land at target.
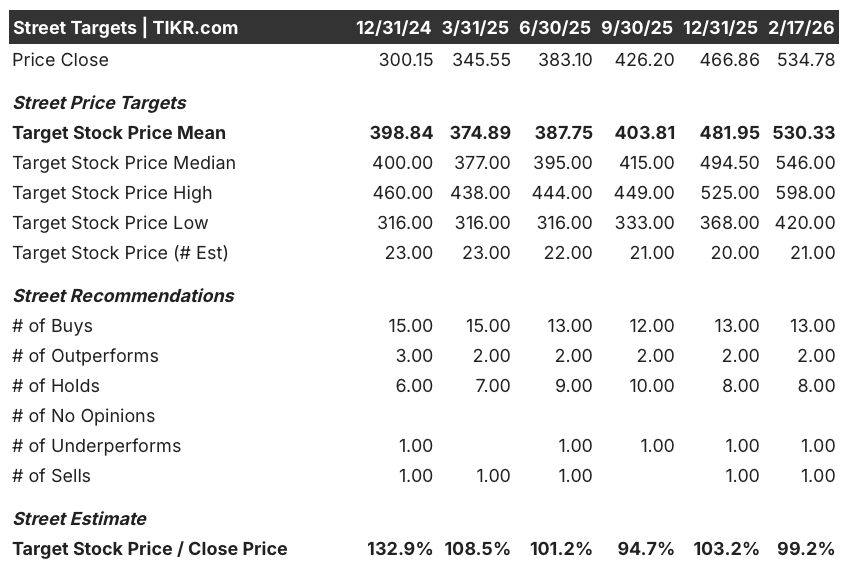
The street mean target of $530 as of February 2026 sits essentially at the current price of $534.78, with the target-to-price ratio compressing from 132.9% in December 2024 to just 99.2% today, as the analyst community of 13 Buys, 8 Holds, and 2 Sells signals the stock has largely priced in near-term fundamental strength with limited remaining upside on a 12-month basis.
The model delivers 37.7% total upside and an 11.8% annualized return from $534.78 to $736.29, sitting only 180 basis points above the 10% equity hurdle, while insider disposals by the CEO, CFO, and Controller in February 2026 reinforce the street’s own message that near-term appreciation from current levels is limited.
The model signals a Hold, as the 11.8% annualized return clears the 10% hurdle by too thin a margin, the street mean target of $530 offers no 12-month upside, and a market P/E already at 17.65x must compress to the model’s 15.8x exit while simultaneously absorbing exchange headwinds carrying a $300 million range of uncertainty.
Our Valuation Assumptions
TIKR’s Valuation Model lets you plug in your own assumptions for a company’s revenue growth, operating margins, and P/E multiple, and calculates the stock’s expected returns.
Here’s what we used for HCA Healthcare stock:
1. Revenue Growth: 6.9%
HCA Healthcare stock delivered 7.1% revenue growth in fiscal 2025 to $75.6 billion, as 19 consecutive quarters of volume growth and 47 million patient encounters drove consistent demand, yet the expiration of Enhanced Premium Tax Credits removes a structural exchange volume support that contributed 10% of 2025 revenue.
The fiscal 2026 revenue estimate of $78.68 billion reflects 4.1% consensus growth, below the model’s 6.9% assumption, as the $600 million to $900 million exchange headwind affecting 8% of admissions introduces a volume conversion gap that the $400 million resiliency program only partially offsets.
The model’s 6.9% assumption through December 2028 rests on equivalent admissions holding the 2% to 3% growth range, the resiliency program executing fully against exchange volume losses, and outpatient expansion toward 18 to 20 facilities per hospital absorbing displaced elective volume without payer mix deterioration.
Any failure in exchange volume containment, combined with Medicaid supplemental payment declines of $250 million to $450 million and physician cost pressures growing in the high single digits, compounds revenue shortfalls faster than the $10 billion buyback program can support earnings per share.
This sits below the 1-year revenue growth of 7.1%, as the exchange headwind and supplemental payment declines introduce structural volume pressure absent in 2025, and sustaining 6.9% through 2028 requires outpatient network expansion and resiliency execution to fully replace lost exchange-driven revenue.
2. Operating Margins: 15.7%
HCA Healthcare stock reported 15.8% operating margins in fiscal 2025 on $11.97 billion in operating income, as salaries and benefits held at 42.8% of Q4 revenues and contract labor stabilized at 4.2% of total workforce spend, marking a 90 basis point improvement over fiscal 2024.
The model’s 15.7% assumption sits marginally below fiscal 2025’s 15.8% actual level, consistent with the fiscal 2026 forward EBIT margin estimate of 15.7%, as the $400 million resiliency program offsets exchange headwinds but physician cost pressures growing in the high single digits create a structural ceiling on net margin improvement.
Reaching 15.7% through December 2028 requires labor costs to remain stable as a percentage of revenue, the Texas ATLIS Medicaid program to resume contribution after its administrative pause, and the resiliency program’s AI and automation initiatives to generate efficiencies at a pace consistent with management’s $400 million target.
Each 10 basis point operating margin shortfall on $75.6 billion of fiscal 2025 revenue represents $76 million in missed operating income, and any combination of exchange volume deterioration, supplemental payment declines at the high end of the $450 million range, and physician cost acceleration collapses margins toward the 3-year average of 15.3% faster than outpatient expansion can recover.
This sits below the 1-year operating margin of 15.8% from fiscal 2025, as the model embeds a modest compression to absorb known exchange and supplemental headwinds, and holding even 15.7% requires simultaneous resiliency execution and labor cost discipline without further Medicaid program deterioration.
3. Exit P/E Multiple: 15.8x
The 15.8x exit multiple capitalizes HCA Healthcare stock’s normalized net income at December 2028 under conditions of 6.9% revenue growth and 15.7% operating margins, treating the multiple as a terminal earnings anchor for a scaled hospital operator with 19 consecutive quarters of volume growth and $12.6 billion in annual operating cash flow.
The model already embeds 15.7% operating margin stability and 6.9% revenue growth through December 2028, meaning the 15.8x exit multiple does not require additional credit for AI-driven efficiency gains or network expansion, as both are absorbed in the earnings trajectory and a higher multiple would double-count execution already in the model.
The market assumption for the forward P/E as of February 2026 stands at 17.65x, expanded from 12.60x at December 2024, as the $10 billion buyback authorization, dividend increase to $0.78, and 11% post-earnings stock surge pushed investor willingness above 15x, and the model’s 15.8x exit sits below the current market assumption, requiring de-rating from today’s pricing to reach the target.
If exchange volume deterioration exceeds the high end of the $600 million to $900 million EBITDA impact range or supplemental payments decline beyond $450 million, earnings compression below the 15.7% margin assumption pushes the sustainable multiple toward the 5-year historical average of 14.2x rather than sustaining near 15.8x, collapsing the $736 target toward the $600 range.
This sits above the 1-year historical P/E of 14.8x, as the market has re-rated the stock on buyback momentum and earnings beat history, and sustaining 15.8x through December 2028 requires clean resiliency execution and margin stability while the market’s current 17.65x assumption must compress by nearly 2 full turns to land at target.
What Happens If Things Go Better or Worse?
HCA Healthcare stock outcomes through December 2030 rest on how effectively the company absorbs exchange volume losses, executes its resiliency program, and sustains Medicaid supplemental payment levels across three materially different operating environments.
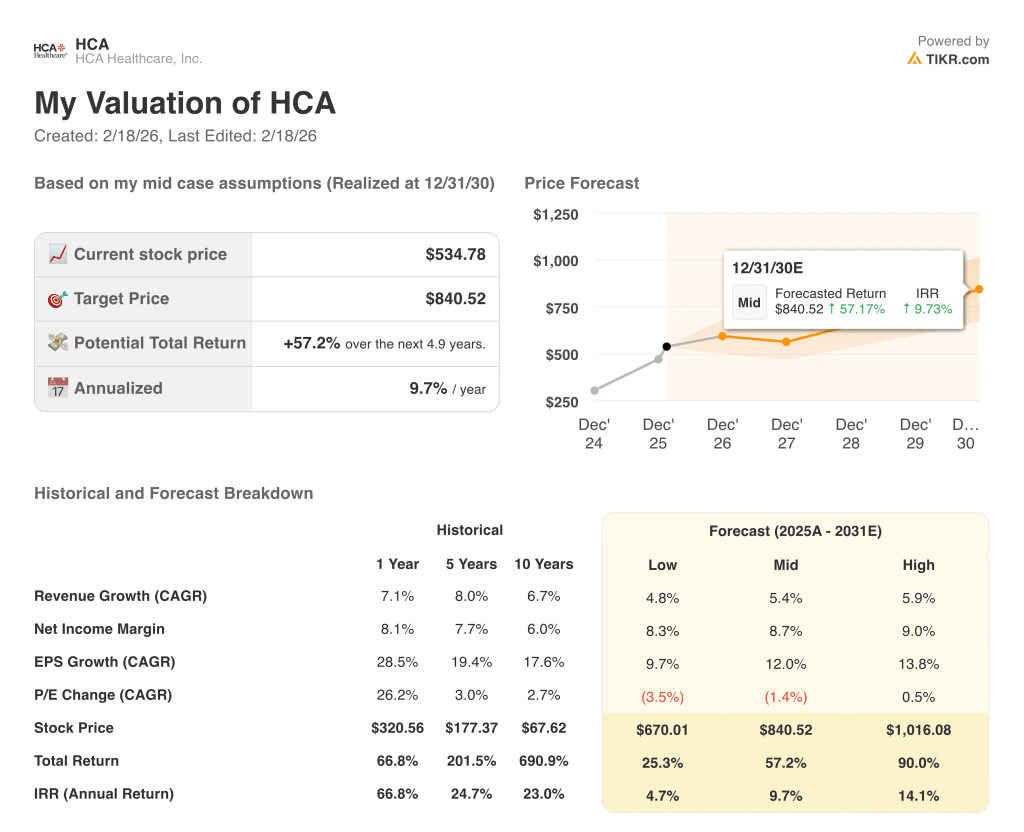
- Low Case: If exchange volume deterioration reaches the high end of the $900 million EBITDA impact range and supplemental payments decline fully, revenue grows around 4.8% and net income margins hold near 8.3% → 4.7% annualized return.
- Mid Case: With the $400 million resiliency program executing on schedule and exchange losses contained near the midpoint, revenue grows near 5.4% and net income margins improve toward 8.7% → 9.7% annualized return.
- High Case: If exchange headwinds prove manageable at the low end of estimates and AI-driven operational efficiencies accelerate beyond the resiliency target, revenue reaches about 5.9% and net income margins approach 9.0% → 14.1% annualized return.
How Much Upside Does HCA Healthcare Stock Have From Here?
With TIKR’s new Valuation Model tool, you can estimate a stock’s potential share price in under a minute.
All it takes is three simple inputs:
- Revenue Growth
- Operating Margins
- Exit P/E multiple
If you’re not sure what to enter, TIKR automatically fills in each input using analysts’ consensus estimates, giving you a quick, reliable starting point.
From there, TIKR calculates the potential share price and total returns under Bull, Base, and Bear scenarios so you can quickly see whether a stock looks undervalued or overvalued.
Looking for New Opportunities?
- See what stocks billionaire investors are buying so you can follow the smart money.
- Analyze stocks in as little as 5 minutes with TIKR’s all-in-one, easy-to-use platform.
- The more rocks you overturn… the more opportunities you’ll uncover. Search 100K+ global stocks, global top investor holdings, and more with TIKR.
Disclaimer:
Please note that the articles on TIKR are not intended to serve as investment or financial advice from TIKR or our content team, nor are they recommendations to buy or sell any stocks. We create our content based on TIKR Terminal’s investment data and analysts’ estimates. Our analysis might not include recent company news or important updates. TIKR has no position in any stocks mentioned. Thank you for reading, and happy investing!