Key Takeaways
- Kimberly-Clark and Procter & Gamble have raised their dividends for 54 and 70 straight years, and yield about 5.3% and 3.0%.
- Kimberly-Clark’s cash dividend payout ratio is a stretched 92% over the last twelve months, and its dividend took more than all of its free cash flow in 2025. P&G’s ratio is a steadier 68%.
- Kimberly-Clark’s pending $48.7 billion Kenvue deal would nearly double its yearly dividend bill, to about $3.1 billion, and roughly triple its debt.
- Both companies’ raises are slowing, to 1.6% at Kimberly-Clark and 3% at P&G, and the EU’s decision on Kenvue is due by Oct. 13.
Kimberly-Clark (KMB) likes to remind shareholders that it “has paid a dividend for 92 consecutive years, and this represents the 54th consecutive year that the company has increased its dividend to shareholders.”
Procter & Gamble (PG) can top that. It has 70 straight years of raises, for shareowners it says “rely on the steady, reliable income earned with their investment in P&G.”
Both are Dividend Kings, with more than 50 straight years of dividend increases. And both are selling to consumers who, as Kimberly-Clark CEO Mike Hsu put it, “are clearly under increased pressure.”
Only Kimberly-Clark, though, is about to close a roughly $48.7 billion acquisition of Kenvue (KVUE). It expects the deal to close in the fourth quarter, and the EU’s decision is due by Oct. 13.
So which of these dividends is actually covered with room to spare?
| Metric | Kimberly-Clark (KMB) | Procter & Gamble (PG) |
|---|---|---|
| Forward dividend yield | 5.3% | 3.0% |
| 5-yr dividend growth | 3.3% a year | 5.6% a year |
| Streak of raises | 54 years | 70 years |
| Latest raise | 1.6% (Jan. 2026) | 3% (April 2026) |
| Cash dividend payout ratio, TTM | 92% | 68% |
| Net debt ÷ EBITDA, TTM | 1.49x | 1.00x |
| Interest coverage, TTM | 12.2x | 24.6x |
Source: TIKR, prices at the Sept. 29, 2026 close. Streaks and raises come from the companies’ releases.
See historical and forward estimates for Kimberly-Clark stock (It’s free!) >>>
What pays for Kimberly-Clark’s 5.3%
Kimberly-Clark’s sales aren’t moving much. Organic sales slipped 0.1% in the second quarter, and in August, the company cut its 2026 outlook to high-single-digit adjusted EPS growth from double digits.
The dividend is putting even more pressure on cash flow. Dividends consumed 92% of free cash flow over the last twelve months. In 2025, Kimberly-Clark paid out more in dividends than it generated in free cash flow.

Free cash flow cleared the dividend for nine straight years, and in 2025 the bars crossed. That’s not a great look for a Dividend King, if you ask me.
Part of the squeeze is capex. Spending is running above its usual 4% to 5% of sales, with $1.1 billion spent in 2025 and about $1.3 billion planned for 2026, as Kimberly-Clark funds a $2 billion North American supply-chain overhaul. The figures above also include the tissue business it sold 51% of on July 1.
Then there’s Kenvue. At closing, Kimberly-Clark issues about 281 million new shares, taking its count to about 613 million. At today’s $1.28 a quarter, that lifts its yearly dividend bill from about $1.7 billion to about $3.1 billion. Kenvue brings about $1.9 billion of free cash flow a year, but it paid about $1.6 billion of dividends itself. Debt also goes to about $19.7 billion pro forma, up from $6.5 billion.
After closing, the dividend is the board’s call. (Every Kimberly-Clark ratio in this piece describes the company before the deal.)
What pays for P&G’s 3%
P&G sells to the same squeezed shopper. For fiscal 2026 (the year to June), organic sales grew 1%, entirely on price, while volume and mix held flat. Core EPS also rose 1%, to $6.89.
Its dividend, though, rests on far more cash. P&G paid out $10.23 billion in dividends against $15.15 billion of free cash flow, a 68% cash dividend payout ratio…
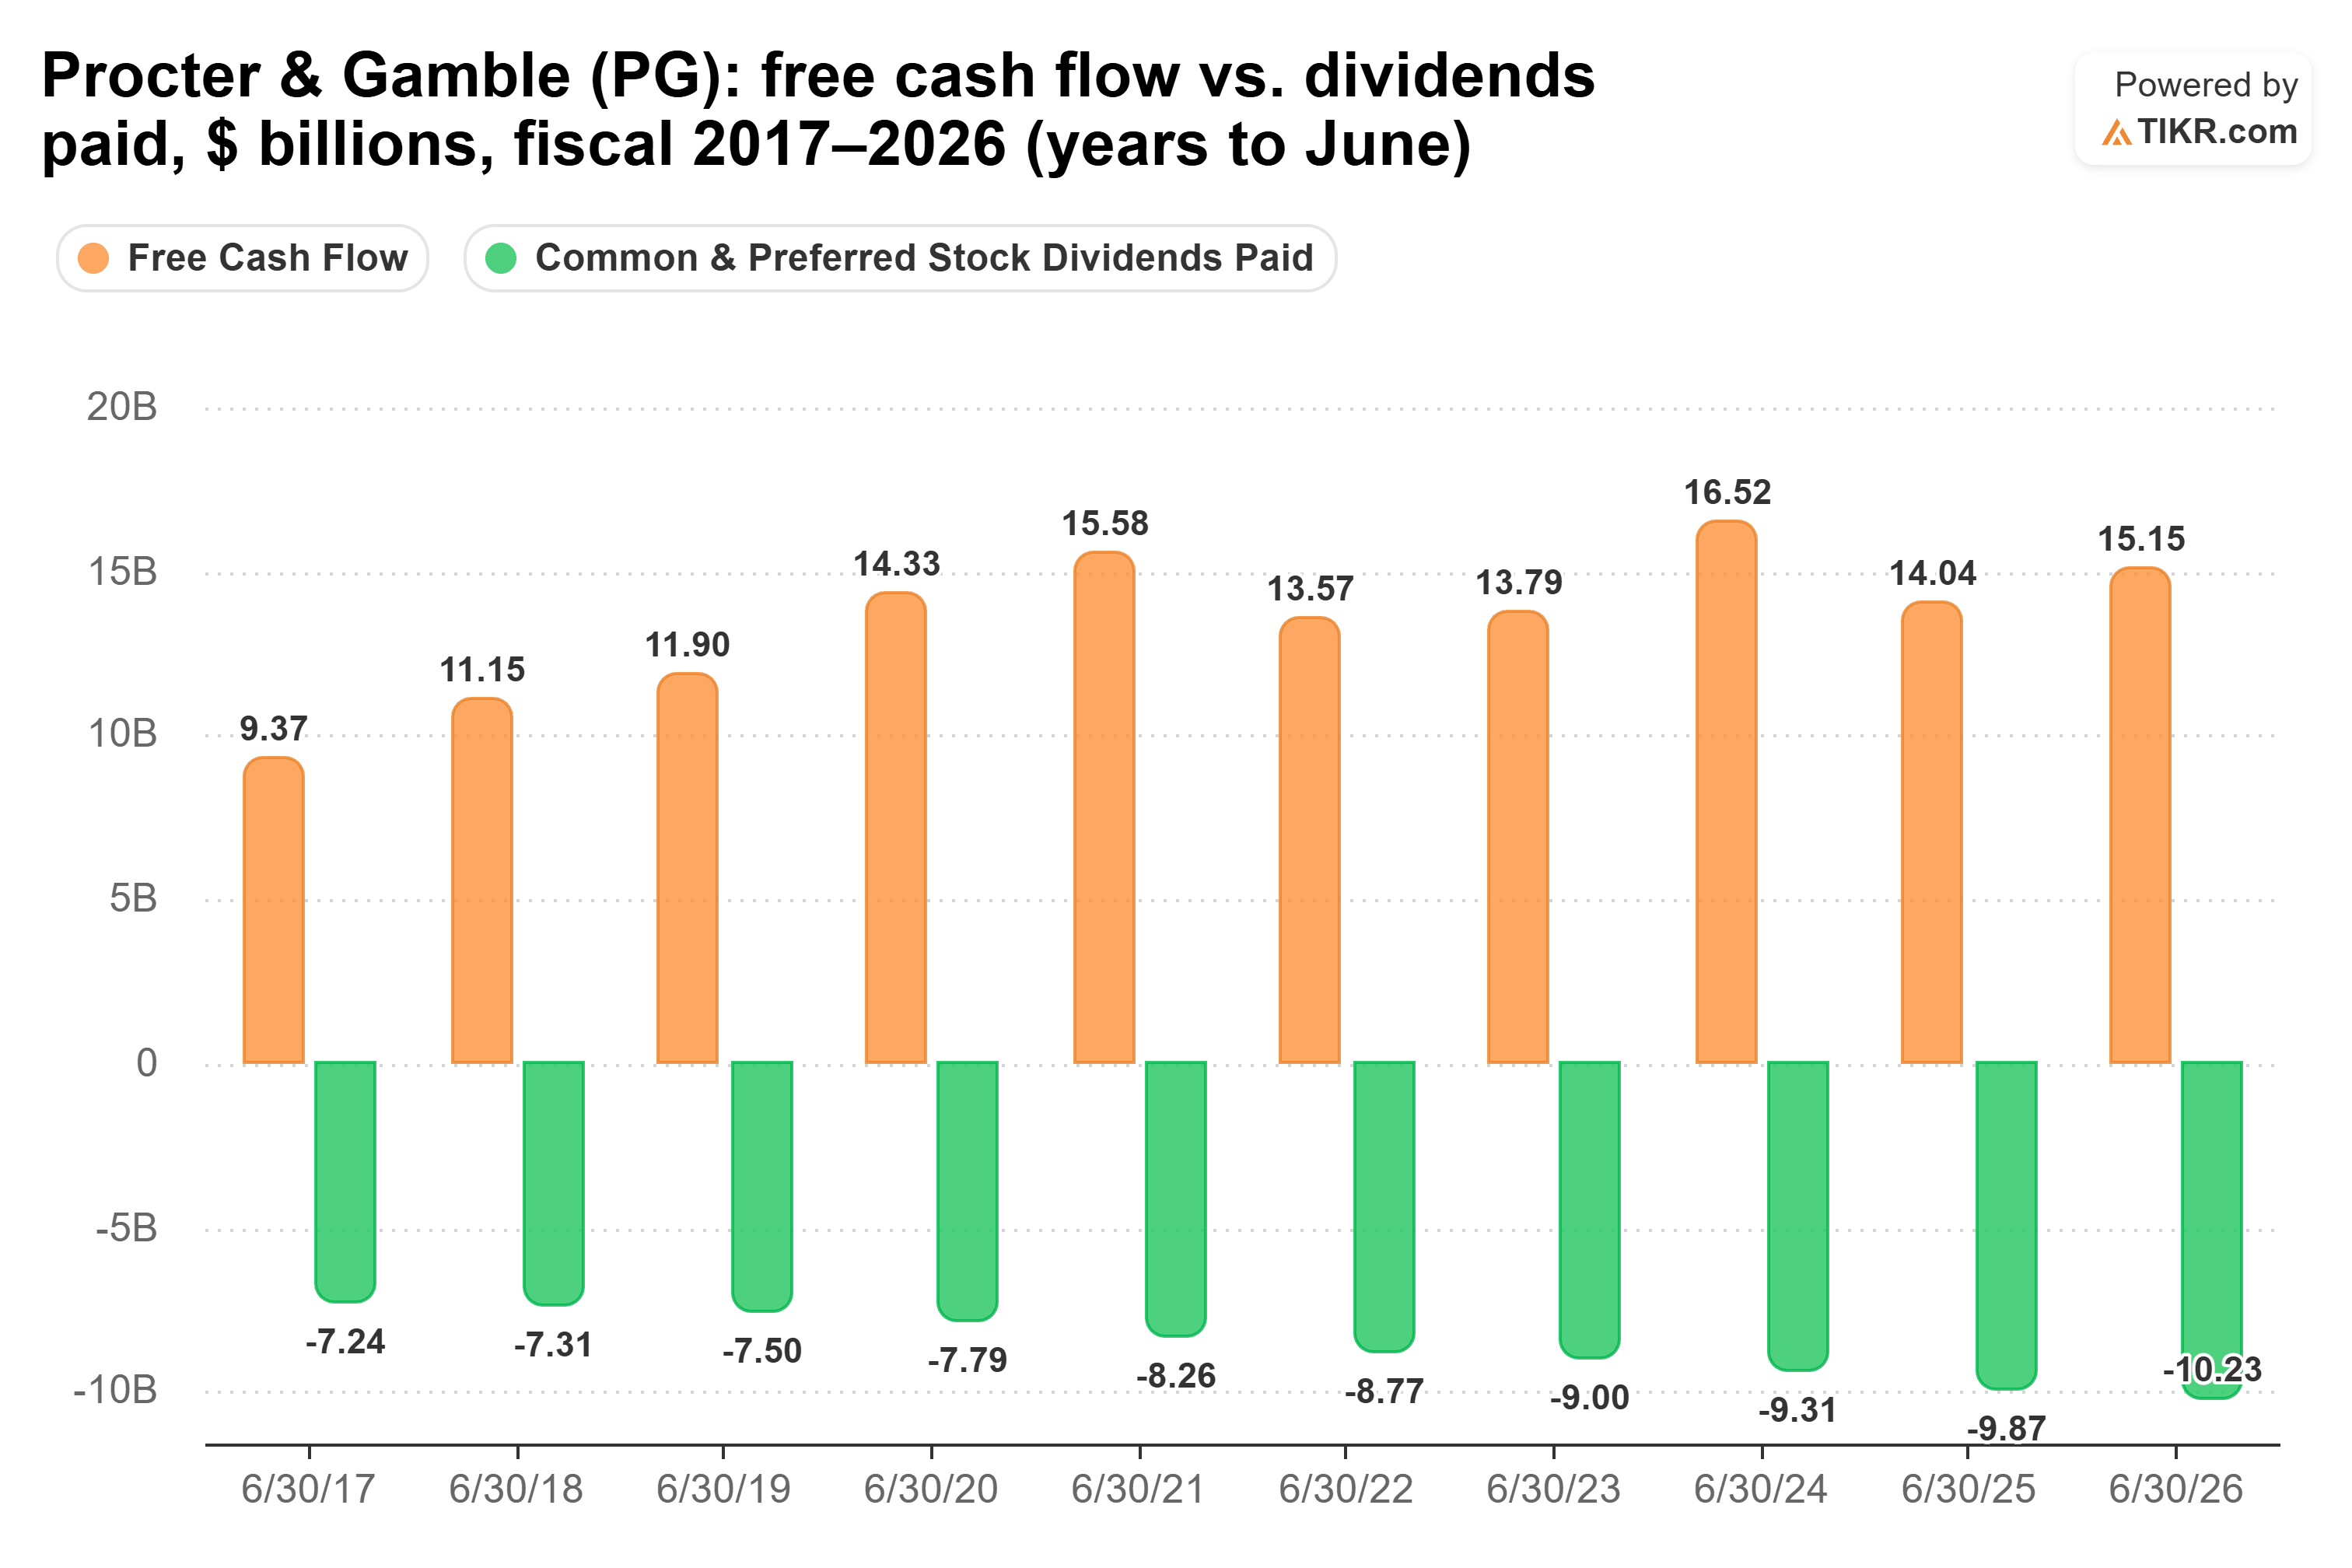
Free cash flow covered the dividend every year for the past decade, and that cushion has more than doubled to $4.92 billion. That’s the kind of breathing room I want in a dividend stock.
P&G has been using much of that excess cash for buybacks, spending $5.03 billion over the last 12 months versus just $21 million at Kimberly-Clark. For fiscal 2027, CFO Andre Schulten expects more than $10 billion in dividends and roughly $5 billion in buybacks.
The 3% raise in April was P&G’s smallest in six years. The bigger concern is where future growth comes from, since price increases are doing the heavy lifting. Management also expects about $1 billion in additional after-tax costs tied to the Middle East conflict and sees core EPS growing just 0% to 3% in fiscal 2027.
See how P&G performs against its peers in TIKR (It’s free!) >>>
So which dividend wins?
For me, P&G gets the nod here because its dividend has much more room around it. The company pays out 68% of free cash flow, versus 92% for Kimberly-Clark. P&G also spends about $5 billion a year on buybacks, giving management plenty of room to pull back on repurchases before the dividend ever comes under pressure.
That doesn’t mean Kimberly-Clark’s dividend is headed for trouble. The dividend is still growing, and some of the pressure comes from a major capex program. CFO Nelson Urdaneta also said in January that the company would “grow our dividend payout to shareholders” alongside that spending. And with a 5.3% yield, you’re getting paid well to wait.
Still, I have a hard time ignoring the difference in coverage. P&G generates nearly $5 billion more in free cash flow than it needs to cover the dividend. I’d rather own that cushion than a dividend whose annual cost is about to nearly double.
There is a path for Kimberly-Clark to close that gap. If the promised $1.9 billion in Kenvue cost savings arrive on schedule, dividend coverage could look much healthier a few years from now.
So what is Procter & Gamble stock actually worth?
TIKR lets you forecast the future price of any stock in less than a minute. Just enter a few assumptions into TIKR’s valuation model and see what Procter & Gamble could be worth. Start from Wall Street consensus estimates, or adjust the inputs to reflect your own view of the business. It’s free to use.
Value Procter & Gamble for free
Disclaimer:
Please note that the articles on TIKR are not intended to serve as investment or financial advice from TIKR or our content team, nor are they recommendations to buy or sell any stocks. We create our content based on TIKR Terminal’s investment data and analysts’ estimates. Our analysis might not include recent company news or important updates. TIKR has no position in any of the stocks mentioned. Thank you for reading, and happy investing!