Most beginners think analyzing a stock requires an MBA, a couple of hours, and years of financial experience. The truth is simpler: you need to know what questions to ask, where to find the answers, and how to connect a few key data points into a coherent picture. The barrier to entry for you is knowing where to start and having access to the right information in a format that makes sense.
The problem most new investors face isn’t a lack of resources. It’s too many resources scattered across too many platforms.
Yahoo Finance for price charts. EDGAR for filings. Google for news. Reddit for sentiment. Each source gives you fragments, but none of them gives you the complete story in one place. Without structure, you end up overwhelmed, confused, or worse, making decisions based on incomplete information.
Professional analysts don’t work this way. They start with a framework, a repeatable process that lets them evaluate any business consistently and efficiently.
This guide takes a different approach. Instead of walking through generic steps, we’ll show you exactly what to look at to analyze a stock using TIKR as your single source of truth.
You’ll see how to navigate from a company overview to financial health to valuation without needing a finance degree or multiple browser tabs. By the end, you’ll have a clear template you can apply to any stock, turning analysis from an intimidating task into a manageable routine.
Why Most Beginners Get Stuck (And How to Avoid It)
New investors often start by Googling “how to analyze stocks” and encounter terms such as discounted cash flow models, enterprise value, and weighted average cost of capital.
It’s not that these concepts aren’t useful, but they’re not where you should start. Trying to build a DCF model before you understand how a company makes money is like trying to run before you can walk.
The real reason beginners struggle isn’t complexity, but a lack of context. You read that a stock has a P/E ratio of 20, but you don’t know if that’s cheap, expensive, or normal for the industry.
You see revenue growth of 15%, but you don’t know how profitable the company is. You hear that insiders are selling, but you don’t know if it’s routine diversification or a red flag.
What professionals do differently is that they ask basic questions first and use data to answer them systematically. Is the business growing? Is it profitable? Does it generate cash? How does it compare to competitors? Is the stock cheap or expensive relative to its own history?
These aren’t advanced questions. They’re foundational. And once you know where to find the answers, stock analysis becomes surprisingly straightforward.
Start by Opening a Stock’s Company Overview Page
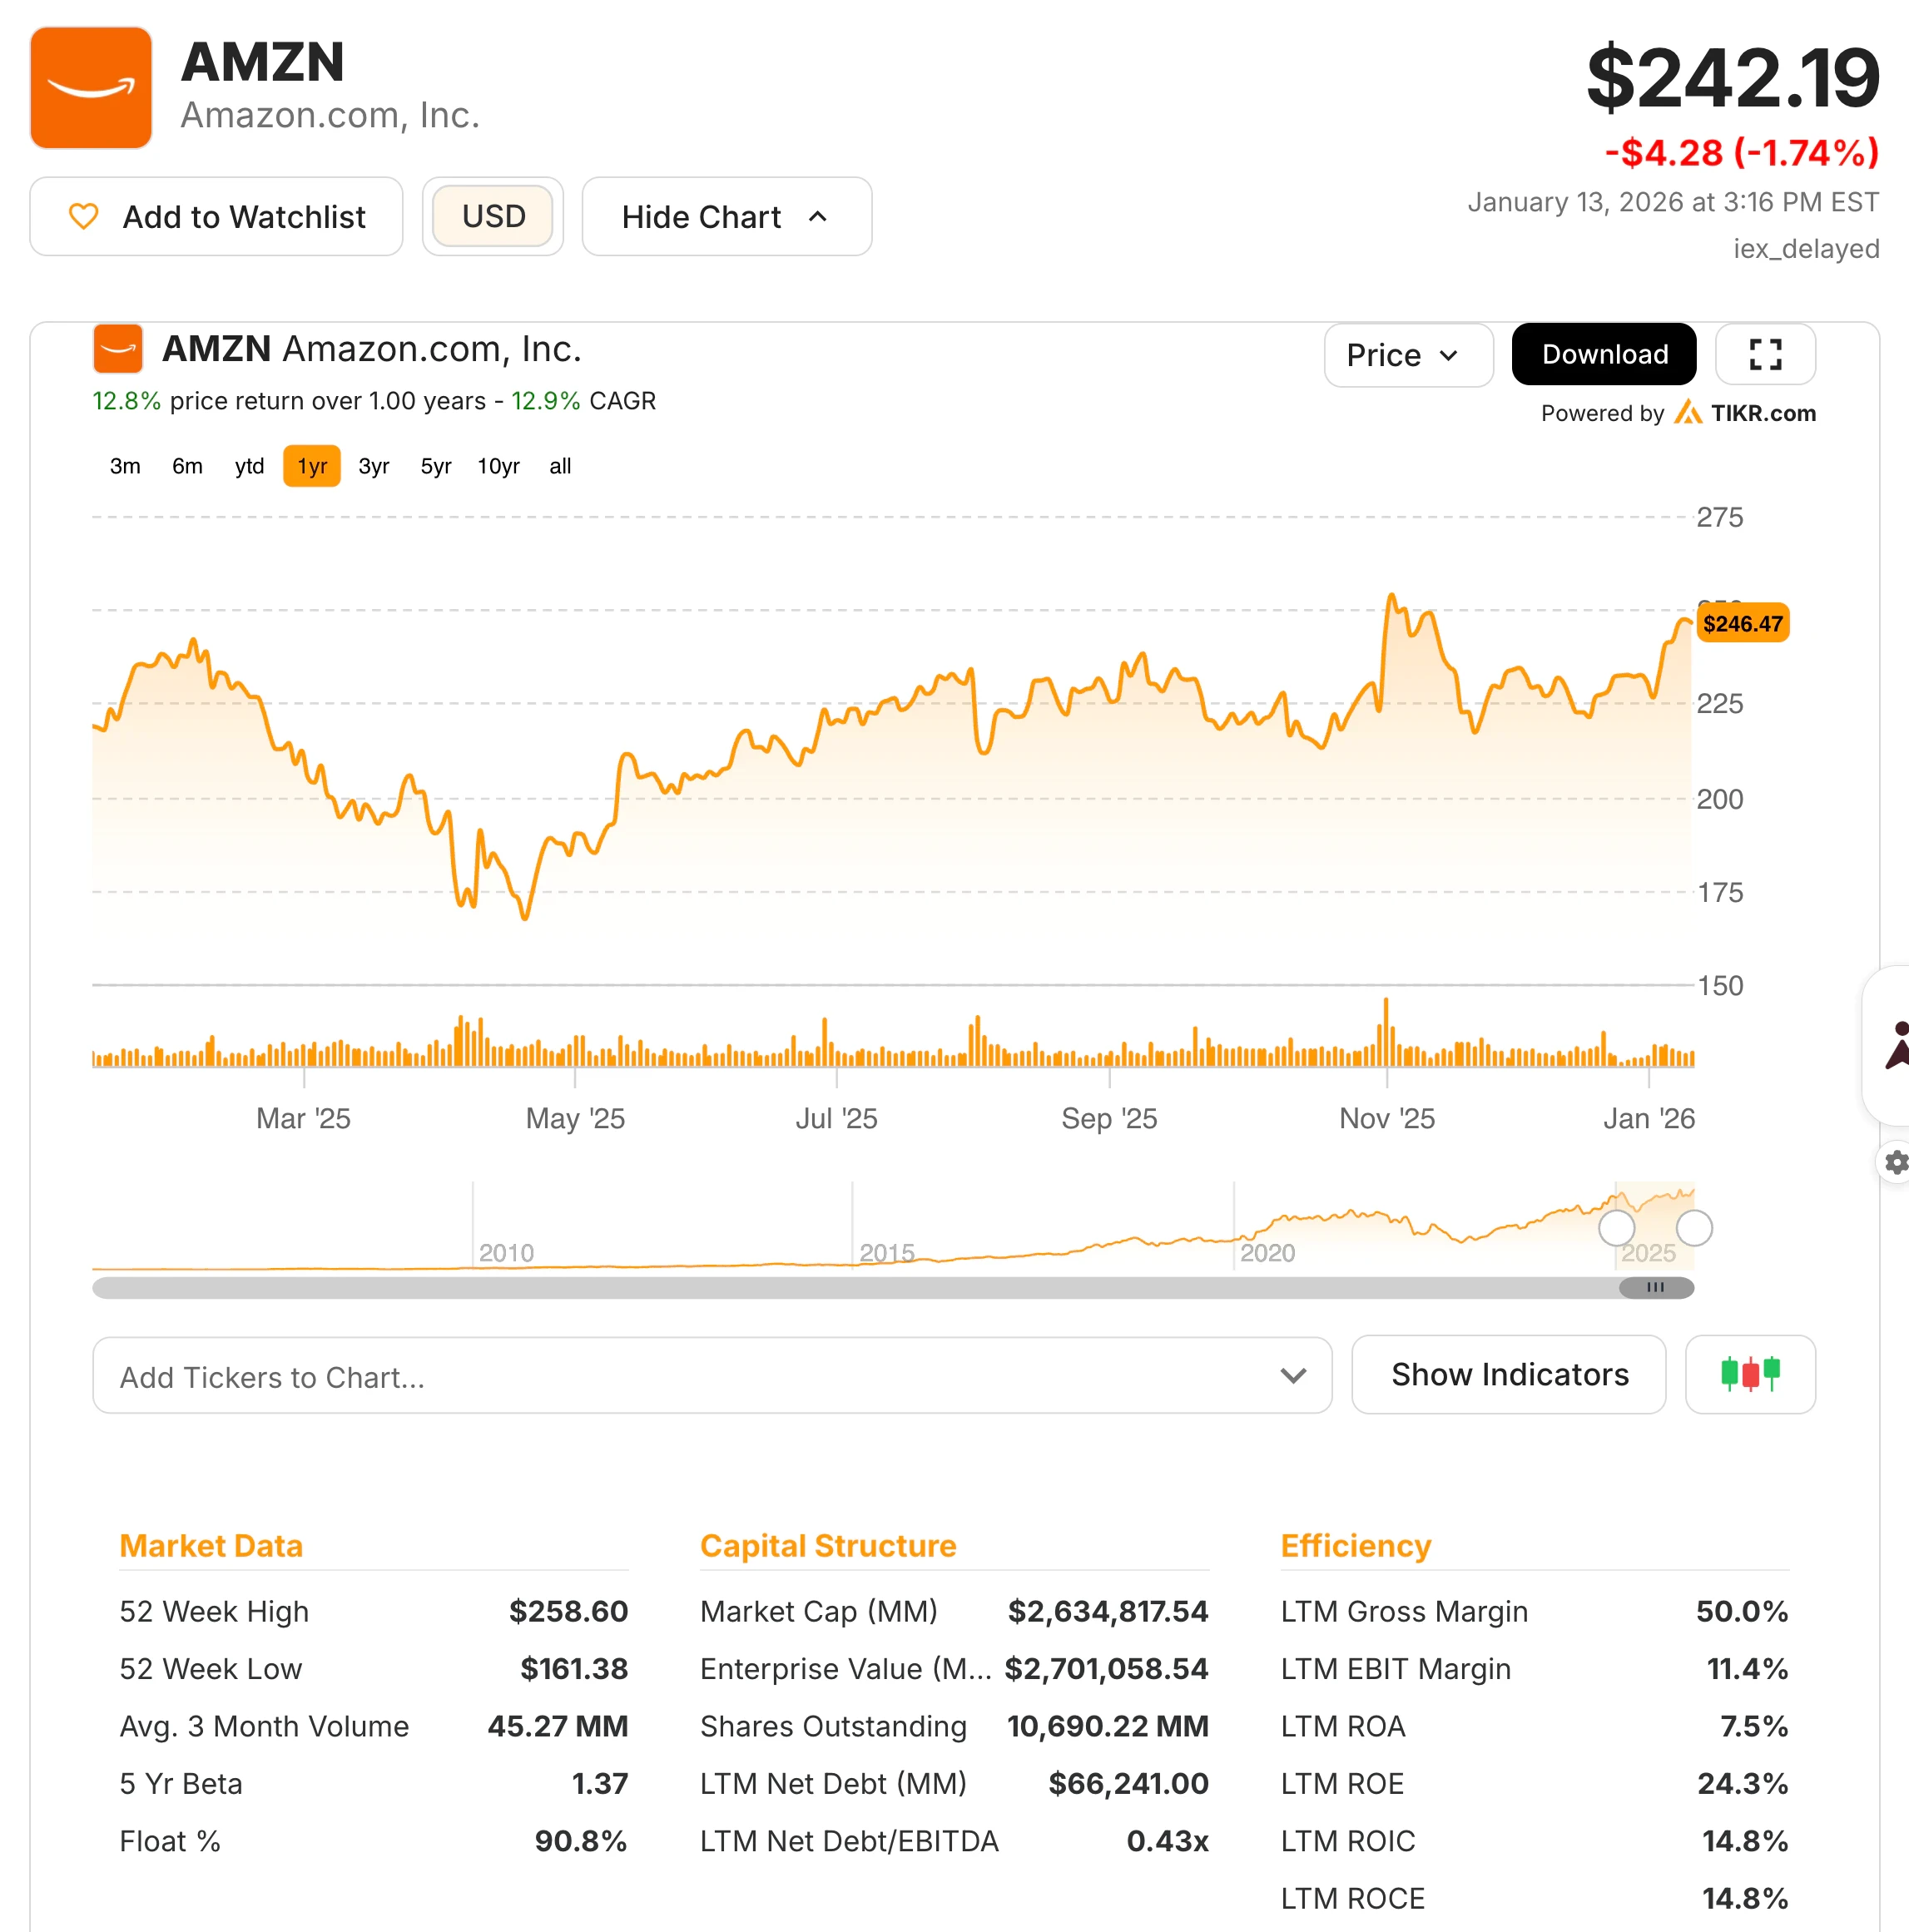
Log in to TIKR and search for any company by name or ticker. You’ll land on the Overview page, which provides an essential snapshot: current stock price, market cap, 52-week range, and a brief business description. Read the description first.
Before you look at any numbers, make sure you understand what the company actually does, who its customers are, and how it makes money.
Value any stock in less than 60 seconds with TIKR’s new Valuation Model (It’s free) >>>
This might sound obvious, but it’s the step most beginners skip. You can’t evaluate whether a business is strong if you don’t know what business it’s in. Spend two minutes here.
If you can’t explain the company’s core product or service in one sentence, you’re not ready to analyze its financials yet.
Next, Check If the Stock Is Growing

Click into the Detailed Financials tab and open the Income Statement. In the Revenue row, drag the timeline slider to view the past three to five years. Is revenue increasing, staying flat, or decreasing?
You don’t need to calculate growth rates manually. TIKR shows year-over-year numbers, so you can instantly see the trend.
Growing revenue is the foundation of almost every good investment. It means customers want what the company sells. Flat revenue might mean a mature business, which is fine if it’s profitable and returns cash to shareholders. Declining revenue is a warning sign unless there’s a clear strategic reason, such as a planned divestiture or a business model shift.
While you’re here, click on any row in the income statement to generate an instant chart. This visualization makes trends easier to spot than staring at raw numbers. If revenue is growing but you see it decelerating, that’s important context.
Get the most up-to-date financial snapshots of thousands of stocks with TIKR (It’s free) >>>
Now See If It’s Profitable
Scroll down the same Income Statement view to look at Operating Income and Net Income. Are they positive? Are they growing in line with revenue, faster than revenue, or slower?
If revenue is up 20% but net income is flat or down, the company might be struggling with costs, competition, or pricing pressure.

Also check the margins. TIKR displays Gross Margin, Operating Margin, and EBITDA Margin right in the income statement view. You don’t need to calculate them yourself. Just look at whether they’re stable, improving, or declining over time.
Improving margins usually means the business is getting more efficient or gaining pricing power. Declining margins can signal the opposite.
Don’t worry about memorizing what “good” margins look like in an absolute sense. Context matters more. A software company with 80% gross margins is normal. A retailer with 30% is normal. The key is whether margins are moving in the right direction relative to the company’s own history.
Run a competitor analysis on TIKR for the top stocks in your portfolio (It’s free) >>>
Verify Cash Flow
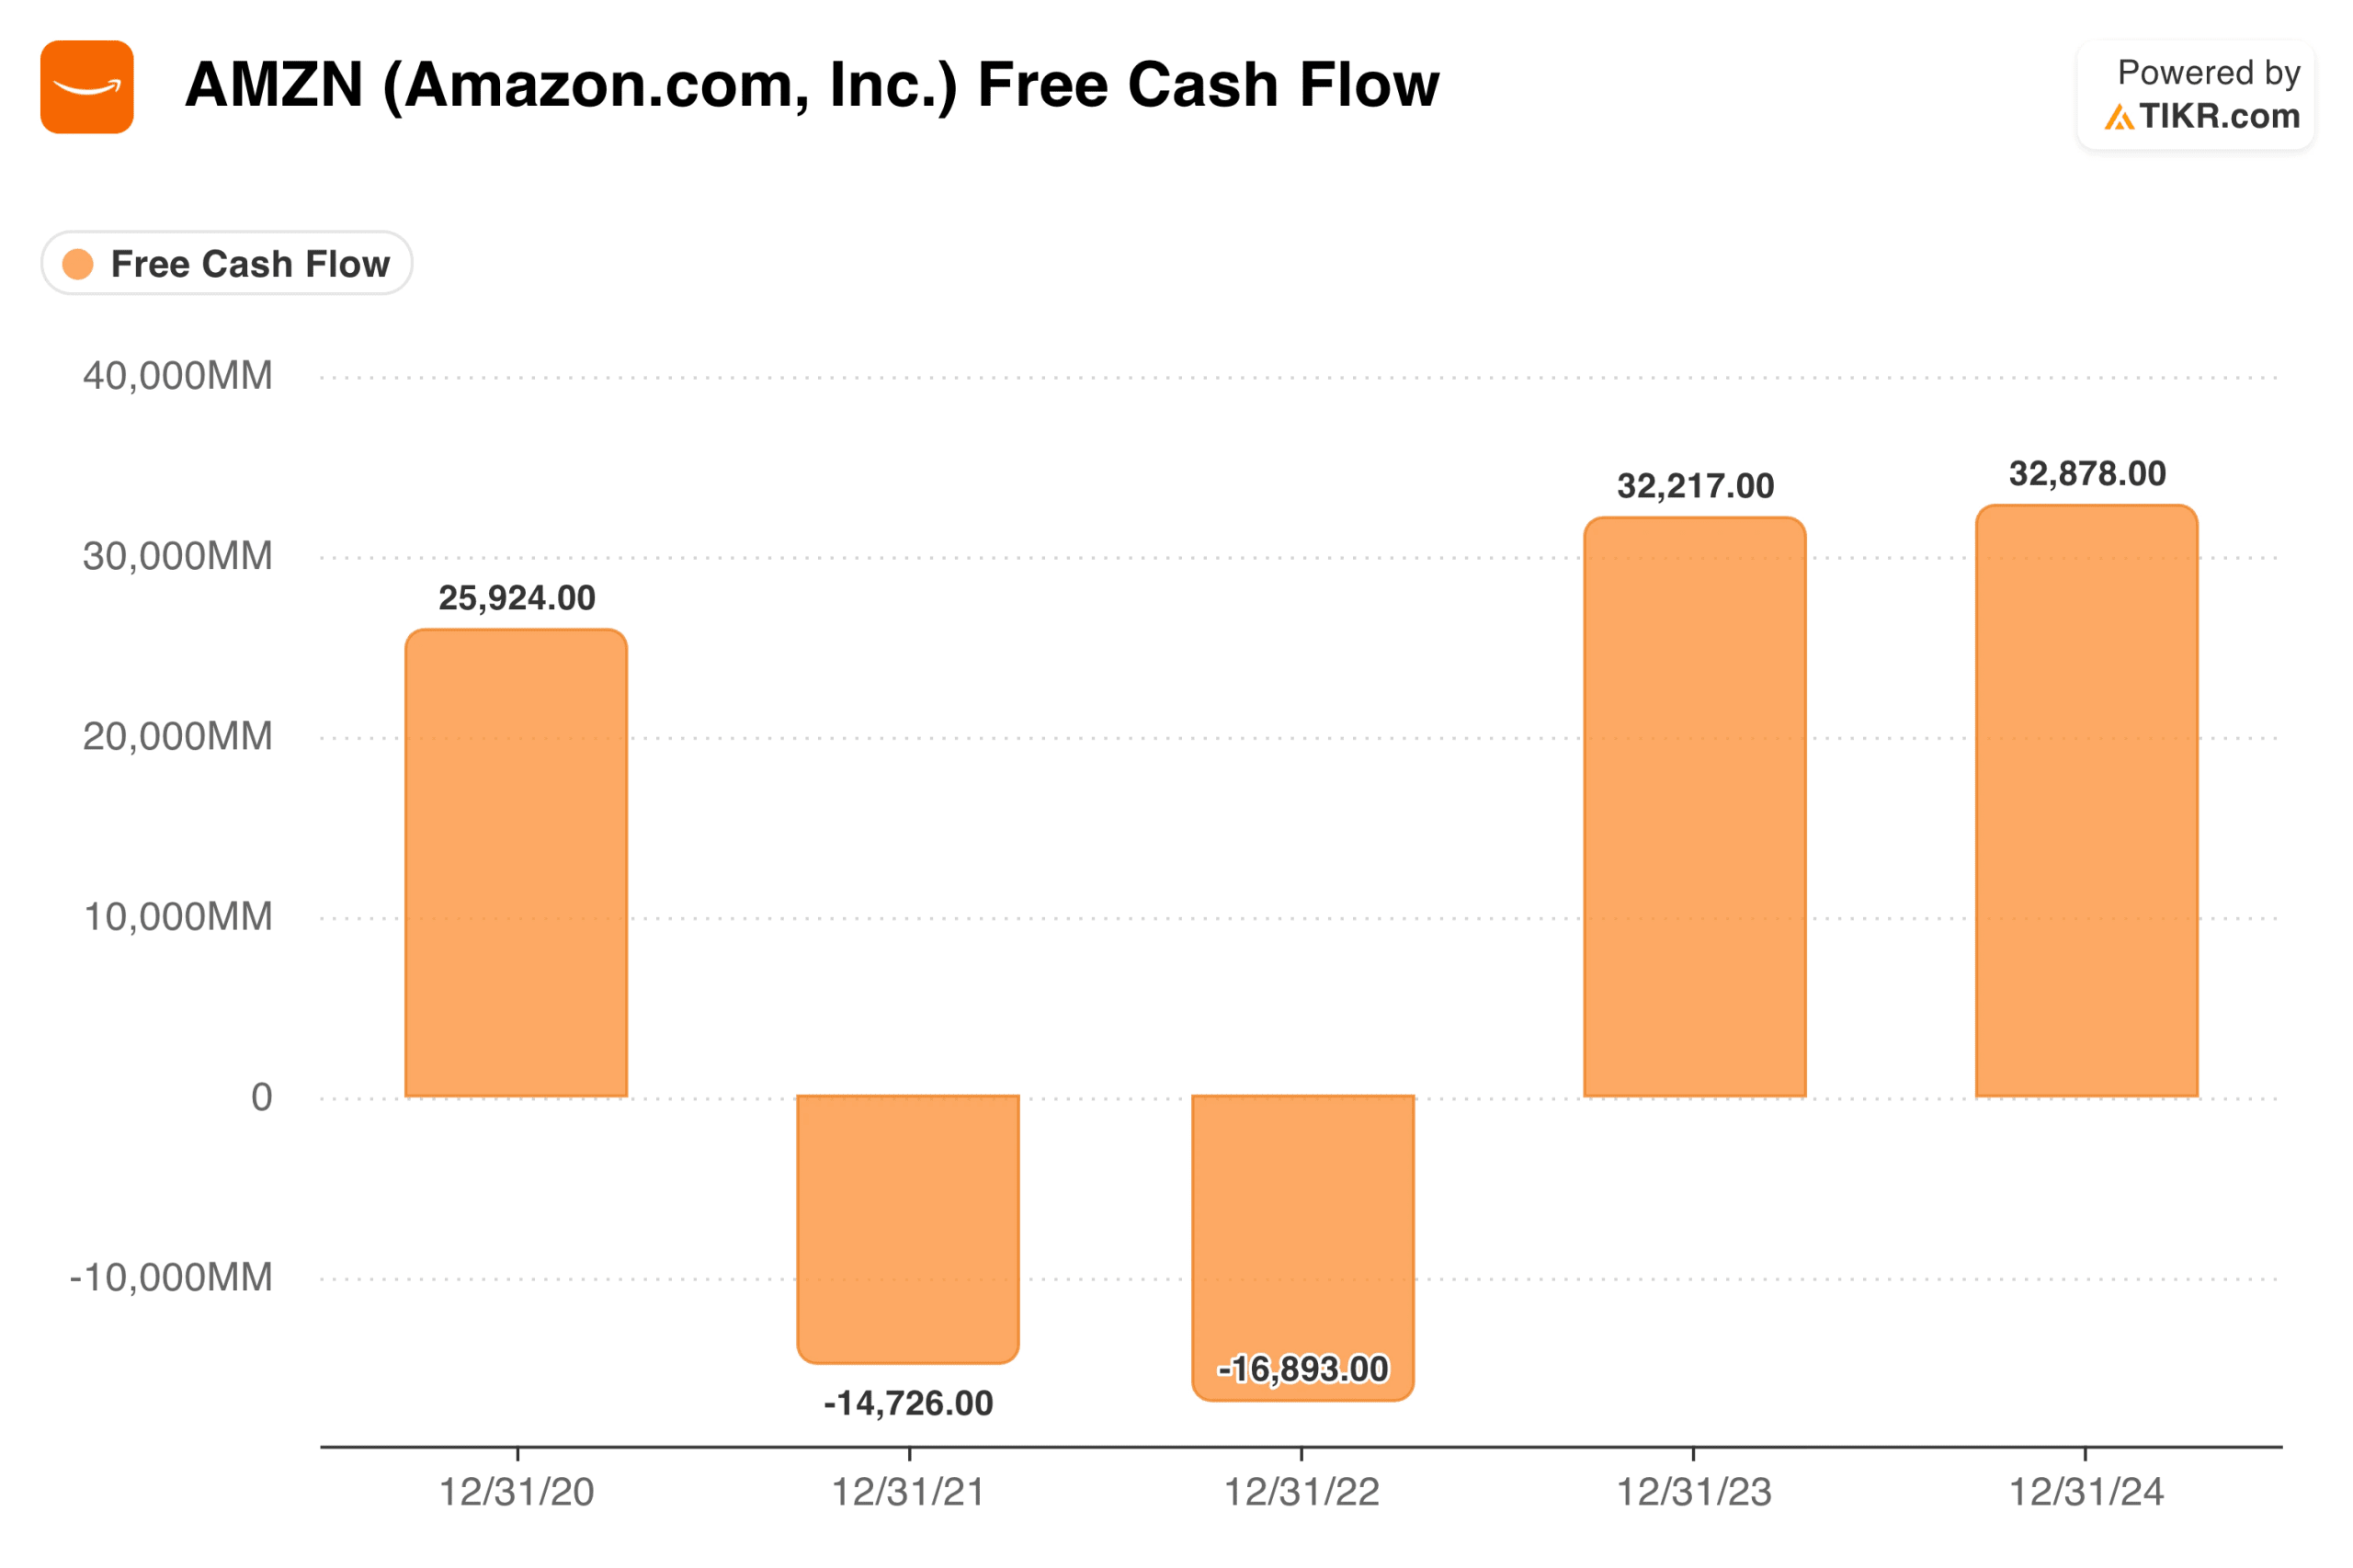
Profitability on paper is one thing. Cash generation is another. Switch to the Cash Flow Statement tab in TIKR.
Look at Free Cash Flow, is it positive? Is it growing over time? Does it roughly align with net income, or is there a big gap?
Cash flow matters because it’s harder to manipulate than earnings. A company can report accounting profits while burning cash due to aggressive revenue recognition, high capital expenditures, or working capital issues. Free cash flow is the amount of cash the business generates after paying for operations and capital expenditures.
If you see strong revenue and earnings but weak or negative free cash flow, dig deeper. It might be fine if the company is investing heavily in future growth. Or it might mean the business model doesn’t convert well to cash. TIKR’s multi-year view helps you quickly spot these patterns.
Quickly find cash flow information on stocks with TIKR (It’s free) >>>
Compare It to Peers
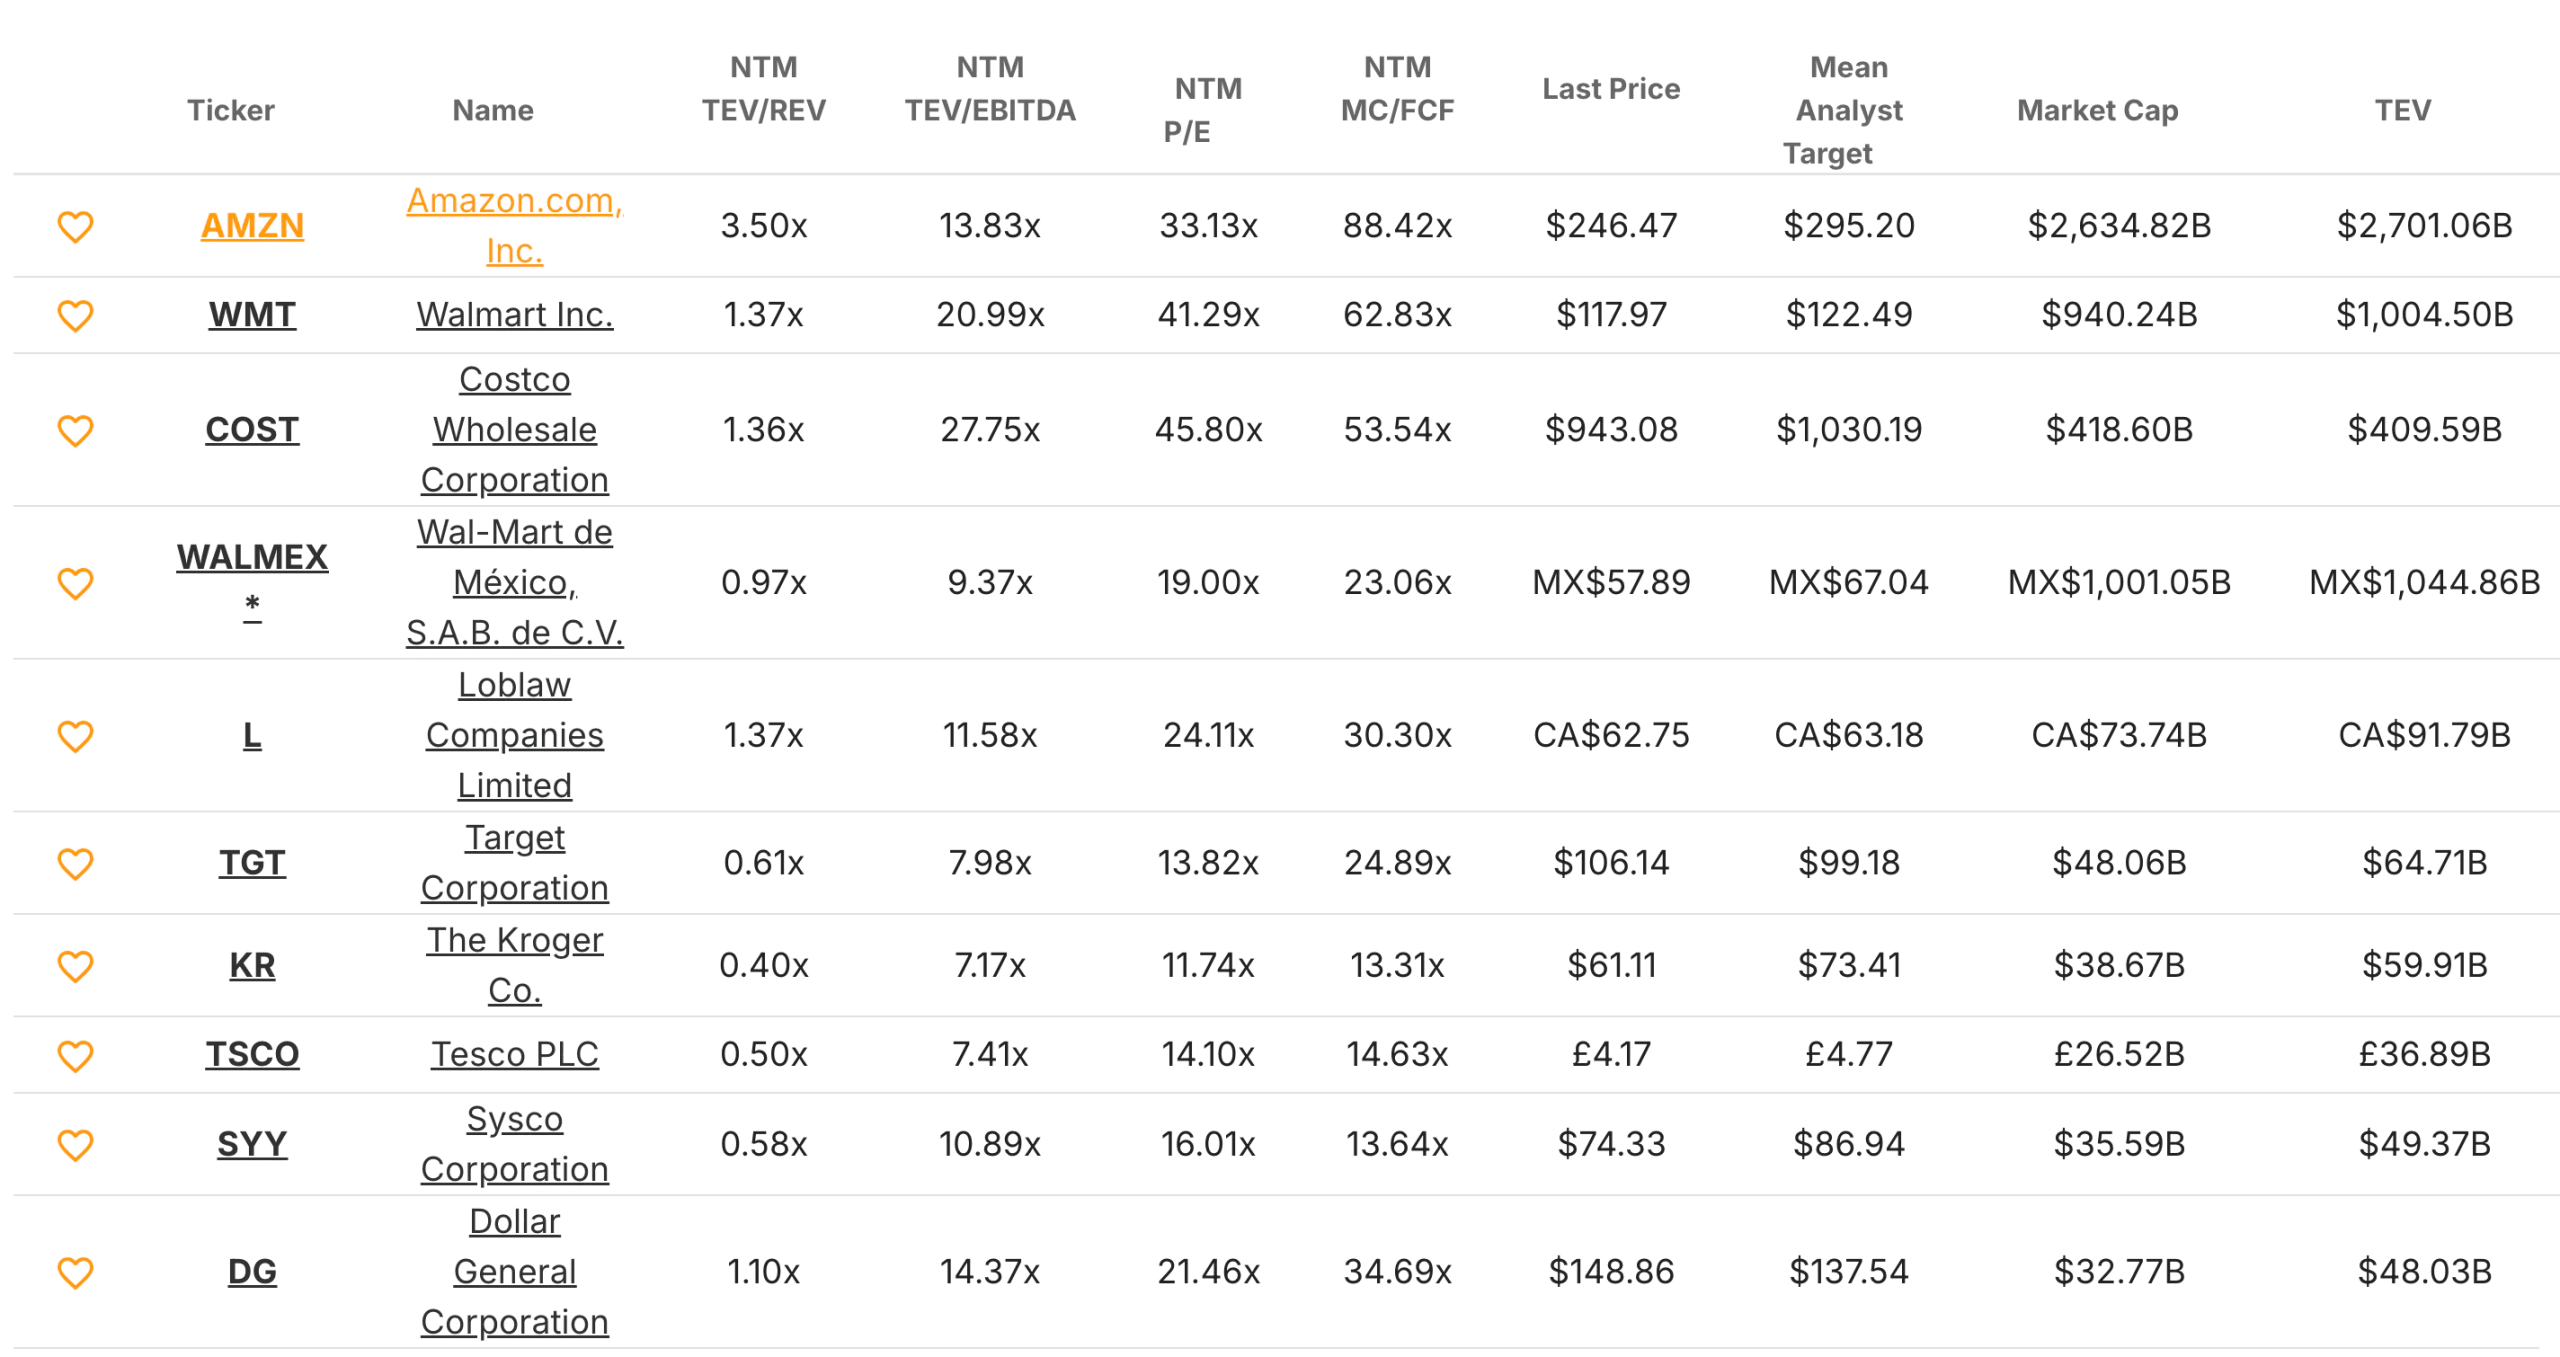
Now that you understand how the business is performing, assess how it compares to competitors. Click the Competitors tab, and TIKR automatically groups companies by sector and market cap.
Review the table and compare your stock’s valuation multiples (P/E, EV/EBITDA), revenue growth, profit margins, and return on capital with the peer group. You’ll see summary statistics at the bottom showing the mean and median across competitors. This instantly shows you whether your stock is expensive, cheap, or fairly valued relative to others in its space.
Don’t just focus on valuation. A stock might look cheap because it’s genuinely undervalued, or because it’s underperforming its peers. If your company has lower margins, slower growth, and weaker returns than competitors, a valuation discount makes sense.
If it has better fundamentals but trades at a similar or lower multiple, that could be an opportunity.
Look at the Valuation History
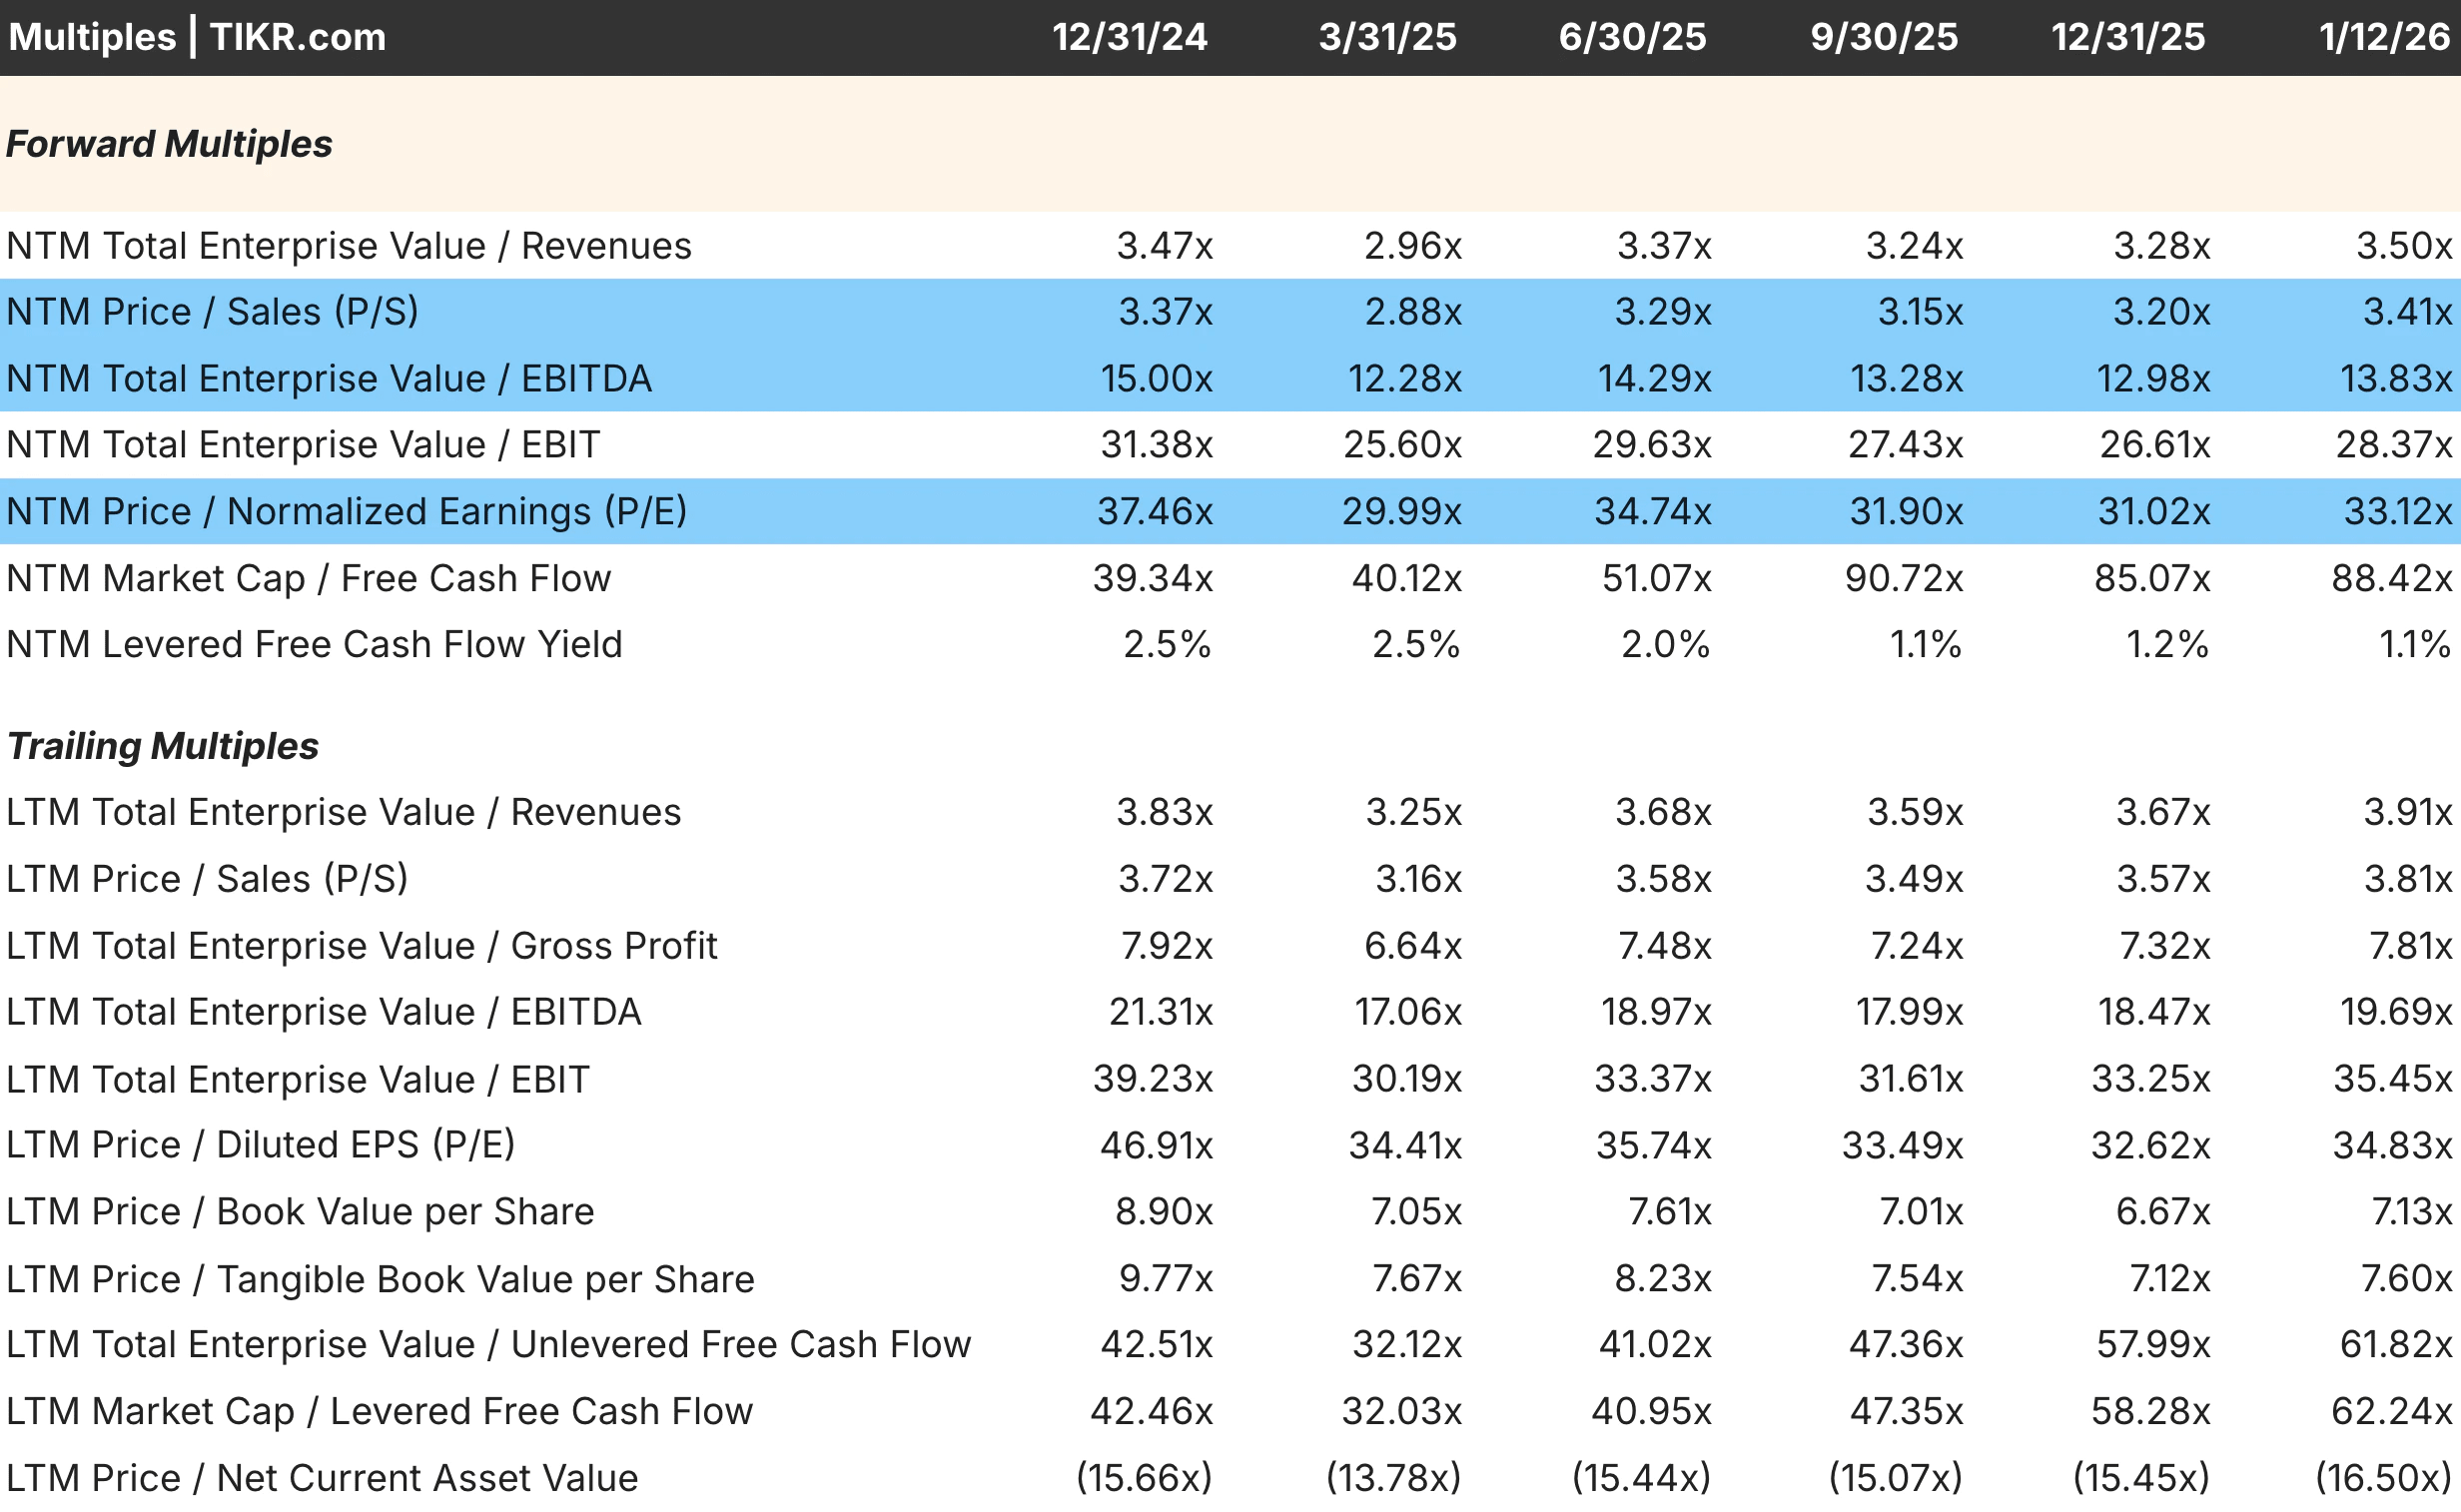
Switch to the Valuation tab in TIKR. Here you’ll see current and historical valuation multiples like P/E ratio, EV/EBITDA, and Price-to-Sales, along with charts showing how they’ve trended over three, five, or ten years.
This is where beginners often make mistakes. They see a stock trading at 25x earnings and assume it’s expensive, or 10x earnings and assume it’s cheap. But without historical context, those numbers are meaningless. If a stock typically trades at 30x and it’s now at 25x with stable fundamentals, it might be undervalued. If it typically trades at 8x and it’s now at 10x with deteriorating margins, it might be overvalued.
TIKR’s historical valuation charts solve this problem. You can instantly see what’s normal for the stock and whether today’s valuation is above, below, or in line with its own history. Pair this with the fundamentals you reviewed earlier. If the business is improving but the multiple is below average, that’s interesting. If the business is weakening but the multiple is elevated, that’s a red flag.
Check Out Who Is Buying and Selling
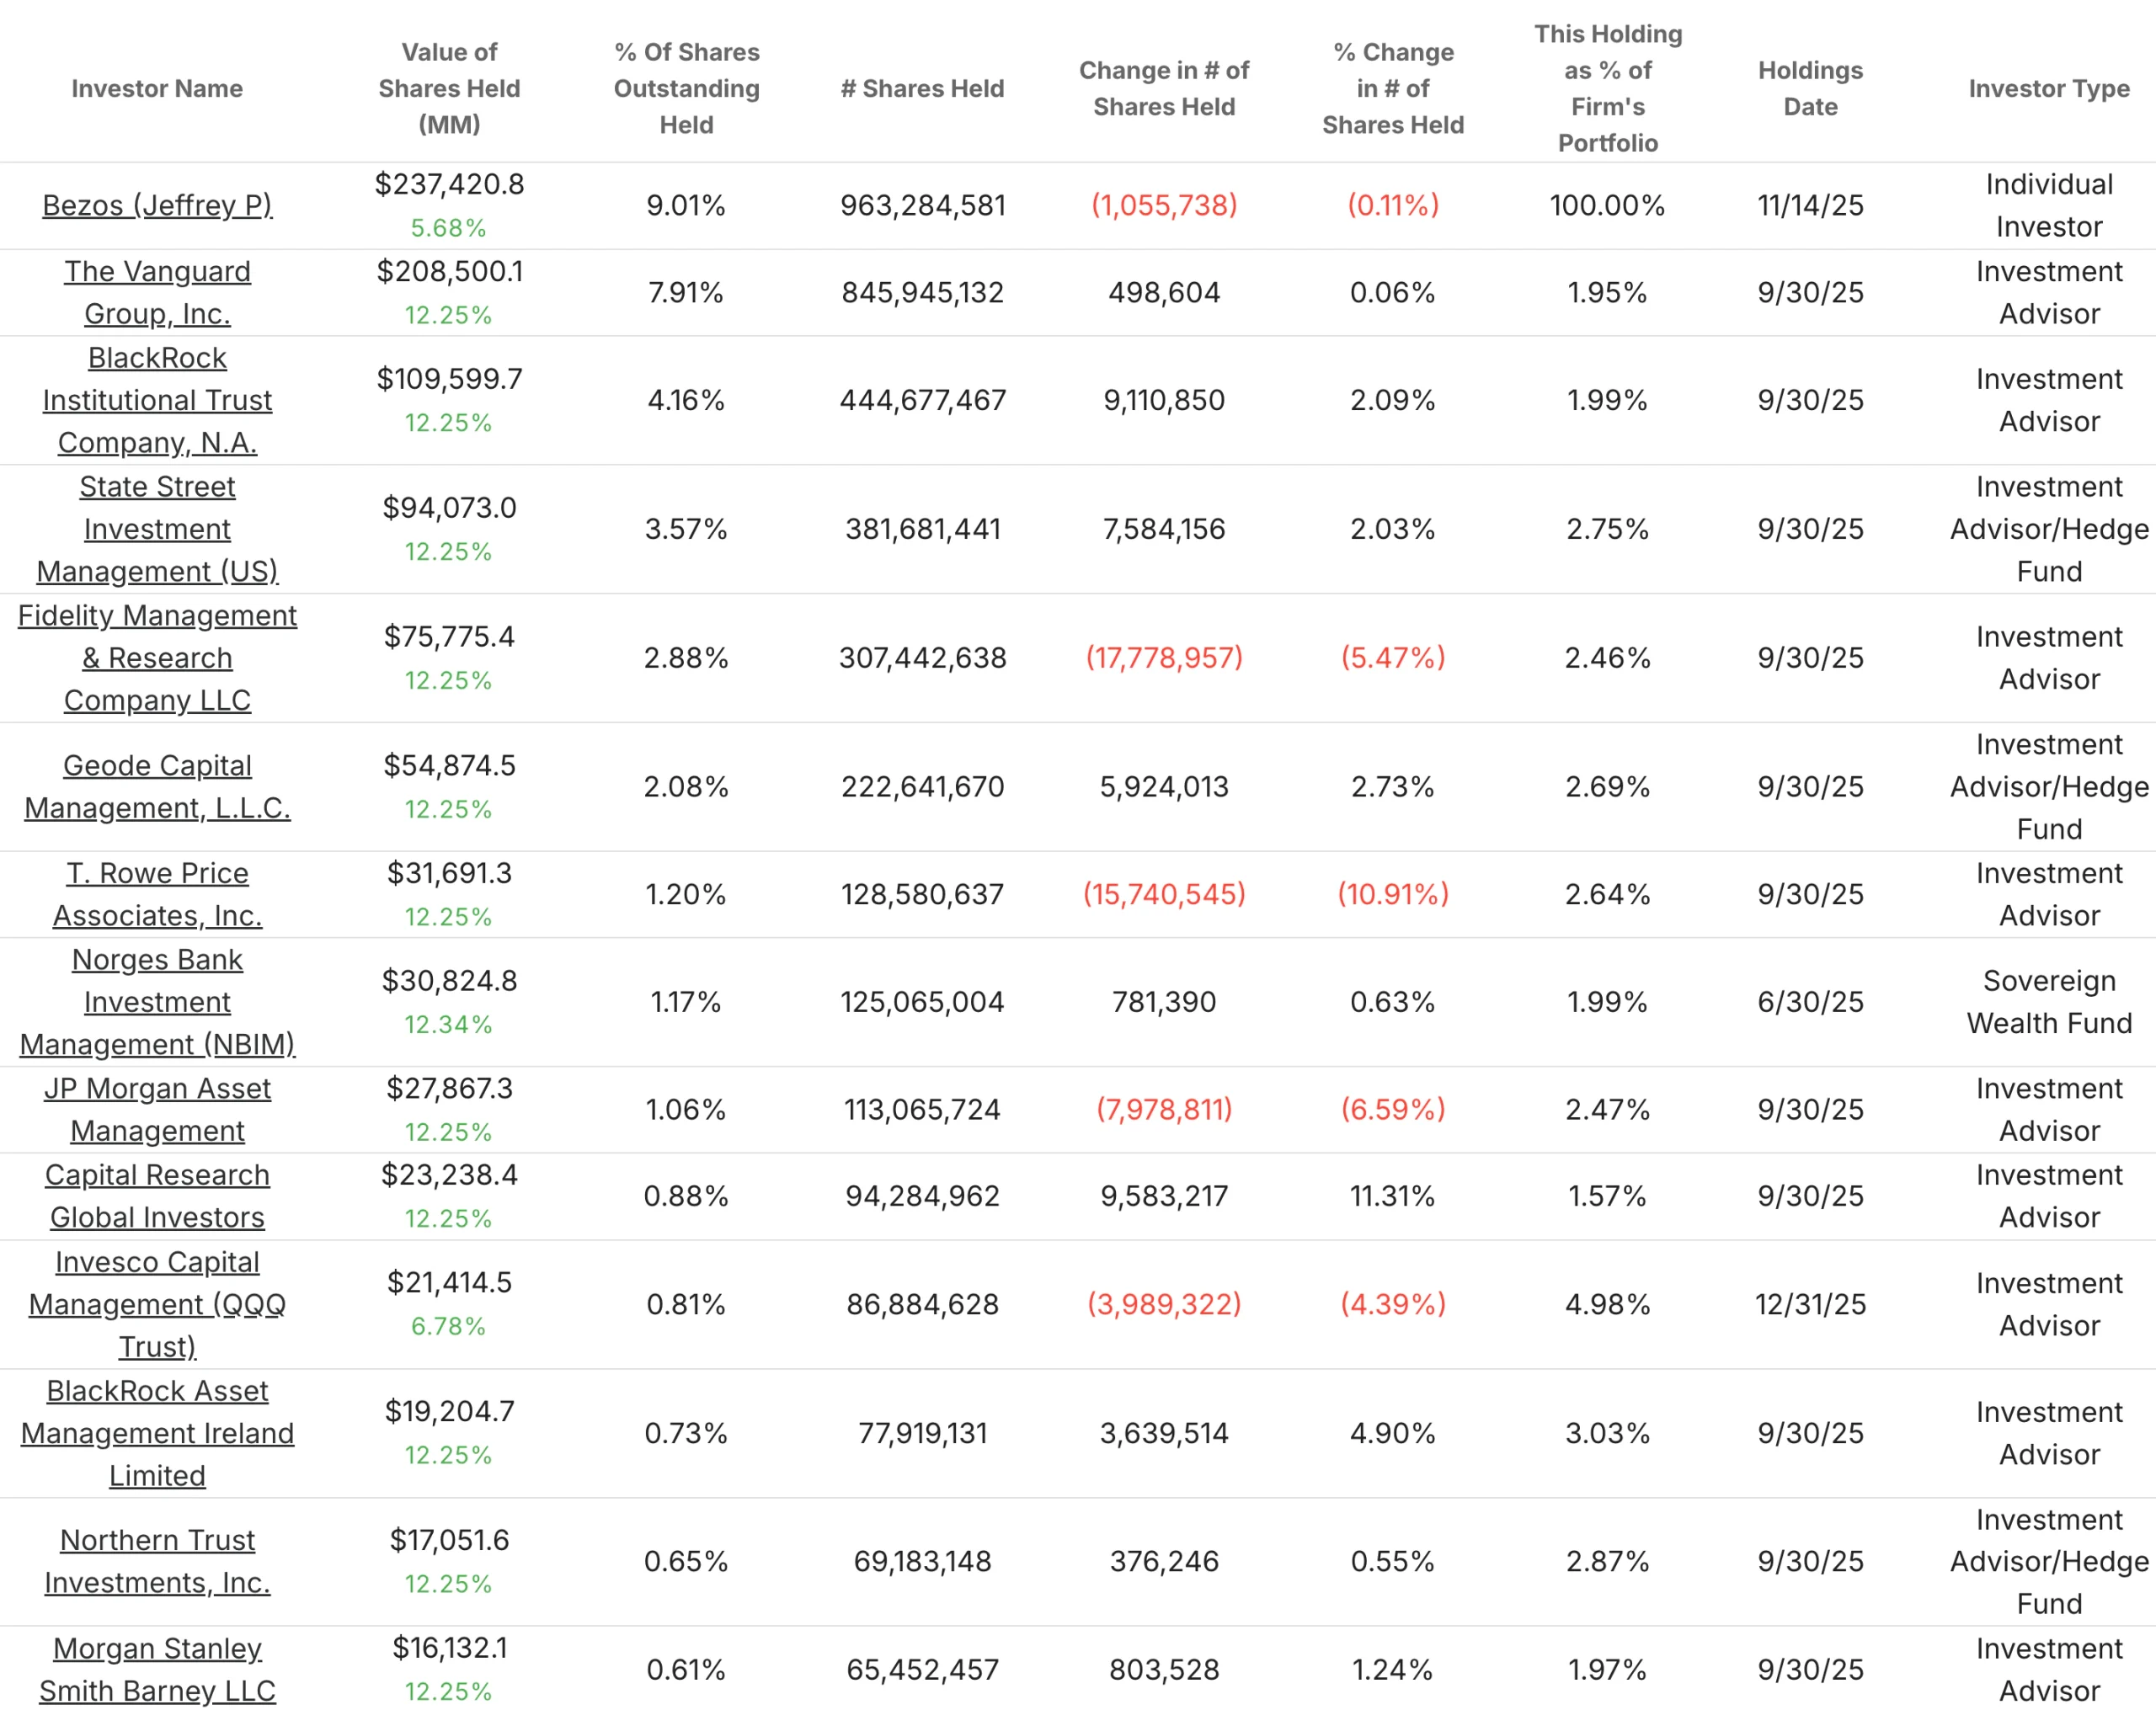
Finally, navigate to the Ownership tab. Filter by hedge funds or individual investors to identify major shareholders and see whether they’ve been buying or selling recently. Review the Insider Transactions section to see whether executives and directors are purchasing shares with their own money.
You don’t need to interpret every trade, but patterns matter. If multiple insiders are buying, especially after a price decline, it often signals confidence. If they’re selling heavily, it’s worth understanding why. Similarly, if respected institutional investors increase their positions, it can validate your thesis. If they’re exiting, ask what they might see that you don’t.
Ownership data won’t make or break your decision, but it adds context. It shows you whether the people closest to the business and the smartest money in the market agree with your assessment.
Write Down Your Thesis
After going through these steps, take five minutes to write down why you think the stock is or isn’t a good investment. Not a formal report. Just a few bullet points covering what the business does, whether it’s growing and profitable, how it compares to competitors, whether the valuation looks reasonable, and what risks you see.
This forces you to clarify your thinking. It also gives you something to revisit later when you’re deciding whether to buy more, hold, or sell. Your thesis doesn’t need to be perfect. It just needs to be clear enough that you can explain it to someone else or to yourself six months from now.
The TIKR Takeaway
The reason most beginners struggle isn’t a lack of intelligence. It’s a lack of access to the right tools. Professional analysts use expensive platforms that aggregate financial data, peer comparisons, ownership information, and historical trends in one place. Retail investors historically had to piece this together from a dozen free sources, each with inconsistent formats and incomplete data.
TIKR changes that. Everything you need to complete your first stock analysis lives under one roof: company overviews, detailed financials, valuation history, peer comparisons, insider transactions, and institutional ownership. You don’t need to toggle between sites, convert units manually, or wonder whether you’re viewing the right data. It’s all standardized, up to date, and designed to guide you through the exact process outlined above.
The platform also removes the intimidation factor. You don’t need to know how to read a 10-K or build a spreadsheet. TIKR presents the data visually with charts, timelines, and clean tables that make patterns obvious even if you’ve never taken a finance class. That accessibility doesn’t sacrifice depth. The same data professionals use is available to you. You just don’t need a Ph.D. to interpret it.
Find undervalued stocks in less than 60 seconds with TIKR’s new Valuation Model (It’s free) >>>
Value Any Stock in Under 60 Seconds with TIKR
With TIKR’s new Valuation Model tool, you can estimate a stock’s potential share price in under a minute.
All it takes is three simple inputs:
- Revenue Growth
- Operating Margins
- Exit P/E Multiple
If you’re not sure what to enter, TIKR automatically fills in each input using analysts’ consensus estimates, giving you a quick, reliable starting point.
From there, TIKR calculates the potential share price and total returns under Bull, Base, and Bear scenarios so you can quickly see whether a stock looks undervalued or overvalued.
Estimate a company’s fair value instantly (Free with TIKR) >>>
Looking for New Opportunities?
- Discover which stocks billionaire investors are purchasing, so you can follow the smart money.
- Analyze stocks in as little as 5 minutes with TIKR’s all-in-one, easy-to-use platform.
- The more rocks you overturn… the more opportunities you’ll uncover. Search 100K+ global stocks, global top investor holdings, and more with TIKR.
Disclaimer:
Please note that the articles on TIKR are not intended to serve as investment or financial advice from TIKR or our content team, nor are they recommendations to buy or sell any stocks. We create our content based on TIKR Terminal’s investment data and analysts’ estimates. Our analysis might not include recent company news or important updates. TIKR has no position in any stocks mentioned. Thank you for reading, and happy investing!