Key Takeaways:
- Revenue Momentum: Ferrari is compounding revenue at about 7% annually, reflecting pricing power and mix improvement rather than higher vehicle volumes.
- Margin Profile: Operating margins near 30% highlight structural profitability supported by customization, brand licensing, and limited production.
- Price Projection: Based on normalized growth and valuation assumptions, the stock could reach €398 by 2027.
- Return Outlook: This implies a 22% total return from €326, translating into roughly 11% annualized returns over two years.
Ferrari N.V. (RACE) designs and sells ultra-luxury performance cars with deliberately limited volumes that generated about €7 billion in revenue while protecting exclusivity as its core economic engine.
In January 2026, Ferrari continued its multi-year capital return strategy by repurchasing shares at roughly €318, reinforcing confidence in long-term earnings durability rather than short-term growth acceleration.
The company delivered operating profit of about €2 billion with operating margins near 29%, showing that pricing discipline and personalization revenue continue to outweigh cyclical demand pressures.
Ferrari’s market capitalization stands near €60 billion, with revenue growth increasingly supported by mix upgrades, bespoke orders, and expansion of lifestyle, sponsorship, and brand-linked income streams.
Despite rising earnings efficiency and disciplined capital returns, the stock trades near 34x forward earnings, leaving open whether execution strength alone can sustain premium valuation expectations.
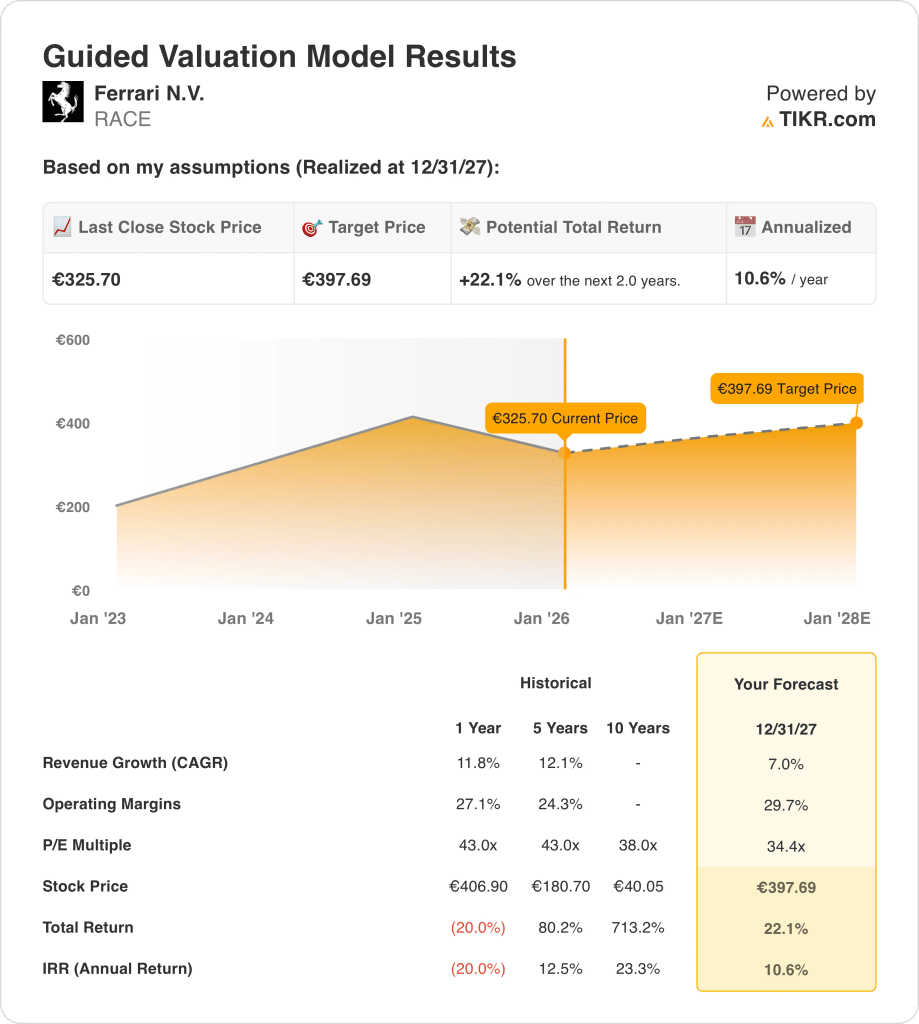
What the Model Says for RACE Stock
We assessed Ferrari’s premium positioning and disciplined capital returns, supported by strong margins and controlled volume growth across a limited-production model.
Assuming 7.0% revenue growth, 29.7% operating margins, and a 34.4x exit multiple, the model points to a €397.69 share price.
That implies a 22.1% total return from €325.70, equivalent to a 10.6% annualized return.
Estimate a company’s fair value instantly (Free with TIKR) >>>
Our Valuation Assumptions
TIKR’s Valuation Model lets you plug in your own assumptions for a company’s revenue growth, operating margins, and P/E multiple, and calculates the stock’s expected returns.
Here’s what we used for RACE stock:
1. Revenue Growth: 7%
Ferrari’s revenue expanded from about €4 billion in 2021 to nearly €7 billion LTM, reflecting consistent double-digit growth supported by pricing, mix, and disciplined shipment control.
Growth has cooled from the low-teens pace seen earlier, but demand for high-end personalization, special series, and limited supercars continues to outpace broader luxury auto trends.
Recent partnerships and brand monetization initiatives, including licensing and motorsport sponsorships, add incremental revenue without materially increasing production volumes or capital intensity.
Risks center on macro sensitivity among ultra-high-net-worth buyers and longer order lead times, while support comes from order backlog visibility and strict volume caps protecting exclusivity.
A 7.0% revenue growth outlook captures Ferrari’s sustained pricing power and order backlog, tempered by the natural maturation of the ultra-luxury automotive segment.
2. Operating Margins: 29.7%
Ferrari’s operating margins improved from roughly 25% in 2021 to nearly 29% recently, reflecting scale benefits, richer product mix, and rising personalization content per vehicle.
Margin expansion has been supported by limited production volumes, strong pricing discipline, and high-margin licensing and aftersales revenue that carries minimal incremental costs.
Normalization near 30% assumes continued cost control and favorable mix, while avoiding aggressive assumptions around volume growth or structural cost reductions.
Downside risks include higher labor costs and motorsport investments, but these are partly offset by pricing actions and recurring high-margin brand revenues.
Operating margins near 29.7% assume Ferrari maintains elite profitability, with recent gains moderating as investments and costs normalize at higher revenue levels.
3. Exit P/E Multiple: 34.4x
Ferrari has historically traded at premium multiples above 40× earnings during periods of accelerating growth and margin expansion, reflecting scarcity value and brand durability.
Current valuation embeds more caution as growth moderates, but still commands a premium versus global luxury and auto peers due to visibility, cash generation, and exclusivity.
A 34.4× exit multiple assumes investors continue to reward Ferrari’s capital-light model, strong returns on invested capital, and consistent shareholder distributions.
The multiple also reflects restraint, acknowledging sensitivity to macro cycles and the limits of volume growth within Ferrari’s controlled production strategy.
A 34.4× exit multiple reflects market expectations that Ferrari’s premium valuation endures, while acknowledging slower growth compared with earlier expansion phases.
Build your own Valuation Model to value any stock (It’s free!) >>>
What Happens If Things Go Better or Worse?
Ferrari’s outcomes hinge on order backlog conversion, pricing discipline, and cost control across a tightly managed production model, shaping a range of possible paths through 2029.
- Low Case: If demand normalizes faster at the high end, backlog shortens, and cost leverage softens, revenue grows around 6.0%, margins hold near 22.1%, valuation pressure persists, and returns rely mainly on steady earnings growth → 4.6% annualized return.
- Mid Case: With backlog conversion staying orderly, pricing power intact, and operating efficiency improving gradually, revenue growth near 6.6% and margins at 23.7% support a stable valuation path → 10.5% annualized return.
- High Case: If personalization mix expands, backlog remains extended, and cost discipline strengthens, revenue reaches 7.3%, margins approach 25%, and valuation headwinds ease as earnings visibility improves → 15.8% annualized return.
Ferrari’s near-term outcome depends less on unit volume and more on sustaining exclusivity, margin discipline, and controlled delivery cadence across an already demand-constrained model.

The €485 mid-case target appears achievable through earnings growth and margin execution alone, without requiring multiple expansion, provided backlog quality and pricing discipline remain intact.
How Much Upside Does It Have From Here?
With TIKR’s new Valuation Model tool, you can estimate a stock’s potential share price in under a minute.
All it takes is three simple inputs:
- Revenue Growth
- Operating Margins
- Exit P/E multiple
If you’re not sure what to enter, TIKR automatically fills in each input using analysts’ consensus estimates, giving you a quick, reliable starting point.
From there, TIKR calculates the potential share price and total returns under Bull, Base, and Bear scenarios so you can quickly see whether a stock looks undervalued or overvalued.
See a stock’s true value in under 60 seconds (Free with TIKR) >>>
Looking for New Opportunities?
- See what stocks billionaire investors are buying so you can follow the smart money.
- Analyze stocks in as little as 5 minutes with TIKR’s all-in-one, easy-to-use platform.
- The more rocks you overturn… the more opportunities you’ll uncover. Search 100K+ global stocks, global top investor holdings, and more with TIKR.
Disclaimer:
Please note that the articles on TIKR are not intended to serve as investment or financial advice from TIKR or our content team, nor are they recommendations to buy or sell any stocks. We create our content based on TIKR Terminal’s investment data and analysts’ estimates. Our analysis might not include recent company news or important updates. TIKR has no position in any stocks mentioned. Thank you for reading, and happy investing!