
Key Stats for FedEx Stock
- This week’s performance: -1.8%
- 52-week range: $194 to $319
- Valuation model target price: $325
- Implied upside: 6.9% over 2.3 years
Value your favorite stocks like FedEx with 5 years of analysts’ forecasts using TIKR’s new Valuation Model (It’s free) >>>
What Happened?
FedEx Corporation (FDX) shares slipped about 2% over the past week, with the stock closing near $304 on January 23.
The pullback came after a strong run since late 2025, so short-term traders locked in some profits as the stock approached its 52-week high near $319.
At the same time, the market digested multiple strategic announcements from FedEx regarding its planned FedEx Freight spin-off and major restructuring initiatives.
Because these developments were telegraphed in earlier announcements, investors saw little new information this week to push the stock significantly higher.
Why FedEx Has Been Moving This Way
The stock’s recent strength reflects investor confidence in management’s transformation strategy. FedEx has been executing on several fronts that support this momentum.
On January 24, FedEx announced the launch of senior notes in connection with its planned spin-off of FedEx Freight, signaling financial readiness for the separation. The company also announced major operational overhauls in France, with plans to cut up to 500 jobs as part of its broader transformation program.
These moves demonstrate management’s commitment to cost discipline and network efficiency, themes that have resonated with investors despite the short-term pain of workforce reductions.
FedEx recently secured $1.8 billion in credit facilities ahead of the spin-off, providing financial flexibility for the transition. These initiatives suggest management believes the market values operational separation and specialized focus more than integration.
FedEx will host an Analyst and Investor Day on February 12, 2026, giving management a chance to update its long-term profitability and capital allocation goals for both the standalone FedEx Express and future FedEx Freight entities.
Then, on March 19, 2026, the company is expected to report fiscal Q3 2026 results and hold its earnings call, where investors will look for confirmation that cost reductions, pricing discipline, and demand stabilization are feeding through to margins and free cash flow.
Dividend investors will also keep an eye on cash returns to shareholders, since FedEx’s dividend yield is about 1.9% and its payout ratio sits near 31%, leaving room for buybacks and potential dividend growth if earnings continue to improve.
See analysts’ growth forecasts and price targets for FedEx (It’s free) >>>
Is FedEx Stock Overvalued?
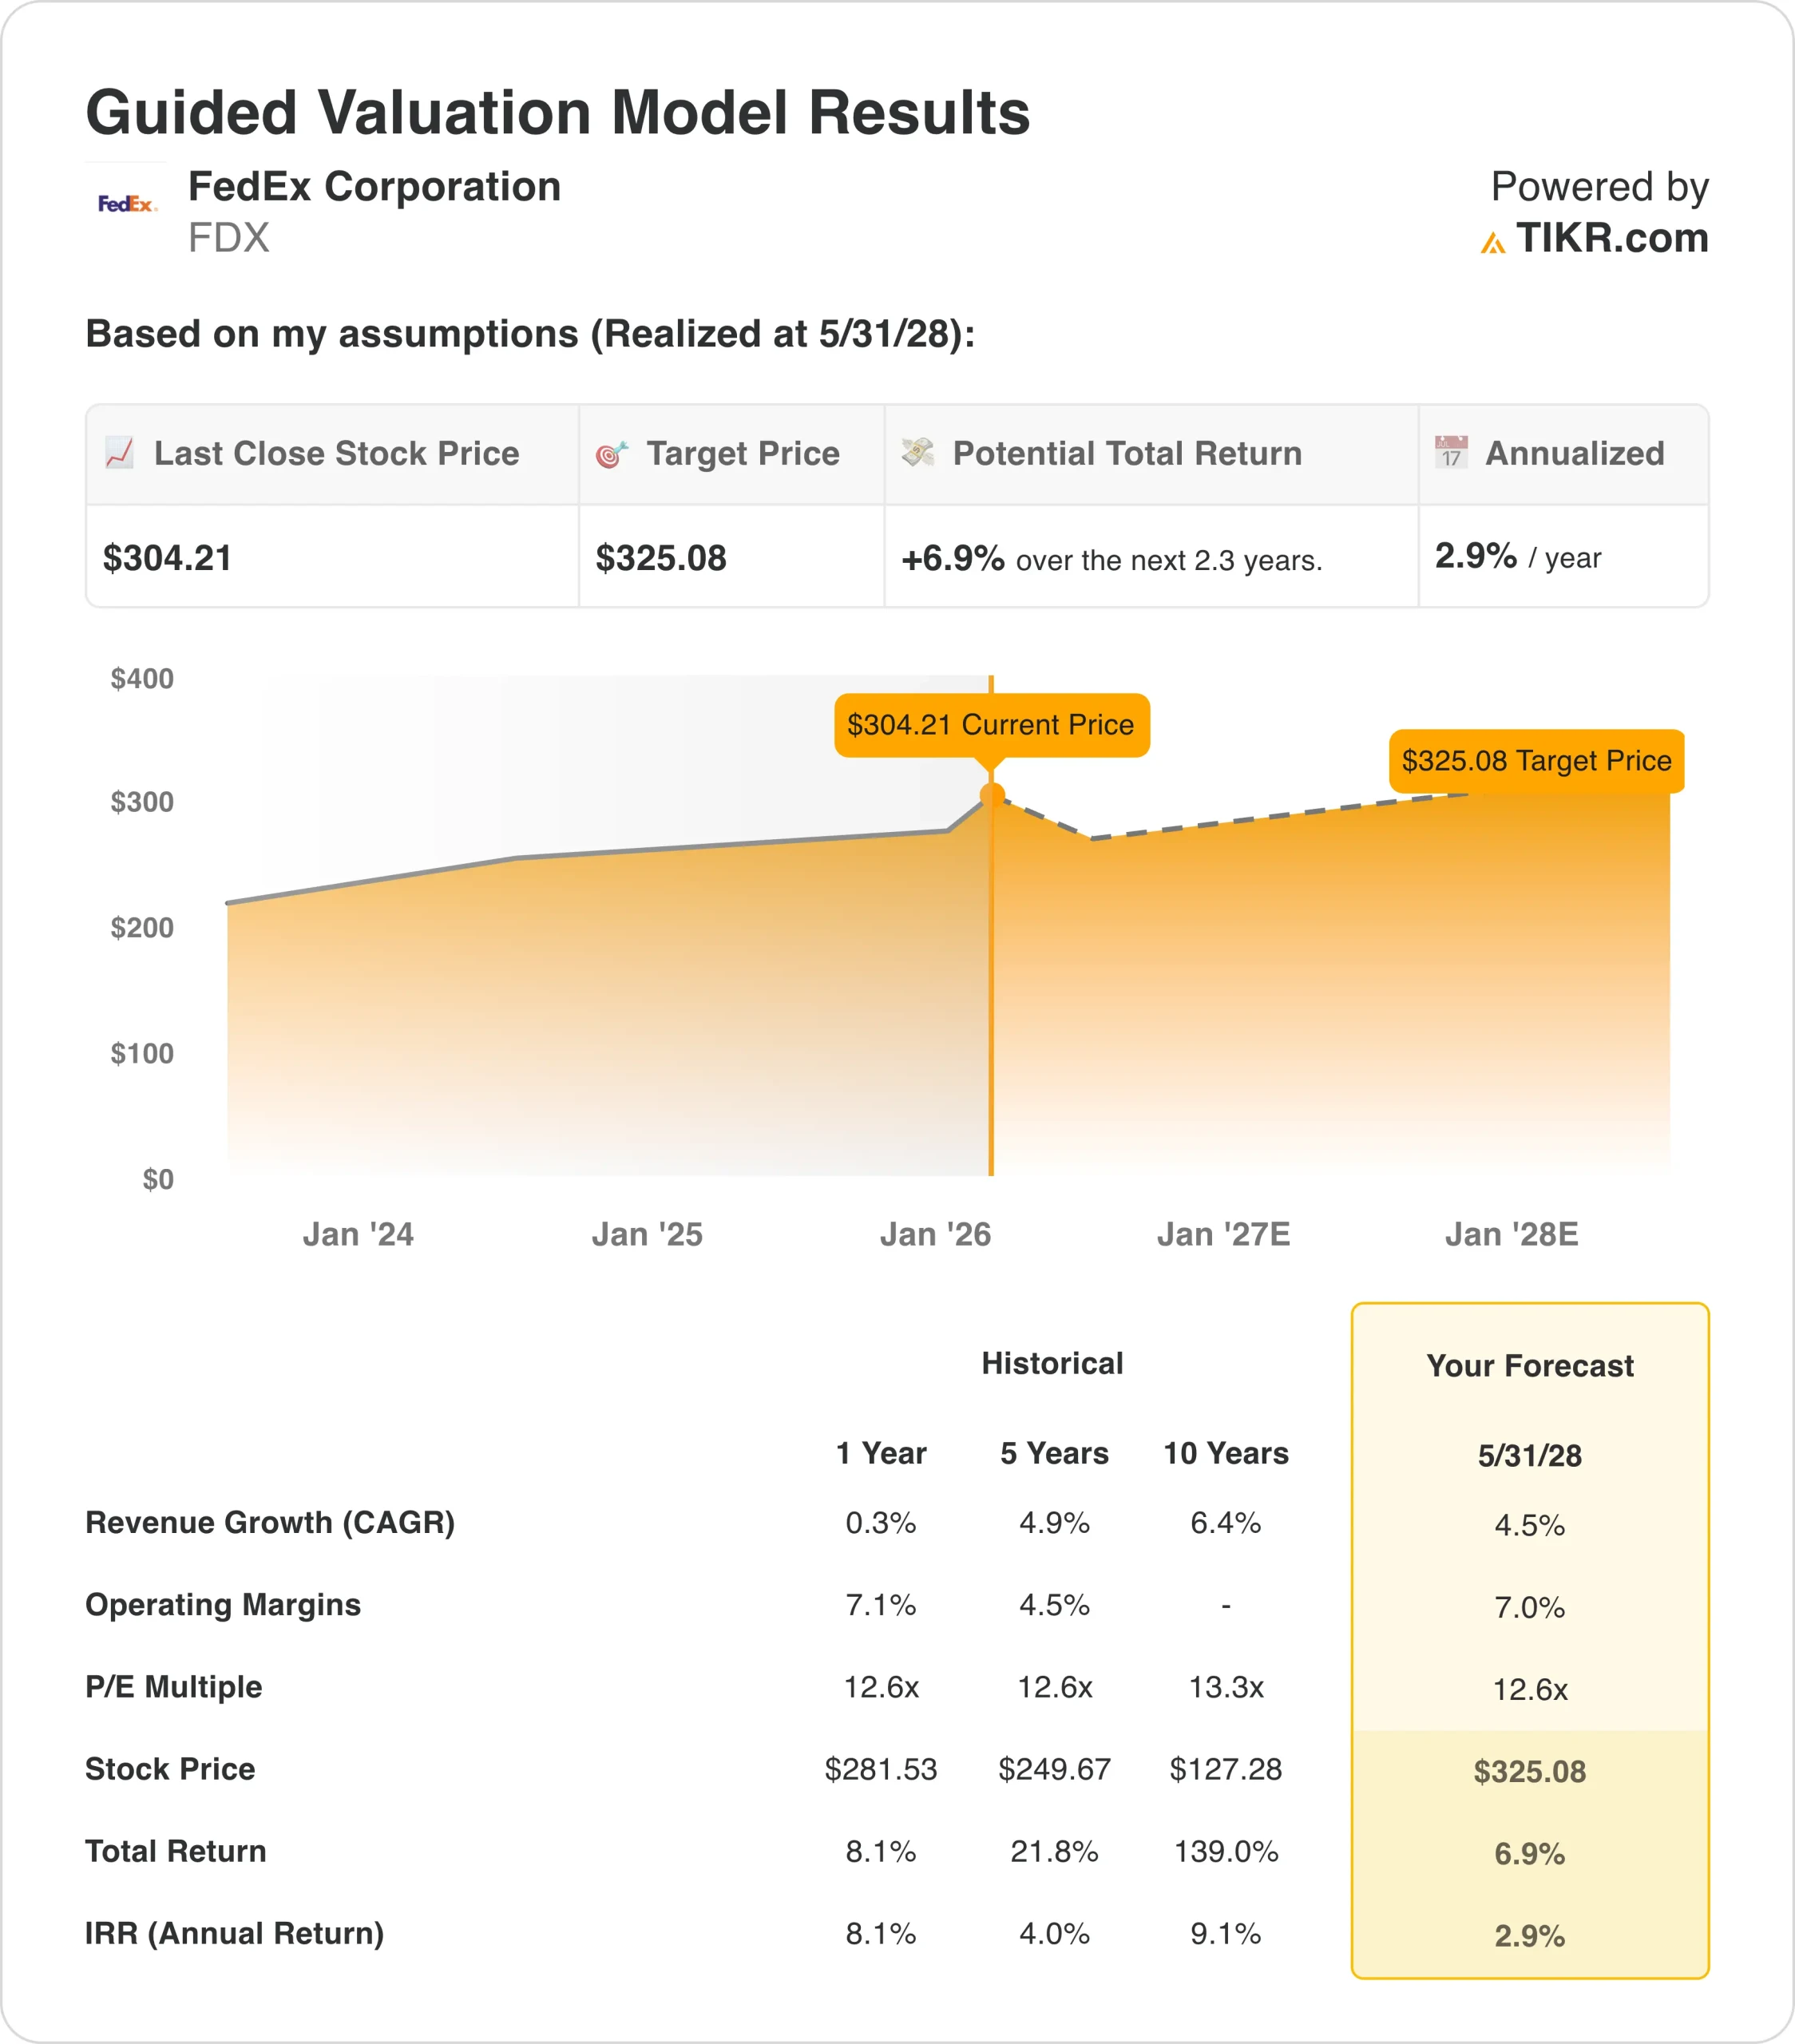
Under the valuation model assumptions realized through May 2028, the stock is modeled using:
- Revenue growth (CAGR): 4.5%
- Operating margins: 7.0%
- Exit P/E multiple: 12.6x
Based on these inputs, the model estimates a target price of $325, implying a 6.9% total return from the current share price of about $304 and a 2.9% annualized return over the next 2.3 years.
Because that expected annual return is below 5%, the model suggests the stock is closer to fairly valued than deeply undervalued right now.
The modest upside reflects how much of FedEx’s efficiency gains, balance-sheet improvement, and transformation story already appear priced in, especially with the shares trading at a forward P/E near 16 times earnings and an EV/EBITDA multiple around 9.4 times.
If management can sustain high-single-digit EPS growth and keep returns on invested capital around 10% while holding net leverage near 1.8 times EBITDA, then the current valuation could look reasonable for long-term holders rather than obviously cheap or expensive.
However, if macro conditions weaken, the spin-off faces execution challenges, or pricing power fades, the relatively modest modeled returns leave less cushion for disappointment.
Estimate a company’s fair value instantly (Free with TIKR) >>>
Value Any Stock in Under 60 Seconds (It’s Free)
With TIKR’s new Valuation Model tool, you can estimate a stock’s potential share price in under a minute.
All it takes is three simple inputs:
- Revenue Growth
- Operating Margins
- Exit P/E Multiple
From there, TIKR calculates the potential share price and total returns under Bull, Base, and Bear scenarios so you can quickly see whether a stock looks undervalued or overvalued.
If you’re not sure what to enter, TIKR automatically fills in each input using analysts’ consensus estimates, giving you a quick, reliable starting point.
See a stock’s true value in under 60 seconds (Free with TIKR) >>>