Ever notice how some companies seem to mint money on paper, yet their bank accounts stay mysteriously empty? It is a classic trap. Management can use every accounting trick in the book to “smooth” their earnings and make the bottom line look beautiful, but they cannot fake the actual cash moving through their accounts. Analyzing Cash Flow Quality is how you separate the high-performance businesses from the ones just running a clever PR campaign.
When you look at cash flow, you are checking the “pulse” of the business. You are asking if this growth is real. Are they actually collecting money from customers, or are they just shipping boxes and hoping for the best? In 2026, you do not need an accounting degree to spot these red flags. The right tools can bridge the gap between “reported profits” and “spendable cash” in seconds, letting you find the cash-generating machines that are built to last.
The following platforms transform cash flow analysis from a complex accounting task into a streamlined research workflow. By using these tools to track multi-year Free Cash Flow trends and audit capital expenditure efficiency, you can identify the businesses that possess a genuine structural advantage. These are the best free resources for turning a dry financial audit into a clear, evidence-based conviction.
1. TIKR
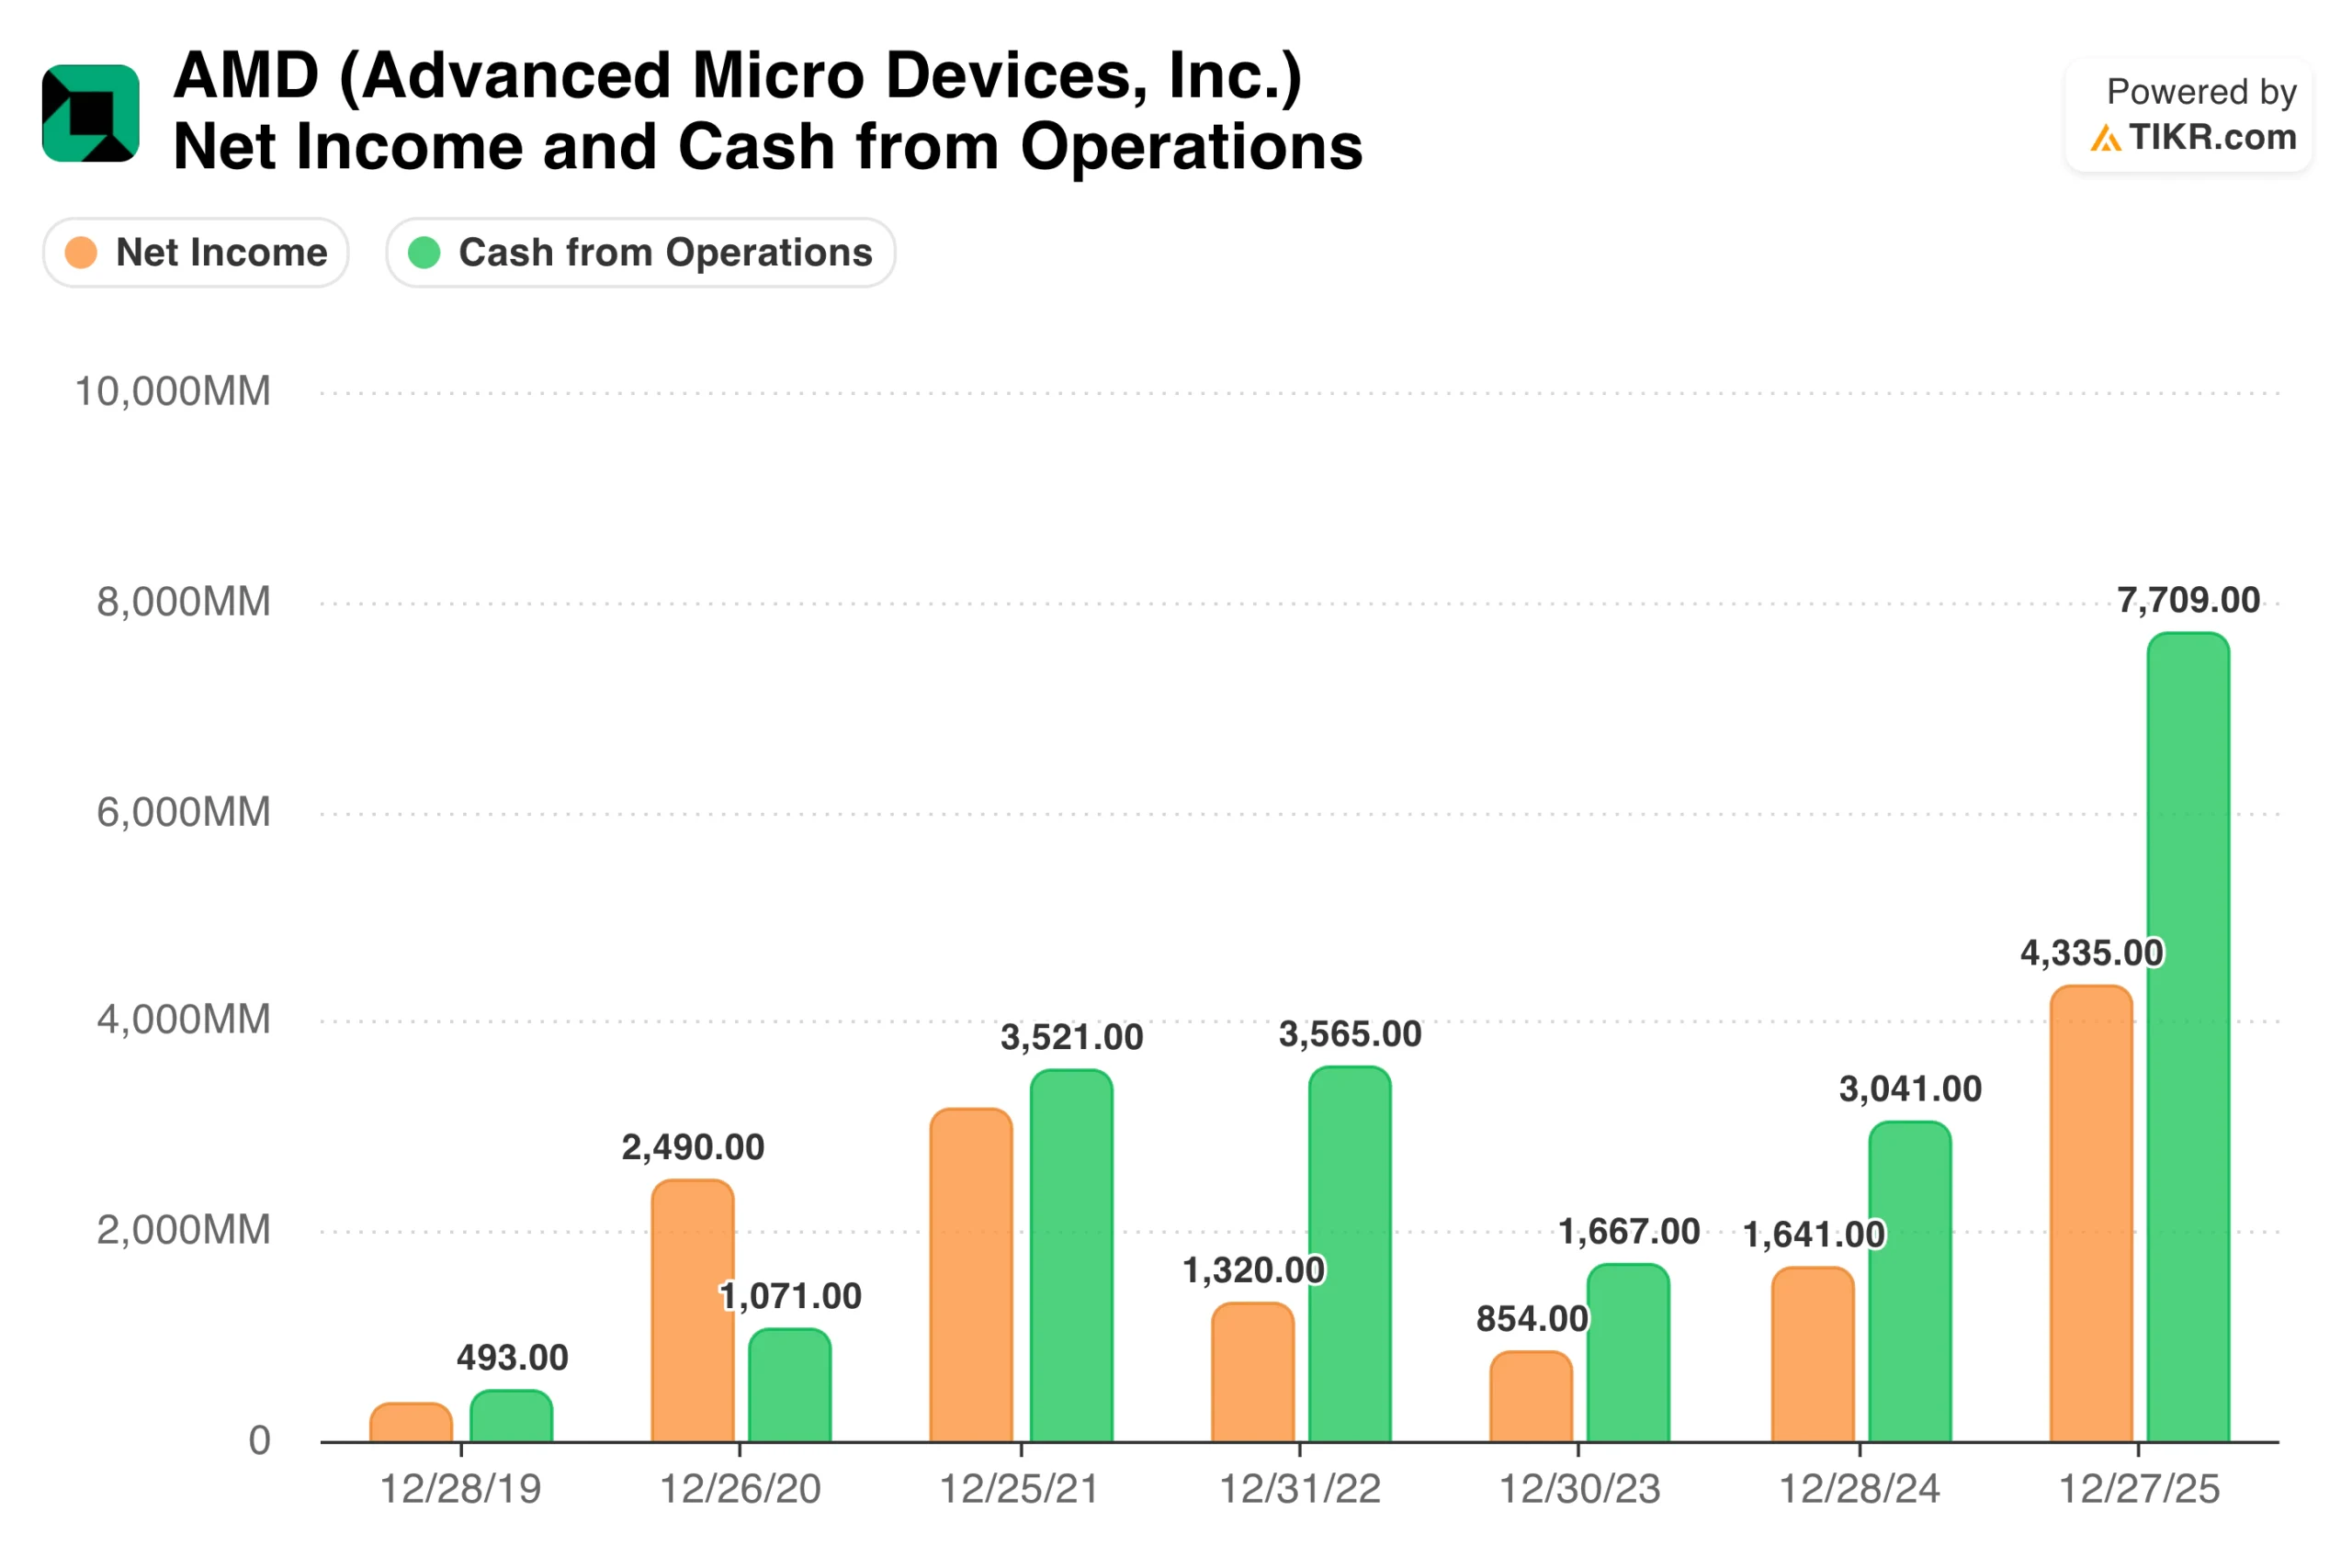
TIKR is the premier choice for cash flow analysis because it provides multiple years of historical data necessary to see how a company’s cash generation behaves across entire market cycles. While basic tools often hide the details, TIKR delivers standardized cash flow statements for over 100,000 global stocks, making it easy to spot long-term shifts in how a business funds its operations.

The platform excels at identifying “earnings quality” issues by highlighting the divergence between reported net income and Operating Cash Flow. Its charting tools allow you to overlay these two metrics instantly, revealing whether a company is actually collecting cash or just booking paper profits. With TIKR, you are not just looking at a snapshot; you are auditing the structural integrity of the company’s internal money-making engine.
Best Features:
- 15+ Years of Historical Cash Flow: Audit cash generation across decades to identify businesses that consistently convert 80-100% of net income into free cash flow regardless of the economic climate.
- Global Cash Flow Standardization: Access apples-to-apples cash flow data for 100,000+ stocks across international markets, removing the headache of navigating different accounting standards like IFRS vs. GAAP.
- Operating vs. Free Cash Flow Visualization: Instantly chart cash from operations against capital expenditures to see the “owner earnings” left over for shareholders and determine if a company is becoming more capital-intensive.
- Forensic Earnings Quality Assessment: Use detailed line items to spot red flags such as spiking receivables or declining deferred revenue, catching potential accounting traps months before the broader market.
Review a stock’s detailed financials like cash flow statements instantly (Free with TIKR) >>>
| Tool | Best For | Key Cash Flow Feature |
| TIKR | Deep Historical Audits | 15+ Years of Global FCF Trends |
| Stock Analysis | Clean Trend Reading | Detailed Operating Breakdowns |
| GuruFocus | Value-First DCFs | Built-in FCF Yield & Growth Trackers |
| TradingView | Visual Charting | Cash Flow Per Share Overlays |
| Seeking Alpha | Community Insights | FCF Sustainability Discussions |
2. Stock Analysis
Stock Analysis is a standout for investors who prioritize clean, clutter-free data. It offers high-quality, standardized financial statements with a specific focus on making the cash flow statement easy to read. It automatically breaks down operating cash flow and free cash flow metrics, allowing you to evaluate a company’s sustainability without getting lost in unnecessary noise.

The platform is particularly strong for side-by-side trend reading. Once you navigate to the financials page, the year-over-year layout makes it incredibly easy to see if capital expenditures are growing faster than operating cash. This is a key indicator that a company’s moat might be shrinking as it works harder to maintain its current level of success.
Best Features:
- Stock Analysis does this best by providing a Polished Multi-Year Interface that simplifies the math of cash flow trends for rapid, high-speed research.
Compare cash flow to income statements on any stock in less than 60 seconds with TIKR (It’s free) >>>
3. GuruFocus
GuruFocus is built for the value-oriented investor who wants to see the “long-tail” of a company’s history. It features up to 30 years of cash flow statements for many stocks, providing a massive dataset for evaluating long-term sustainability. It also includes built-in DCF calculators that are pre-populated with free cash flow data, allowing you to estimate intrinsic value based on real cash generation.
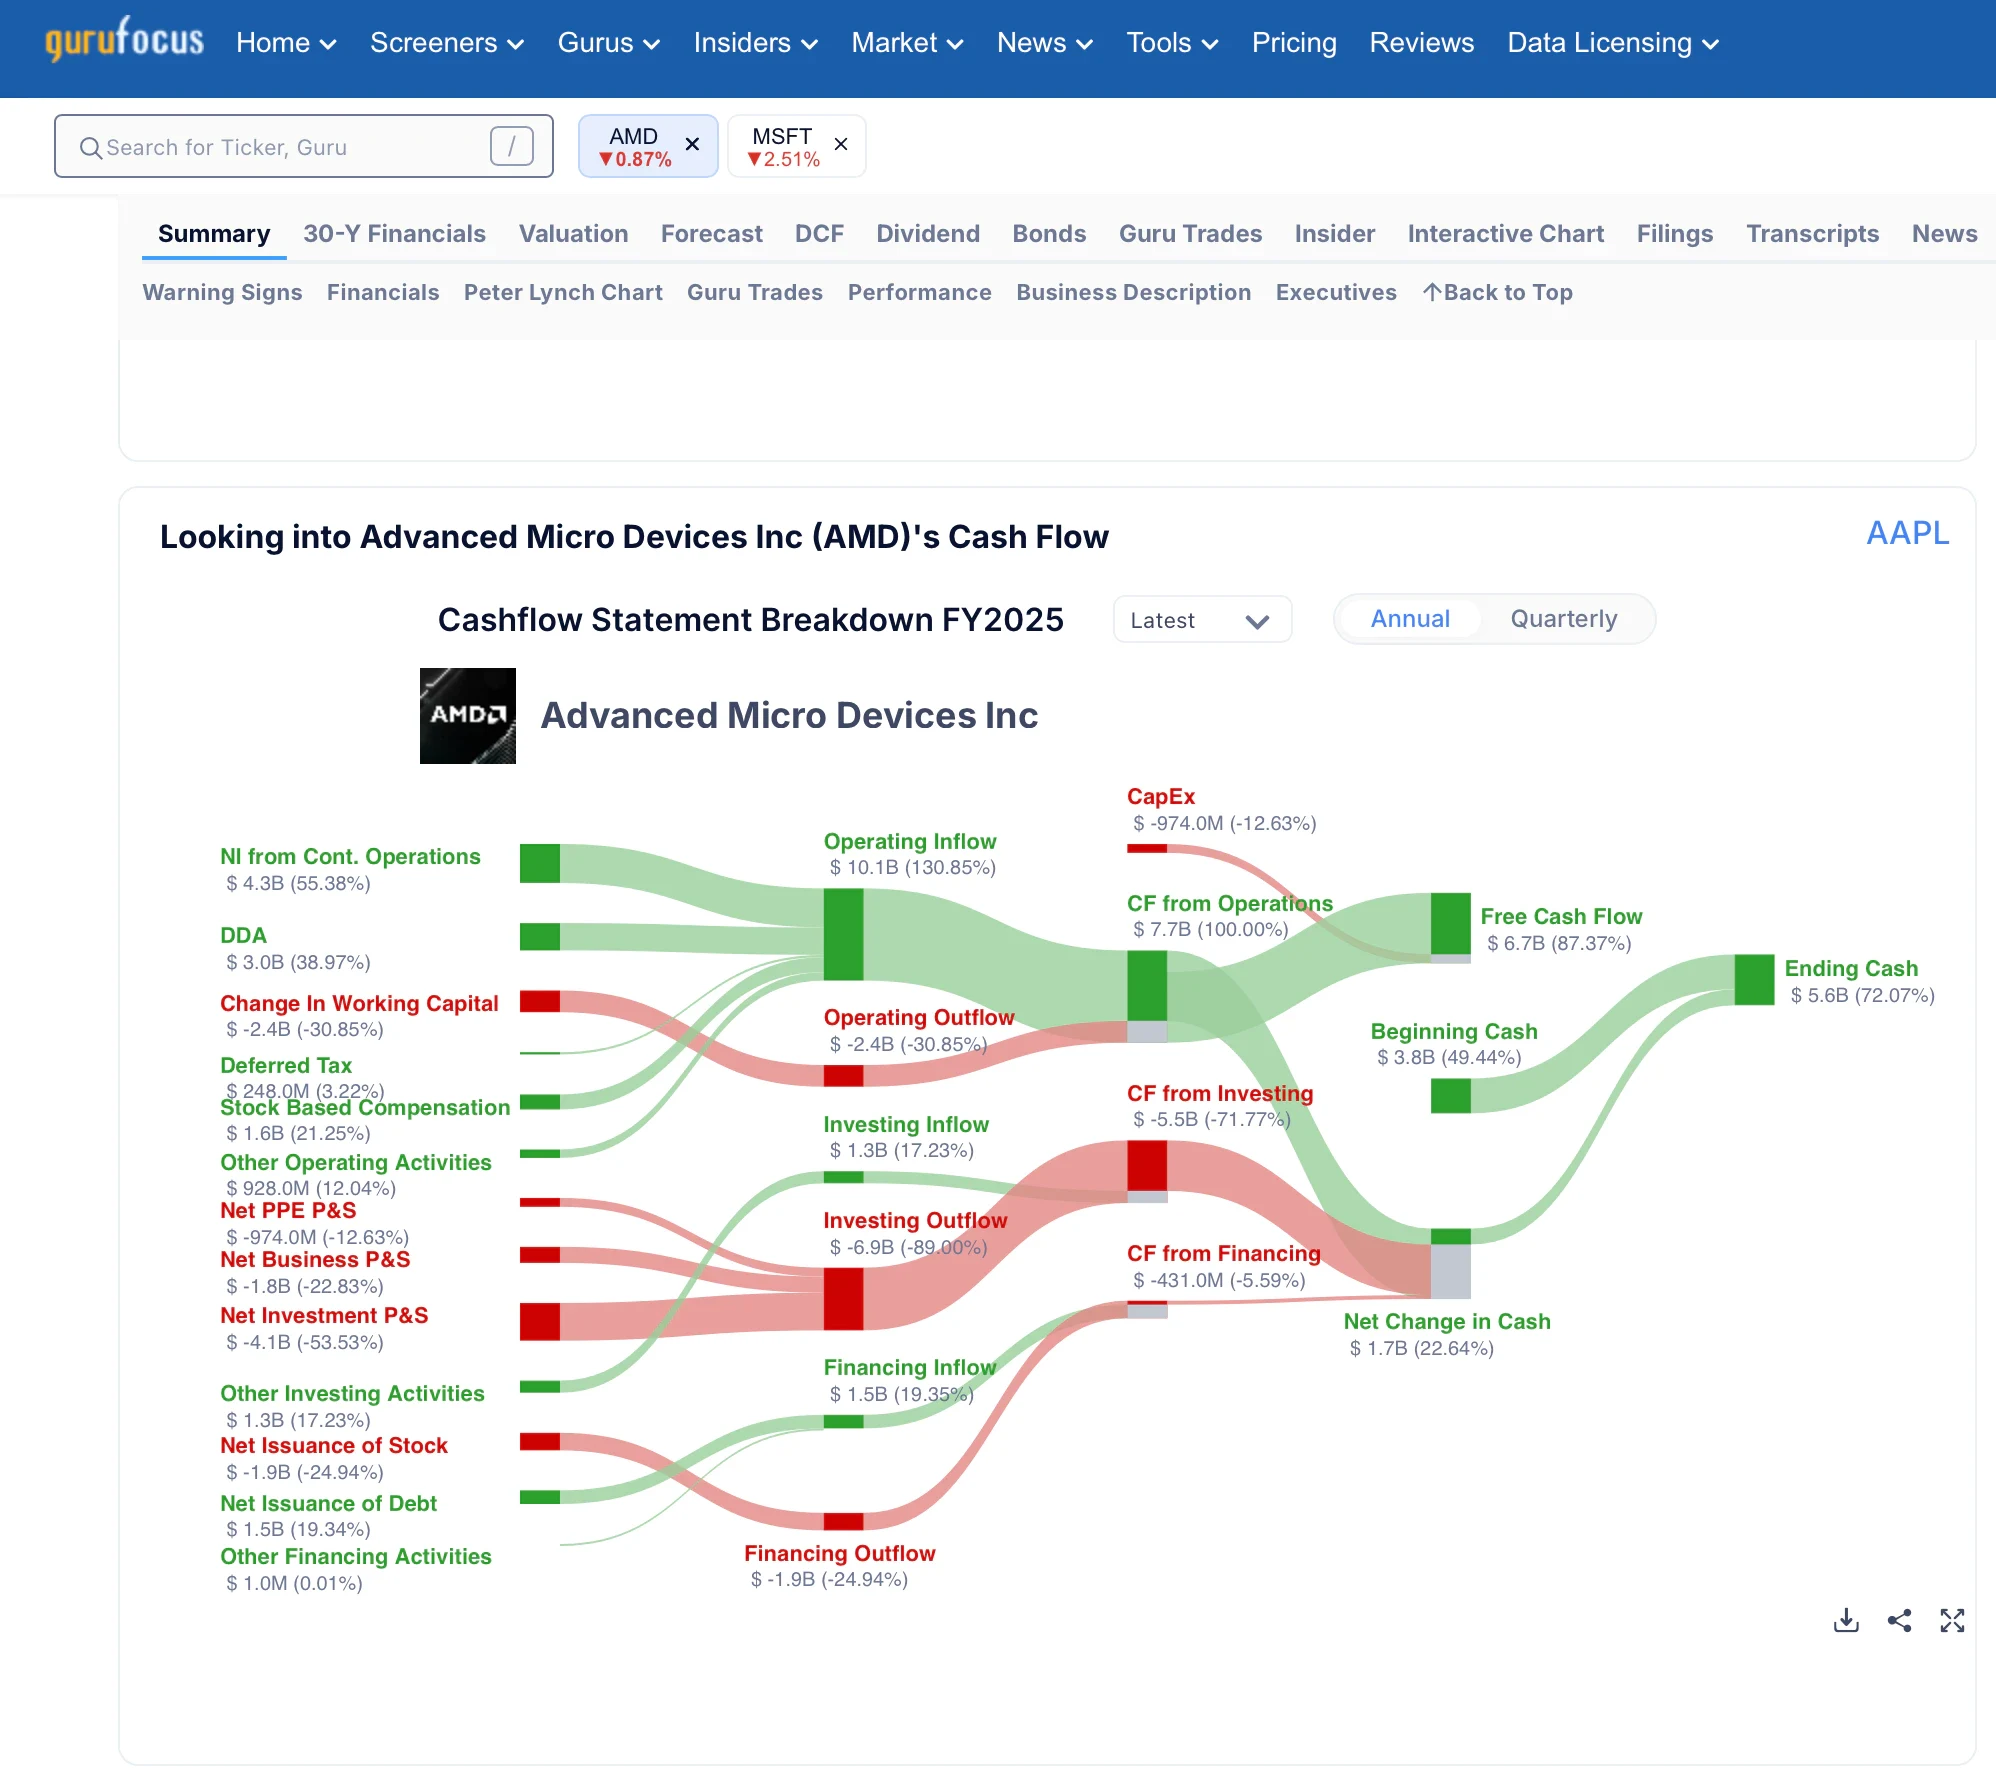
The platform’s GF Score is a useful shorthand that incorporates cash-flow quality into a broader financial-health rating. It is an ideal tool for deep dives into FCF yield and reinvestment efficiency, helping you identify businesses that are effectively compounding their cash over decades.
Best Features:
- GuruFocus does this best by offering 30-Year Financial Histories and integrated FCF-based valuation models to ensure a company’s cash engine is durable.
4. TradingView
TradingView is the premier tool for visualizing cash flow alongside price action. While most platforms keep fundamental data in a separate tab, TradingView allows you to plot metrics like Free Cash Flow per Share directly onto the stock’s price chart. This helps you see the direct correlation between a company’s cash generation and its market performance over multiple time frames.

The platform also features an advanced Stock Screener that allows you to filter the global market for specific cash flow thresholds. Whether you are looking for stocks with a high FCF yield or those with improving operating cash margins, TradingView provides the technical and fundamental tools to find them in one place.
Best Features:
- TradingView does this best by providing Fundamental Price Overlays that let you visualize how a company’s cash flow growth is priced by the market in real time.
5. Seeking Alpha
Seeking Alpha provides a unique community-driven perspective on cash flow quality. Beyond the raw data, the platform features thousands of articles and discussions focused specifically on FCF sustainability. This is where you can find on-the-ground analysis of why a company’s cash flow might be lagging behind its earnings, such as seasonal inventory builds or one-time tax adjustments.

The “Cash Flow” tab on Seeking Alpha provides a detailed breakdown of cash generation components, but the real value lies in the Analyst Insights. Reading through different bull and bear cases for a company’s free cash flow helps you understand the qualitative risks that the numbers alone might not reveal.
Best Features:
- Seeking Alpha does this best by offering Crowdsourced Forensic Analysis that digs into the “why” behind a company’s cash generation trends.
Track company financials to quickly review net income and cash from operations with TIKR (It’s free) >>>
TIKR Takeaway
A company can fake earnings for a season, but it cannot fake fifteen years of consistent free cash flow. TIKR exposes “paper profits” by tracking the exact moment a dollar of revenue becomes a dollar of spendable cash.
Instead of relying on a single quarter’s headline, you can use the platform’s global database to audit the structural efficiency of a business’s reinvestment cycle. It replaces the anxiety of accounting magic with a clear, data-backed view of a company’s true compounding power.
Value Any Stock in Under 60 Seconds with TIKR
With TIKR’s new Valuation Model tool, you can estimate a stock’s potential share price in under a minute.
All it takes is three simple inputs:
- Revenue Growth
- Operating Margins
- Exit P/E Multiple
If you’re not sure what to enter, TIKR automatically fills in each input using analysts’ consensus estimates, giving you a quick, reliable starting point.
From there, TIKR calculates the potential share price and total returns under Bull, Base, and Bear scenarios so you can quickly see whether a stock looks undervalued or overvalued.
See a stock’s true value in under 60 seconds (Free with TIKR) >>>
Looking for New Opportunities?
- Discover which stocks billionaire investors are purchasing, so you can follow the smart money.
- Analyze stocks in as little as 5 minutes with TIKR’s all-in-one, easy-to-use platform.
- The more rocks you overturn… the more opportunities you’ll uncover. Search 100K+ global stocks, global top investor holdings, and more with TIKR.
Disclaimer:
Please note that the articles on TIKR are not intended to serve as investment or financial advice from TIKR or our content team, nor are they recommendations to buy or sell any stocks. We create our content based on TIKR Terminal’s investment data and analysts’ estimates. Our analysis might not include recent company news or important updates. TIKR has no position in any stocks mentioned. Thank you for reading, and happy investing!