
Key Stats for Microsoft Stock
- Current Price: $372.74
- Target Price (Mid): $791.96
- Street Target: $591.60
- Potential Total Return: +112.5%
- Annualized IRR: 19.30% / year
Now Live: Discover how much upside your favorite stocks could have using TIKR’s new Valuation Model (It’s free) >>>
What Happened?
A few $2.7 trillion companies have felt the weight of one earnings report, as Microsoft (MSFT) has since January.
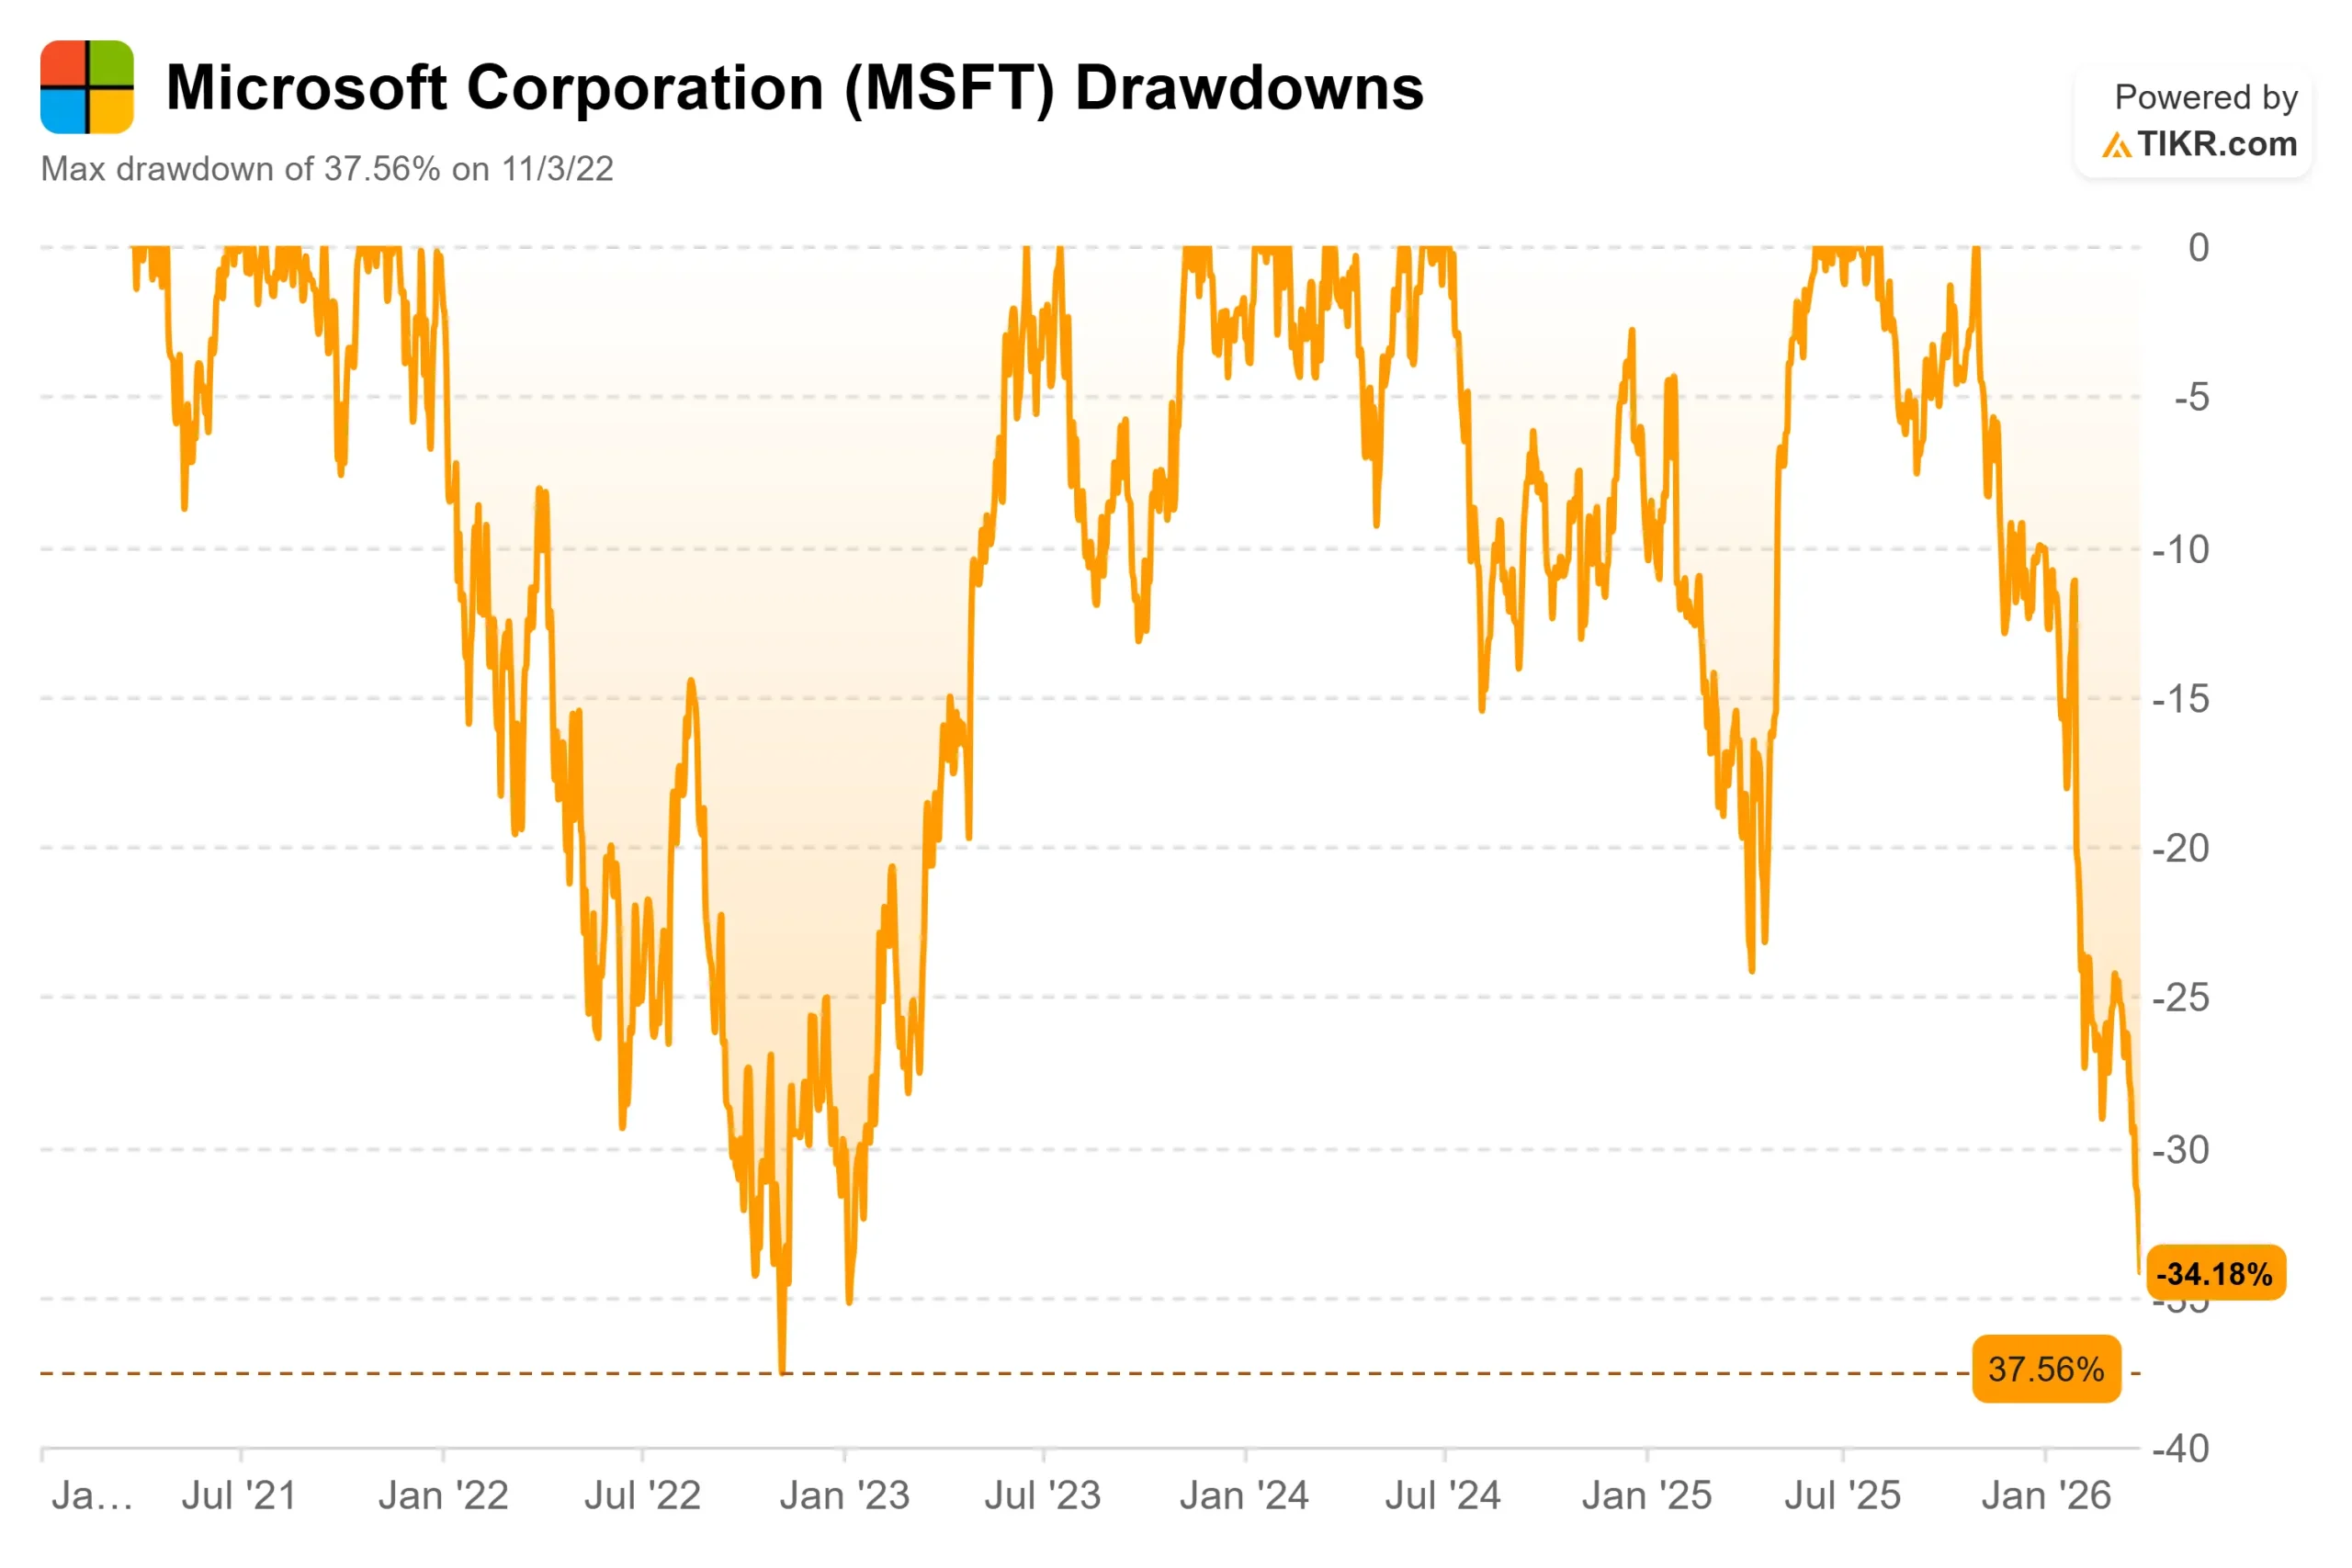
The stock has fallen 31.58% from its 52-week high of $555.45, hitting its maximum drawdown on March 25, 2026, as AI spending anxiety, macro pressure from the Iran conflict, and a hiring freeze across Microsoft‘s cloud and North American sales groups all converged at once.
Bulls see a generational buying opportunity in a company with 46.7% operating margins and a $625 billion contracted backlog.
Bears see a company that spent over $29 billion on capital expenditures in a single quarter and still cannot show investors exactly when the returns arrive.
The question the market cannot yet answer is whether Azure growth reaccelerates enough in the second half of fiscal 2026 to prove the spending is working.
The January 28, 2026, earnings report started the slide.
The headline numbers were strong: according to Microsoft’s Q2 FY2026 press release, revenue reached $81.3 billion, up 17% year over year, Azure grew 39%, and Microsoft Cloud revenue crossed $50 billion in a single quarter for the first time.
The stock fell (9.99%) the following day.
The reason was one line in CFO Amy Hood’s commentary: capital expenditures had surged 66% year over year in the quarter, and Hood signaled that the full-year capex growth rate would come in higher than fiscal 2025.
“One of the core issues that is weighing on investors is that capex is growing faster than we expected, and maybe Azure is growing a little bit slower than we expected,” said Keith Weiss, head of U.S. software research at Morgan Stanley, during the Q2 earnings call.
“That fundamentally comes down to a concern on the return on investment on this capex spend over time.”
Nadella addressed that concern directly at the Morgan Stanley Technology, Media and Telecom Conference on March 4-5.
He argued that evaluating Microsoft purely on Azure misses how AI is compounding value across GitHub, Microsoft 365 Copilot, and what he called WorkIQ, the database layer embedded in Microsoft 365.
“I look at all agents as users,” Nadella told Weiss, framing the agentic AI transition as TAM expansion, not a threat to the existing model.
See historical and forward estimates for Microsoft stock (It’s free!) >>>
Is Microsoft Undervalued Today?
At $372.74, Microsoft trades at 21.23x next-twelve-months (NTM) earnings, the lowest forward multiple the stock has carried since early 2023.
The stock was trading at 31.97x NTM earnings as recently as December 2024.
The compression has nothing to do with collapsing estimates.
The multiple has fallen because the market wants proof that triple-digit billion-dollar infrastructure spending earns a return before it will pay a premium again.
The earnings track record argues that skepticism is overdone.
Microsoft has beaten revenue estimates in each of the past five reported quarters, with beats ranging from 1.20% to 3.48%.
The Productivity and Business Processes segment, which houses Microsoft 365, Teams, and LinkedIn, delivered $120.8 billion in fiscal 2025 revenue, up 55% from $77.7 billion the prior year as Copilot monetization began scaling.
The Intelligent Cloud segment, which houses Azure, reached $106.3 billion in fiscal 2025, growing from $105.4 billion the year before, with the near-flat result reflecting supply constraints rather than demand softness.
As Hood disclosed during the Q2 earnings call, if Microsoft had allocated all new GPUs in the quarter exclusively to Azure, Azure’s growth would have been well above the reported 39%.
On valuation, Microsoft at 21.23x NTM P/E sits below ServiceNow at 24.72x and well below Palo Alto Networks at 42.42x, while carrying 46.7% LTM operating margins that neither competitor approaches.
Oracle trades at 19.42x NTM P/E on roughly one-fifth of Microsoft’s revenue base. The discount to Microsoft’s own history is defensible given the capital intensity.
The discount to peers with weaker financial profiles is much harder to sustain.
The legitimate concern is free cash flow.
Microsoft’s own FY2026 Q2 earnings filing stated plainly: “Significant investments may not achieve expected returns.”
The contracted backlog of $625 billion, up 110% year over year, includes roughly 45% tied to OpenAI commitments, introducing a degree of counterparty concentration worth monitoring.
The remaining 55% of that backlog grew 28% year over year, across a broad base of enterprise customers, which Hood described as providing strong confidence in the durability of demand.
The recovery path depends on Azure reaccelerating when new capacity comes online in the second half of fiscal 2026.
If CAPEX continues to outpace monetization into fiscal 2027, the pressure on the stock does not relent.

TIKR Advanced Model Analysis
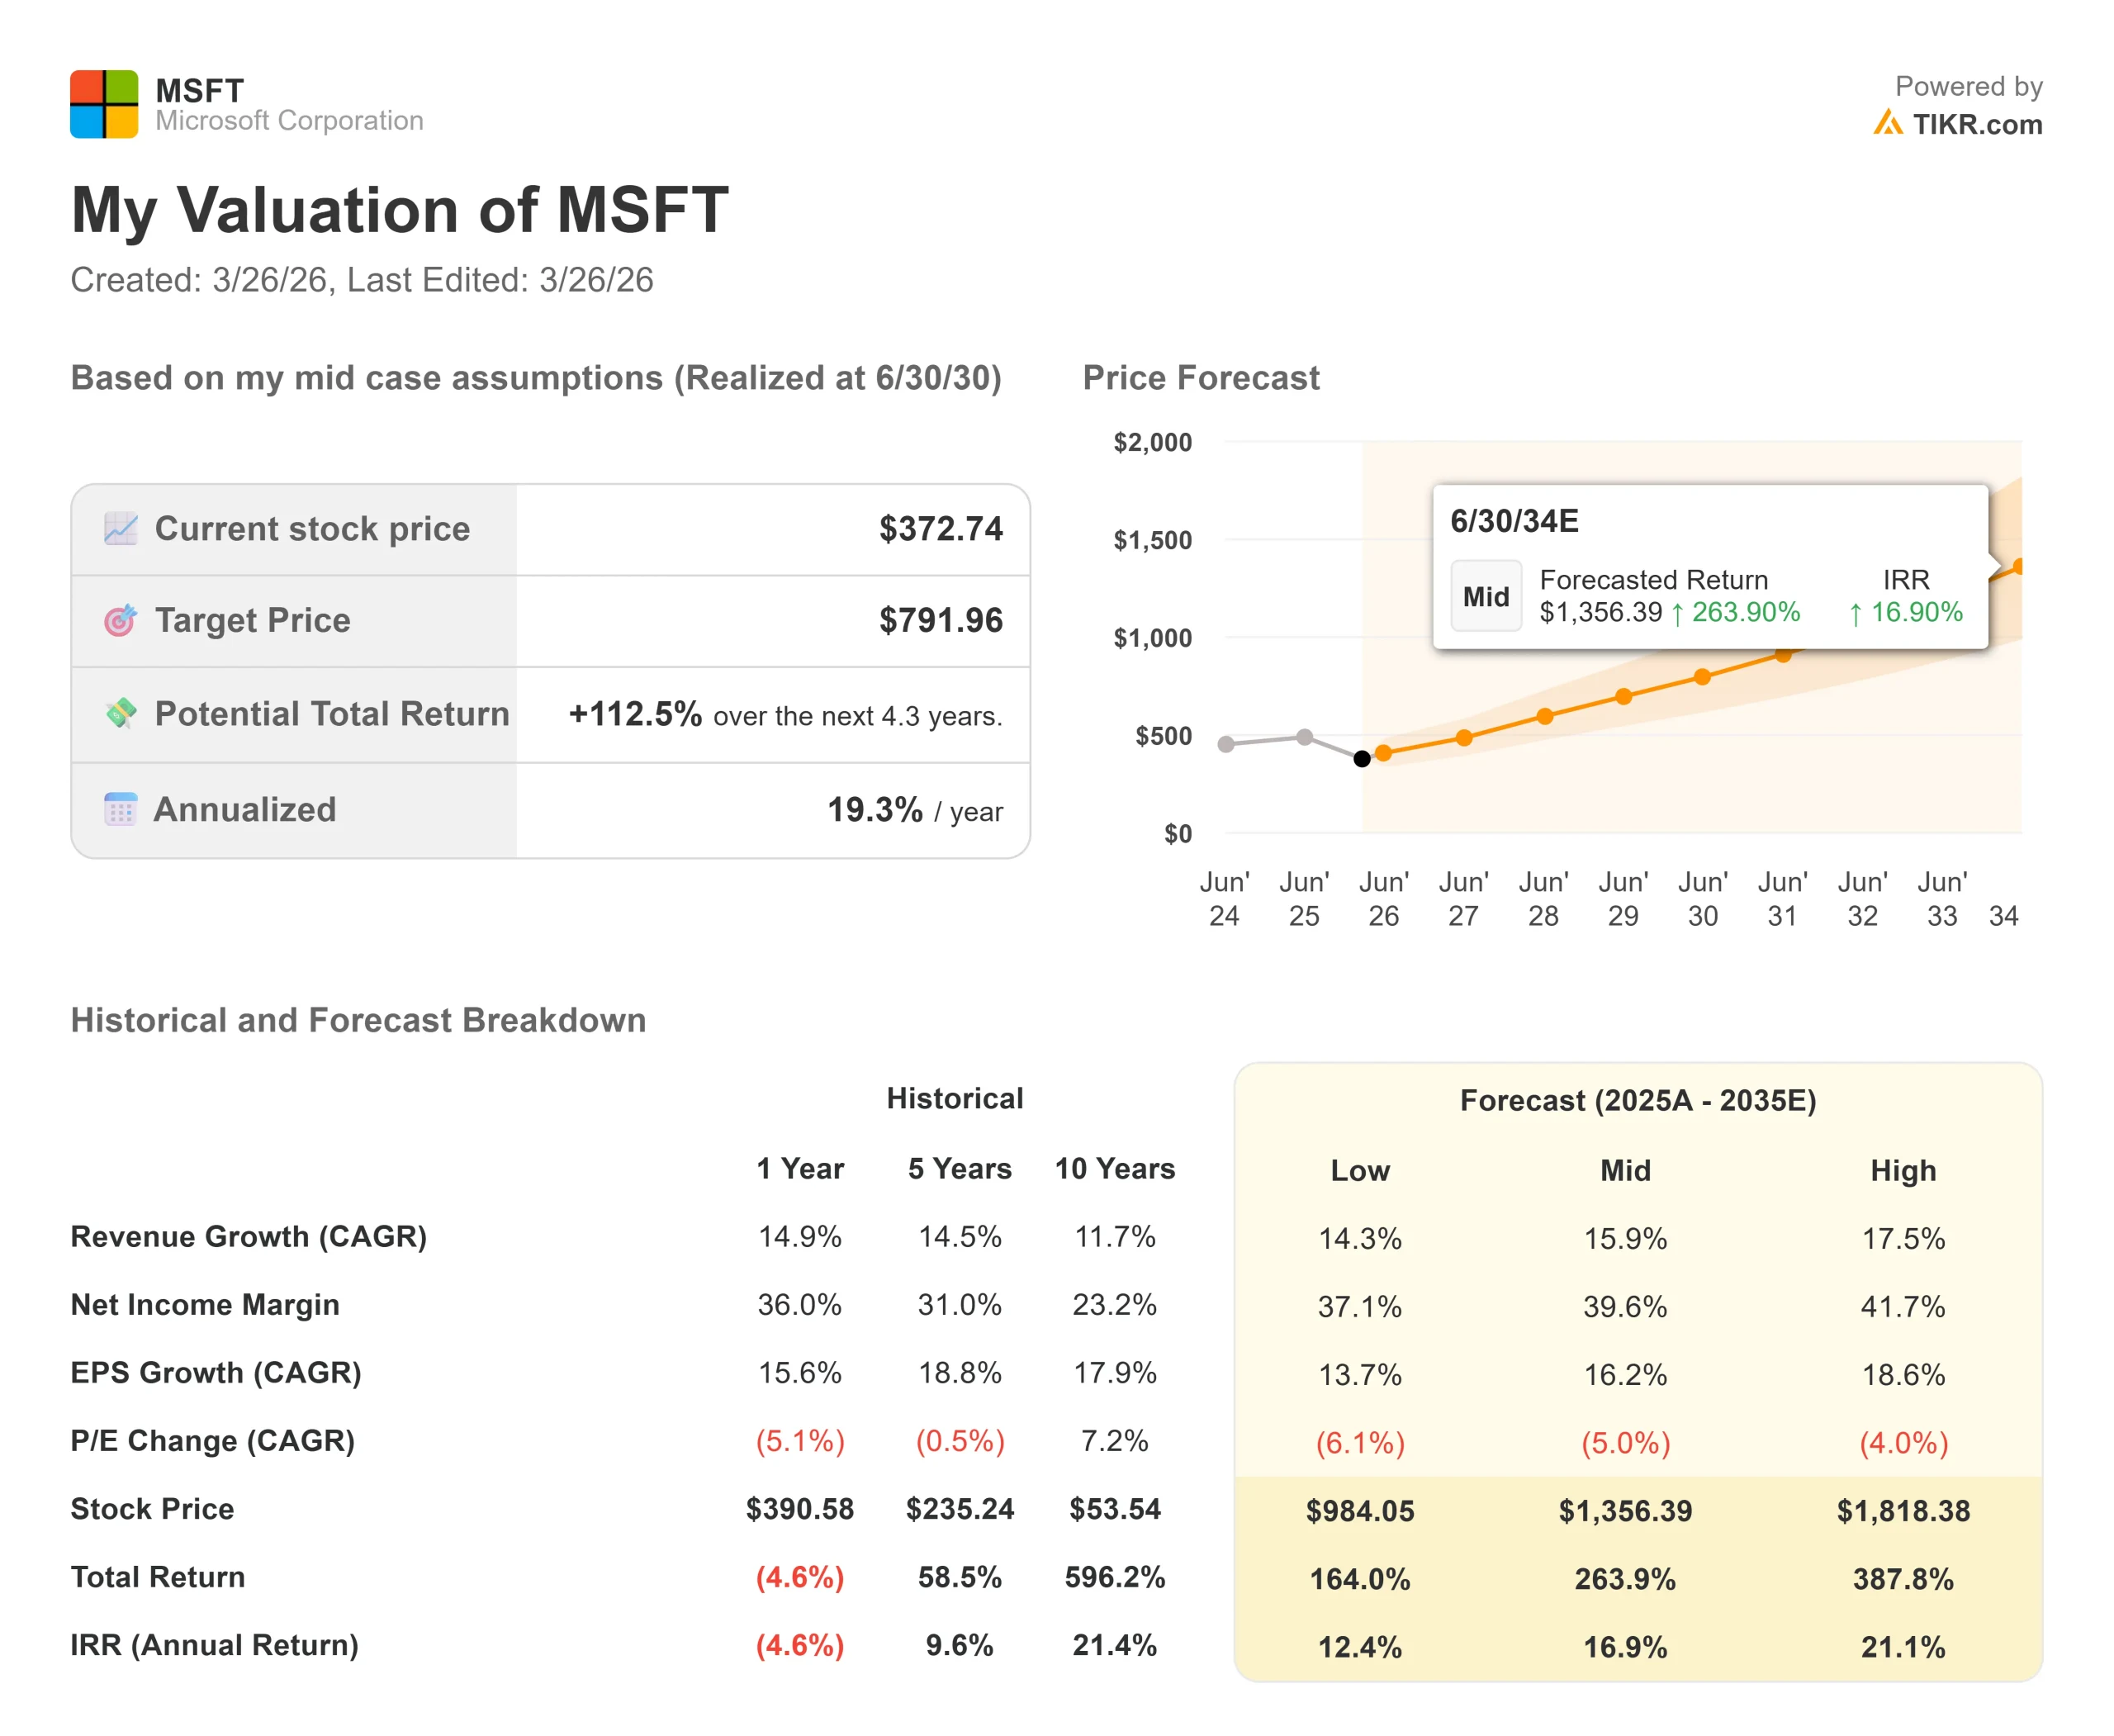
- Current Price: $372.74
- Target Price (Mid): $791.96
- Potential Total Return: +112.5%
- Annualized IRR: 19.30% / year
See analysts’ growth forecasts and price targets for Microsoft stock (It’s free!) >>>
The TIKR mid-case model targets $791.96 by 6/30/30, using a 15.9% revenue CAGR. Two drivers underpin that growth rate: Azure’s continued enterprise cloud market share gains as AI workloads scale, and Microsoft 365 Copilot monetization expanding into the 450 million information workers Nadella referenced at the Morgan Stanley conference. The margin driver is operating leverage in the Productivity and Business Processes segment, where the model targets a net income margin of 39.6%, up from 36.1% in fiscal 2025, as the capex-to-revenue ratio normalizes once the current infrastructure cycle peaks.
The high case reaches $1,818.38 by 6/30/30, requiring a 17.5% revenue CAGR and a 41.7% net income margin. Even the low case, at $984.05, still implies a 164.0% total return from today’s price, which reflects how far the stock has fallen relative to even a conservative view of the business’s long-term earnings power. The primary risk across all three scenarios is the same: CapEx continues growing faster than revenue, FCF recovery is pushed out, and the multiple contracts are further before earnings catch up. That risk is real and already substantially priced into a stock at its lowest forward multiple in three years.
Conclusion: The single metric to watch at Q3 FY2026 earnings, expected April 28, 2026, is Azure constant-currency revenue growth. Guidance calls for 37% to 38%. A print at the high end of that range, paired with any signal that capacity constraints are beginning to ease, would be the first concrete evidence that the infrastructure investment is converting to revenue on schedule. That is the data point that changes the narrative.
Microsoft at $372.74 is a company at its cheapest forward multiple in three years, with 44 analyst Buy ratings, a $591.60 Street consensus target, and a TIKR mid-case that implies 19.30% annualized returns through 6/30/30. The spending is large, the risk is real, and April 28 will go a long way toward answering whether the market’s patience has a price.
See what stocks billionaire investors are buying so you can follow the smart money with TIKR.
Should You Invest in Microsoft?
The only way to really know is to look at the numbers yourself. TIKR gives you free access to the same institutional-quality financial data that professional analysts use to answer exactly that question.
Pull up Microsoft, and you’ll see years of historical financials, what Wall Street analysts expect for revenue and earnings in the quarters ahead, how valuation multiples have moved over time, and whether price targets are trending up or down.
You can build a free watchlist to track Microsoft alongside every other stock on your radar. No credit card required. Just the data you need to decide for yourself.
Analyze Microsoft on TIKR Free →
Looking for New Opportunities?
- See what stocks billionaire investors are buying so you can follow the smart money.
- Analyze stocks in as little as 5 minutes with TIKR’s all-in-one, easy-to-use platform.
- The more rocks you overturn… the more opportunities you’ll uncover. Search 100K+ global stocks, global top investor holdings, and more with TIKR.
Disclaimer:
Please note that the articles on TIKR are not intended to serve as investment or financial advice from TIKR or our content team, nor are they recommendations to buy or sell any stocks. We create our content based on TIKR Terminal’s investment data and analysts’ estimates. Our analysis might not include recent company news or important updates. TIKR has no position in any stocks mentioned. Thank you for reading, and happy investing!