
Key Stats for Royal Caribbean Stock
- Current Price: $282.27
- Street Target (Mean): ~$348
- TIKR Target Price (Mid): ~$638
- Potential Total Return (Mid): ~126%
- Annualized IRR (Mid): ~10% / year
Now Live: Discover how much upside your favorite stocks could have using TIKR’s new Valuation Model (It’s free) >>>
What Happened?
Royal Caribbean (RCL) stock has spent most of 2026 caught between two opposing forces: a business generating record bookings and consistent earnings beats, and a macro environment that keeps reminding investors how exposed cruise lines are to oil prices and geopolitical risk.
The stock sits 23% below its 52-week high of $366.50, while the Street’s consensus target of $348.46 sits 23% above it.
The most recent catalyst came on April 17, when Iran declared the Strait of Hormuz completely open following a ceasefire between Israel and Lebanon. Crude oil futures dropped more than 14% that day, and Royal Caribbean surged roughly 9.7% as the market repriced fuel cost fears across the cruise sector. The relief was short-lived.
By April 21, Brent crude had climbed back above $95 per barrel after the U.S. seized an Iranian-flagged vessel accused of evading the blockade, and RCL gave back 1.1%.
That whipsaw defines the setup heading into Q1 earnings on April 30.
CEO Jason Liberty told CNBC on April 14 that cruise demand is “exceptionally high.” At Q4 earnings in January, Liberty said the company had just experienced “the best seven booking weeks in the company’s history” and entered 2026 two-thirds booked at record prices.
The April 30 call will reveal how much of the macro turbulence has actually touched those numbers.

See historical and forward estimates for Royal Caribbean stock (It’s free!) >>>
Is Royal Caribbean Undervalued Today?
The valuation gap between Royal Caribbean and its cruise peers is the most compelling data point right now. Royal Caribbean trades at 12.64x NTM EV/EBITDA versus 9.14x for Carnival and 8.66x for Norwegian Cruise Line, according to TIKR’s Competitors page.
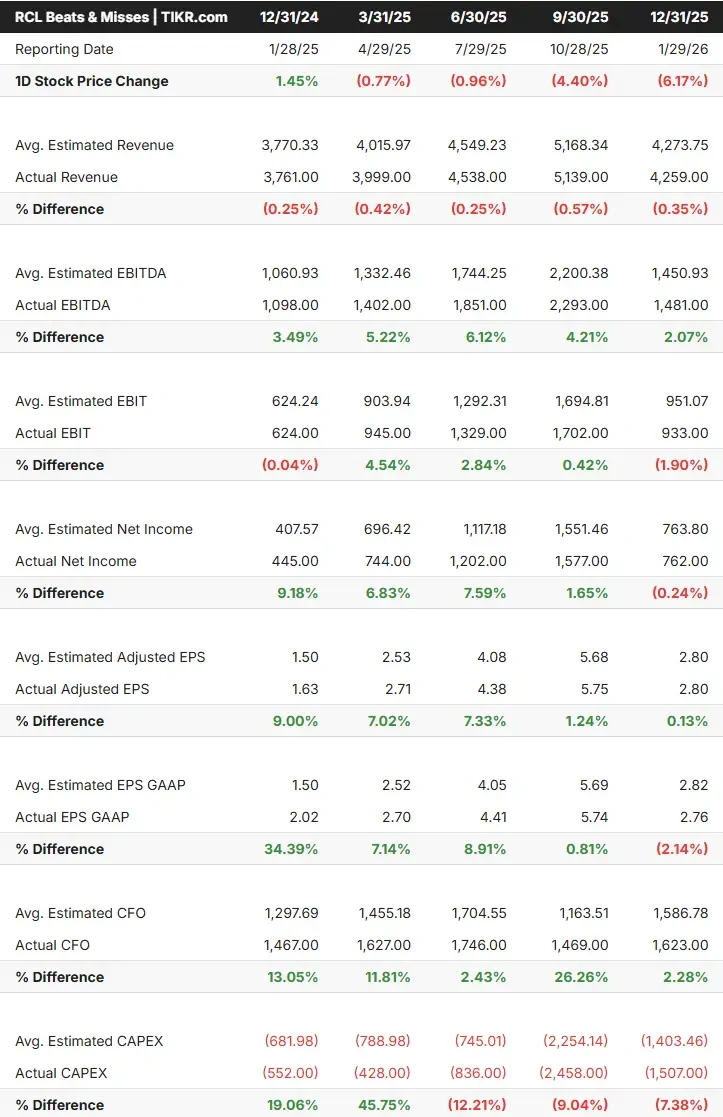
That premium has historically been justified by execution: Royal Caribbean has beaten EBITDA estimates in each of the five most recent quarters, with beats ranging from 2.07% to 6.12% per TIKR’s Beats & Misses data.
The premium also reflects a business mix that peers cannot easily replicate.
CFO Naftali Holtz noted on the Q4 call that Caribbean yields have grown 35% since 2019, and that 70% of 2026 Caribbean guests will visit a private destination, venues that generate higher onboard revenue per guest than standard port calls. Royal Caribbean’s NTM P/E of 16.21x reflects the market paying up for that structural advantage.
The bear case centers on costs and guidance risk. JPMorgan analyst Matthew Boss cut his 2026 EPS estimate for Royal Caribbean to $16.62 and trimmed his price target from $376 to $341, citing the Middle East conflict’s “CNN effect” on Eastern Mediterranean bookings and a $270 million fuel cost headwind, while keeping his Overweight rating.
That $16.62 estimate sits below management’s own full-year adjusted EPS guidance of $17.70–$18.10. UBS cut its target to $321 from $350, Stifel to $400 from $420, and BNP Paribas to $362 from $378, yet all three maintained their bullish ratings.
Of the 26 analysts covering RCL on TIKR, 19 rate it Buy or Outperform, and none rate it a Sell. The balance sheet carries $8,482 million in net debt at 2.61x Net Debt/EBITDA, which is elevated but improving as free cash flow recovered sharply to $946 million in 2025 after sitting at just $133 million in 2024.
See how Royal Caribbean performs against its peers in TIKR (It’s free!) >>>
TIKR Advanced Model Analysis
- Current Price: $282.27
- TIKR Target Price (Mid): ~$638
- Potential Total Return (Mid): ~126%
- Annualized IRR (Mid): ~10% / year

See analysts’ growth forecasts and price targets for Royal Caribbean stock (It’s free!) >>>
The TIKR mid-case model uses a revenue CAGR of around 7% through 2034. The two primary drivers are fleet expansion — Legend of the Seas debuts in Europe this summer, Hero of the Seas arrives in 2027 — adding capacity at premium pricing, and the continued buildout of private destinations that lift onboard spend per guest. Net income margin is forecast to reach around 5% (mid-case), up from 4.2% historically, as revenue growth runs ahead of a largely fixed cost base.
Even the downside scenario offers a positive return from here. The low case produces a target of ~$507 at a ~7% annualized IRR on a 6% revenue CAGR, still well above the current $282.27. The high case reaches ~$775 at a ~12% IRR. The primary risk to any scenario is a prolonged conflict that keeps fuel costs elevated and softens net yield growth below management’s 2026 guidance range of 2.1%–4.1%.
Conclusion
Watch one number on April 30: full-year 2026 net yield guidance. If management narrows or lowers that range due to fuel and geopolitical headwinds, expect a negative stock reaction. If it holds or tightens upward, the stock’s 23% pullback looks like a macro-driven entry point into a business whose fundamentals remain intact.
See what stocks billionaire investors are buying so you can follow the smart money with TIKR.
Should You Invest in Royal Caribbean?
The only way to really know is to look at the numbers yourself. TIKR gives you free access to the same institutional-quality financial data that professional analysts use to answer exactly that question.
Pull up Royal Caribbean, and you’ll see years of historical financials, what Wall Street analysts expect for revenue and earnings in the quarters ahead, how valuation multiples have moved over time, and whether price targets are trending up or down.
You can build a free watchlist to track Royal Caribbean alongside every other stock on your radar. No credit card required. Just the data you need to decide for yourself.
Analyze Royal Caribbean on TIKR Free →
Looking for New Opportunities?
- See what stocks billionaire investors are buying so you can follow the smart money.
- Analyze stocks in as little as 5 minutes with TIKR’s all-in-one, easy-to-use platform.
- The more rocks you overturn… the more opportunities you’ll uncover. Search 100K+ global stocks, global top investor holdings, and more with TIKR.
Disclaimer:
Please note that the articles on TIKR are not intended to serve as investment or financial advice from TIKR or our content team, nor are they recommendations to buy or sell any stocks. We create our content based on TIKR Terminal’s investment data and analysts’ estimates. Our analysis might not include recent company news or important updates. TIKR has no position in any stocks mentioned. Thank you for reading, and happy investing!