

If you’ve spent any time screening stocks, you’ve run into the N/A or negative number sitting in the P/E column for certain companies. For newer investors, that tends to raise an immediate question: Is this broken data, or is something actually wrong with the business? The answer is usually neither. A negative P/E ratio simply means the company is currently unprofitable, and the ratio itself becomes meaningless when the denominator turns negative.
That doesn’t mean the stock is uninvestable. Some of the most significant wealth-creation opportunities in public markets have come from companies that spent years reporting losses while building something that eventually became enormously profitable. Amazon ran at a loss for extended stretches of its early history.
So did many of the cloud infrastructure businesses that are now dominant, cash-generating franchises. The absence of current earnings doesn’t tell you much about whether a business is worth owning. What matters is understanding why earnings are negative, whether the trajectory is improving, and what the business looks like once it reaches profitability.
The challenge is that most standard valuation tools are built around earnings. When earnings don’t exist, you need a different toolkit. Investors who know how to analyze unprofitable companies have a real advantage, because the market often misprices these situations in both directions, treating every loss-making company as either uninvestable or ignoring the risk entirely.
A negative P/E ratio doesn’t tell you to avoid a stock. Instead, it tells you that the standard valuation framework doesn’t apply yet, and that you need to think differently about what the business is actually worth.
Find out what a stock’s really worth in under 60 seconds with TIKR’s new Valuation Model (It’s free)>>>
What a Negative P/E Actually Means
The price-to-earnings ratio divides a company’s stock price by its earnings per share. When earnings per share are negative, meaning the company lost money over the trailing twelve months, the resulting ratio is mathematically negative. Most financial data platforms display this as N/A rather than a negative number, because a negative P/E isn’t interpretable in the way a positive one is. You can’t say a stock trading at negative 40x earnings is cheap or expensive relative to one trading at positive 40x.

This is purely a mechanical issue with the ratio, not a judgment about the company. The P/E ratio was designed for profitable businesses, and it works well in that context. Applied to a company reporting losses, it simply breaks down. The number tells you nothing useful, which is why sophisticated investors don’t try to interpret it, instead, they move directly to metrics that remain meaningful.
It’s also worth distinguishing between different reasons a company might be unprofitable. Some companies are in heavy investment phases, deliberately spending ahead of revenue to capture market share or build infrastructure. Others are genuinely struggling with a broken business model or declining competitive position. The income statement shows the same net loss in both cases. Understanding which situation you’re looking at requires reading further into the financials and listening to what management is saying about the path forward.
Get the most up-to-date financial snapshots of 100K+ stocks with TIKR (It’s free) >>>
Why Unprofitable Companies Can Still Be Worth Analyzing
The market is essentially a discounting machine as stock prices reflect expectations about future earnings, not just current ones. A company trading at a significant premium to current fundamentals is often pricing in a future that doesn’t yet exist on the income statement, and sometimes that future arrives exactly as expected.

The most useful historical example of this dynamic is Amazon. For much of its first decade as a public company, Amazon reported minimal or negative earnings as it aggressively reinvested in logistics, technology, and new business lines. Investors who dismissed it because the trailing P/E was meaningless missed one of the most significant compounding stories in market history. The earnings eventually arrived, and when they did, they reflected a business that had built an almost unassailable competitive position during the loss years.
The question isn’t whether a company is currently profitable. The question is whether it’s on a credible path to profitability, whether the losses are funding durable competitive advantages, and whether the eventual earnings power justifies the current price. None of those questions can be answered by looking at trailing P/E.
Alternative Metrics That Actually Work
When trailing P/E isn’t useful, several other metrics carry the analytical weight instead. Revenue growth is the first place most investors look. A company growing revenue at 40% annually while reporting losses is fundamentally different from one growing at 5% with the same loss profile. Revenue growth tells you whether the business is gaining traction, even if profitability hasn’t arrived.
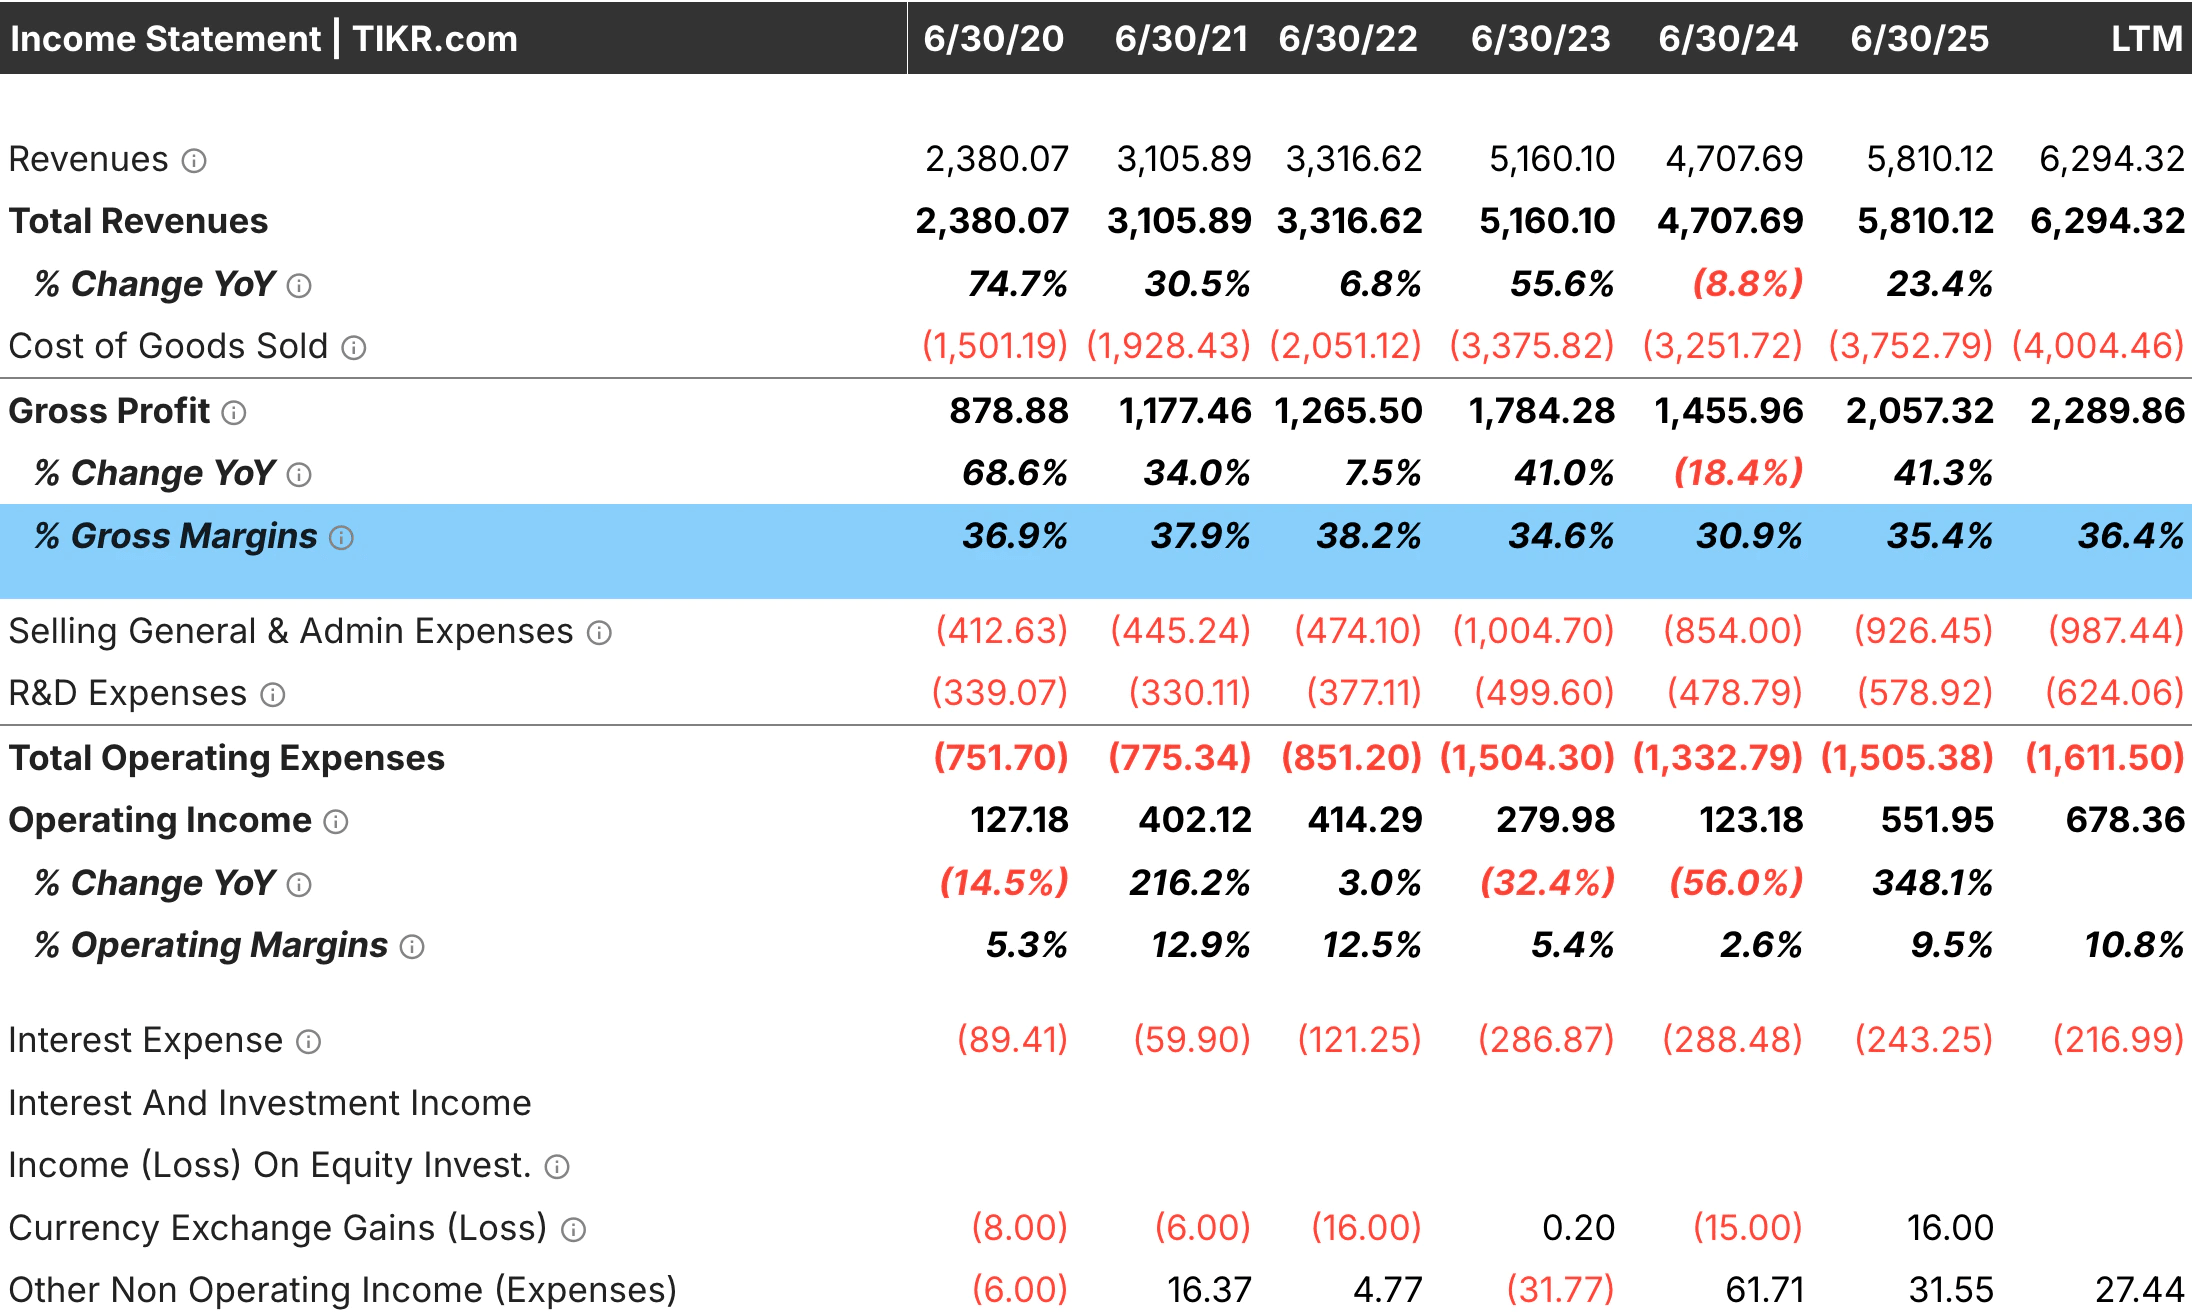
Gross margin is equally important: a company with a 30% gross margin indicates that its core product or service is highly valuable and that profitability is a deliberate choice being deferred through investment spending. A company with 20% gross margins losing money has a structural cost problem that revenue growth alone won’t fix. Gross margin is often the clearest indicator of whether the business model is fundamentally sound.
Free cash flow and operating cash flow deserve attention even when net income is negative. Some companies report accounting losses even while generating real cash, often due to non-cash charges such as depreciation, amortization, or stock-based compensation. Others report adjusted profitability while burning cash at an alarming rate. The cash flow statement tells you which situation you’re actually in, which is more relevant than the earnings figure for understanding whether the company needs to raise capital to survive.
Forward P/E and EV/EBITDA are the most commonly used valuation multiples for loss-making companies when analysts expect a path to profitability. Forward P/E uses the current price to estimate future earnings rather than trailing losses, producing a meaningful ratio if the company is expected to turn profitable within the forecast window. EV/EBITDA strips out interest, taxes, depreciation, and amortization, giving you a view of operating earnings power before those charges hit the bottom line.
Review income statements on any stock in less than 60 seconds with TIKR (It’s free) >>>
Reading the Trajectory: When the P/E Turns Positive
The most interesting moment in analyzing an unprofitable company is when the earnings trajectory starts moving clearly toward breakeven. Quarterly losses narrowing consistently, gross margins expanding as revenue scales, and operating leverage beginning to show up in the numbers are all signals that the profitability inflection is approaching.

When a company crosses from negative to positive earnings, the P/E ratio becomes meaningful for the first time. That transition can represent a significant re-rating event, as investors who had been using rough forward estimates and alternative metrics suddenly have a tangible earnings base to anchor valuation. Companies that successfully navigate this transition and sustain profitability afterward often see substantial multiple expansion as the market gains confidence in the durability of the earnings.
Watching analyst estimate revisions during this period is particularly useful. When a consensus that had been forecasting breakeven two years out starts pulling that estimate forward, it often reflects real signals from management guidance and improving financial results. That kind of revision momentum is worth tracking closely.
How to Use TIKR to Analyze Unprofitable Stocks
TIKR’s Valuation tab shows historical P/E data across multiple years, including the periods where it appears as N/A due to negative earnings. Alongside that, you can view the Detailed Financials to track earnings quarter by quarter and see how net and operating income have changed over time.
Seeing those two views together, the N/A periods giving way to an actual P/E multiple as earnings turn positive, gives you a clear picture of how the profitability story developed.
The Estimates tab is particularly useful for unprofitable companies. Forward revenue estimates, EBITDA projections, and normalized EPS forecasts from Wall Street analysts provide a forward-looking framework that trailing metrics can’t.

You can see when the analyst consensus expects the company to reach profitability, how that estimate has shifted over recent quarters, and what the forward P/E looks like once earnings are expected to turn positive. The Management Guidance subtab adds another layer, showing what the company itself has guided for revenue, margins, and cash flow, which is often the most direct signal of when profitability is coming.
Track company financials to quickly historical P/E data with TIKR (It’s free) >>>
TIKR Takeaway
A negative P/E ratio is not a red flag on its own. It’s a signal that the standard valuation framework has temporarily stopped working, and that you need to shift to metrics that remain meaningful when earnings haven’t arrived yet. Revenue growth, gross margin, cash flow, and forward estimates all carry the analytical weight that trailing P/E can’t carry.
The companies that eventually cross from unprofitable to sustainably profitable are often the most interesting investment opportunities in the market, precisely because they’re harder to analyze and the market frequently misprices them.
TIKR gives you the tools to follow these situations properly. The Valuation tab shows the historical P/E trajectory, including the N/A periods, so you can see exactly when earnings arrived and how the multiple evolved.
The Estimates tab provides forward revenue, EBITDA, and EPS projections, so you’re not flying blind with a company that hasn’t yet reached profitability. And transcript access lets you hear directly from management about the path to profitability, which is ultimately the most important variable when analyzing any unprofitable business.
Value Any Stock in Under 60 Seconds with TIKR
With TIKR’s new Valuation Model tool, you can estimate a stock’s potential share price in under a minute.
All it takes is three simple inputs:
- Revenue Growth
- Operating Margins
- Exit P/E Multiple
If you’re not sure what to enter, TIKR automatically fills in each input using analysts’ consensus estimates, giving you a quick, reliable starting point.
From there, TIKR calculates the potential share price and total returns under Bull, Base, and Bear scenarios so you can quickly see whether a stock looks undervalued or overvalued.
See a stock’s true value in under 60 seconds (Free with TIKR) >>>
Looking for New Opportunities?
- Discover which stocks billionaire investors are purchasing, so you can follow the smart money.
- Analyze stocks in as little as 5 minutes with TIKR’s all-in-one, easy-to-use platform.
- The more rocks you overturn… the more opportunities you’ll uncover. Search 100K+ global stocks, global top investor holdings, and more with TIKR.
Disclaimer:
Please note that the articles on TIKR are not intended to serve as investment or financial advice from TIKR or our content team, nor are they recommendations to buy or sell any stocks. We create our content based on TIKR Terminal’s investment data and analysts’ estimates. Our analysis might not include recent company news or important updates. TIKR has no position in any stocks mentioned. Thank you for reading, and happy investing!


