Key Stats for MSTF Stock
- Past week performance: +2.9%
- 52-week range: $349 to $554
- Valuation model target price: $923
- Implied upside: 78.9% over 2.8 years
Map Microsoft’s Azure growth against analysts’ 5-year forecasts using TIKR’s new Valuation Model (It’s free) >>>
Copilot Learns to Code, and Wall Street Takes Notice
Microsoft (MSFT) stock gained about 2.9% this week, with most of the move arriving on Friday. Shares jumped 3.7% to close near $516 after the company unveiled a redesigned Copilot. The rally left the stock roughly 48% above its 52-week low of $349. Investor tone shifted from AI spending worries toward AI monetization.
The new Copilot has three parts. Home combines chat, delegated tasks, and Word, Excel, and PowerPoint in one place. Code lets users build apps and dashboards by describing them in plain English. Autopilot acts as a persistent digital teammate that keeps working on multi-day tasks.
The business model matters more than the features. The most compute-heavy tools consume Copilot Credits on top of the base subscription. That pushes Microsoft toward a per-seat plus consumption model, so revenue grows with usage. Microsoft 365 Copilot already had more than 30 million paid seats as of Q4.

That momentum builds on a strong fiscal year. “It was a very strong close to what was a record fiscal year for us,” CEO Satya Nadella said on the Q4 earnings call. Annual revenue rose 18% to $331 billion, and Azure, Microsoft’s cloud platform, grew 43% in Q4. Going forward, the stock will likely track whether Copilot turns usage into measurable revenue.
Break down Microsoft’s revenue by cloud, productivity, and gaming segments (It’s free) >>>
Earnings Kept Climbing While the Stock Stood Still

Under valuation model assumptions realized through 6/30/29, the stock is modeled using:
- Revenue Growth (CAGR): 19.5%
- Operating Margins: 46.3%
- Exit P/E Multiple: 25.4x
Based on these inputs, the model estimates a target price of $923, implying 78.9% total upside from the current share price of $516 and a 23.4% annualized return over the next 2.8 years.
That return profile makes Microsoft look undervalued. The key reason is that its valuation reset while the business accelerated. Microsoft’s total return over the past year was just 0.3%, yet its P/E multiple fell 41.6% over that span. Earnings grew into the share price instead of the other way around.
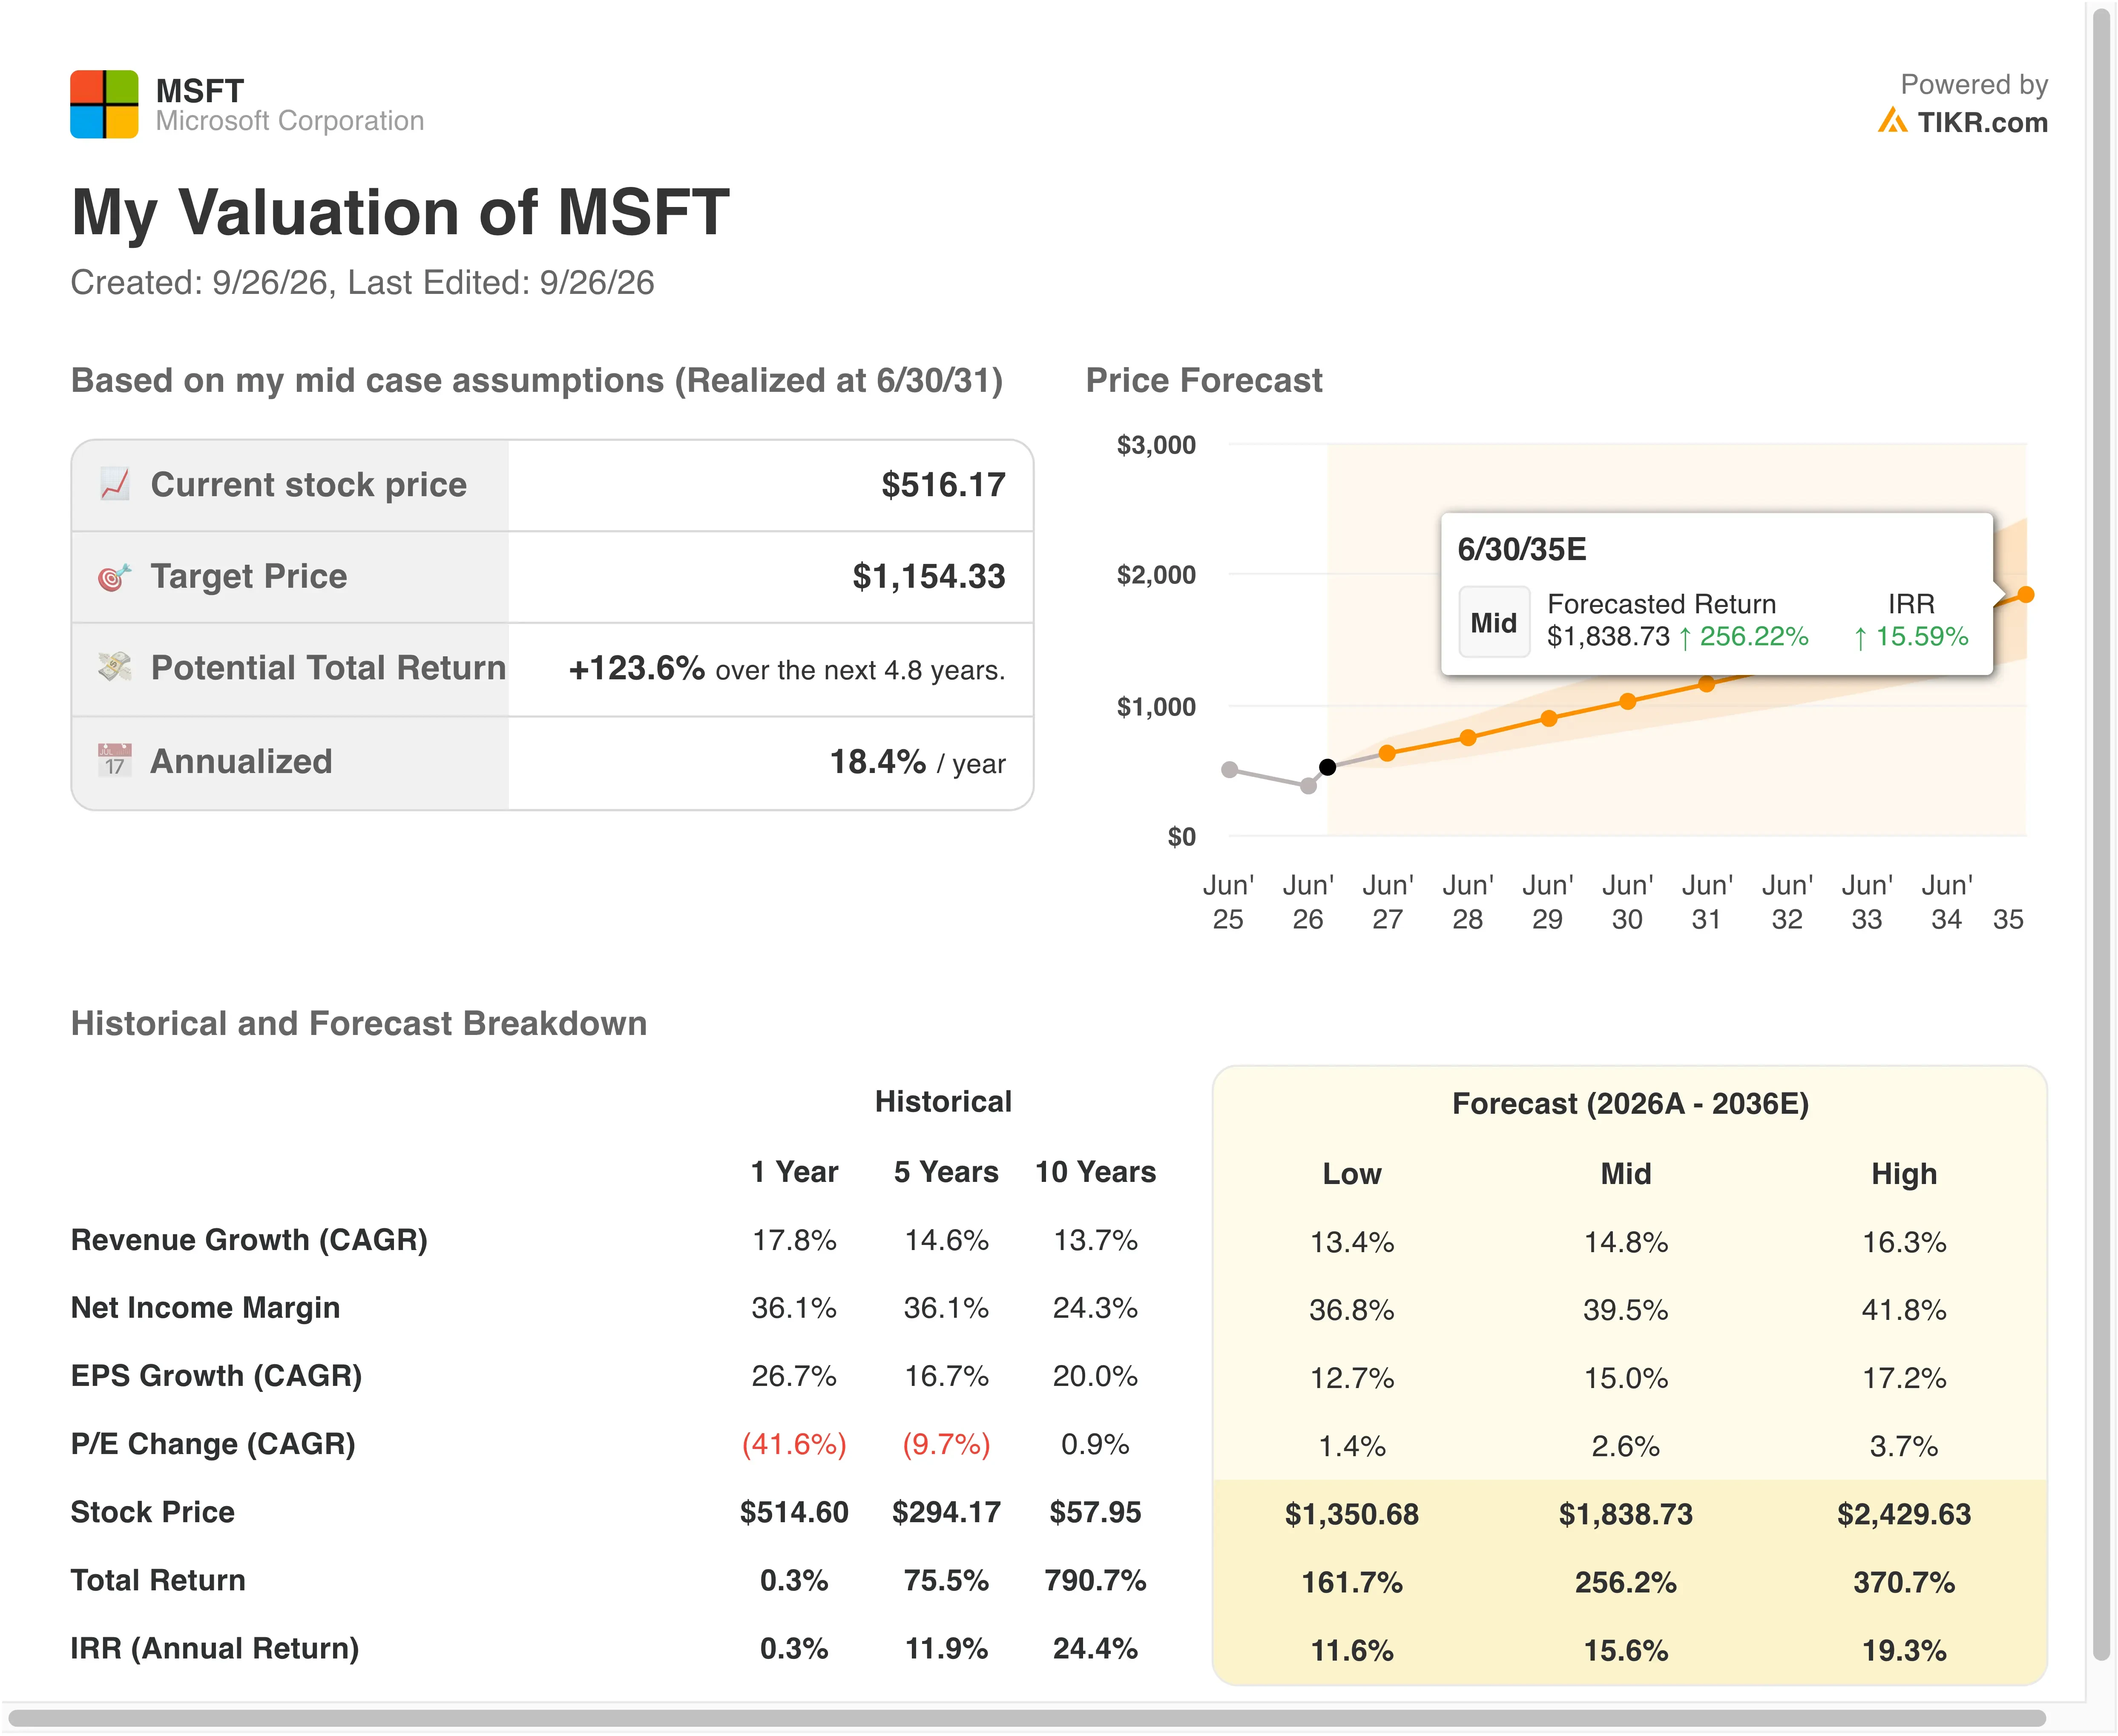
Revenue growth of 19.5% a year sits above the 17.8% pace of the past year. Azure guidance of 44% to 45% constant currency growth for fiscal Q1 supports that step up. And commercial remaining performance obligations, meaning contracted future revenue, rose 84% to $678 billion. That backlog gives the growth assumption real visibility.
Margins look achievable too. The model uses 46.3% operating margins, close to last year’s 45.6%. The main pressure comes from capital spending, which reached $41 billion in Q4 alone. Depreciation on those servers will weigh on profits, so efficiency gains need to keep pace.
Notably, the 25.4x exit multiple matches today’s level and sits below the 5-year average of 29.5x. So the model does not rely on a re-rating. Amazon and Alphabet are growing their clouds quickly, but Microsoft’s software franchise gives it a steadier earnings base.
Run a bear case on Microsoft’s capex and see how the target price changes (Free with TIKR) >>>
The Cloud Race Is Speeding Up, and Microsoft Sits in the Middle
Amazon (AMZN) still leads cloud computing through Amazon Web Services. AWS revenue grew 36.7% to $42.2 billion in Q2, its fastest pace since 2021. It also earned a 39.4% operating margin. Azure grew faster, at 43% in Microsoft’s latest quarter.
Alphabet (GOOGL) is the fastest mover. Google Cloud revenue jumped 82% to $24.8 billion in Q2, with a 35.6% operating margin. Its backlog reached $514 billion, while Microsoft’s commercial backlog stands at $678 billion. So Microsoft still holds the larger contracted pipeline, but the competition is intensifying.
Microsoft’s edge is breadth. Azure topped $100 billion in annual revenue, trailing AWS but ahead of Google Cloud. More importantly, Microsoft sells the apps that run on its cloud, from Office to GitHub. Copilot Code and Autopilot deepen that loop, because they drive both subscriptions and cloud usage.
Oracle (ORCL) shows the risk side of the AI buildout. Worries about its data center spending rattled investors this week. However, Microsoft’s LTM operating margin of 46.8% gives it a thick cushion if spending pressure spreads across the sector.
Consider whether Microsoft can sustain high margins through its AI spending cycle >>>
What’s Driving MSTF Stock Going Forward?
Azure’s growth rate is the number to watch. Management guided for 44% to 45% constant currency Azure growth in fiscal Q1. Constant currency removes exchange rate swings to show underlying demand. CFO Amy Hood said demand continues to exceed available supply.
Capacity will determine how fast that demand turns into revenue. Microsoft is planning a data center push to triple its computing power, and it expects fiscal 2027 capex to rise year over year. That spending unlocks growth but also raises the bar for returns.
Copilot adoption is the second catalyst. Code reaches Frontier program customers at the end of September, with a broader rollout afterward. Autopilot expands its private preview at the same time. Early data on paid Copilot Credits could reshape revenue expectations.
Fiscal Q1 results should confirm whether revenue lands within guidance of $89.9 billion to $91.0 billion. Longer term, Microsoft gave DARPA hands-on access to its Majorana 2 quantum system in Maryland. That is a validation step rather than a product, yet it keeps Microsoft in the quantum race.
Screen Microsoft’s forward P/E against its 10-year range before Q1 results (Free with TIKR) >>>
Should You Invest in Microsoft?
The only way to really know is to look at the numbers yourself. TIKR gives you free access to the same institutional-quality financial data that professional analysts use to answer exactly that question.
Pull up MSTF, and you’ll see years of historical financials, what Wall Street analysts expect for revenue and earnings in the quarters ahead, how valuation multiples have moved over time, and whether price targets are trending up or down.
You can build a free watchlist to track MSTF alongside every other stock on your radar. No credit card required. Just the data you need to decide for yourself.
Analyze MSTF stock on TIKR Free→
Disclaimer:
Please note that the articles on TIKR are not intended to serve as investment or financial advice from TIKR or our content team, nor are they recommendations to buy or sell any stocks. We create our content based on TIKR Terminal’s investment data and analysts’ estimates. Our analysis might not include recent company news or important updates. TIKR has no position in any stocks mentioned. Thank you for reading, and happy investing!