Key Stats for AAPL Stock
- Past week performance: +0.6%
- 52-week range: $243 to $345
- Valuation model target price: $374
- Implied upside: 9.6% over 2.0 years
Test whether Apple’s premium valuation holds up under your own iPhone assumptions (It’s free) >>>
Test whether Apple’s premium valuation holds up under your own iPhone assumptions
Apple (AAPL) stock rose about 0.6% this week to close near $341, just shy of its 52-week high of $345. The move was quiet, but the tone around the stock remains confident. Shares have climbed roughly 34% over the past year. Investors spent the week digesting a key licensing deal and new hardware.
The most important update came from Qualcomm. The two companies renewed their global patent license, effective April 1, 2027. The prior agreement was due to expire on March 31, 2027. So Apple keeps access to essential cellular technology while it builds its own modem chips.
Apple also began selling new Mac mini and Mac Studio models on September 22. The M6 Mac mini is Apple’s first Mac built on a 2-nanometer process, a smaller and more efficient chip design. Meanwhile, the Mac Studio can carry up to 512GB of memory for running AI models locally. That pitch targets professionals who want to cut recurring cloud bills.

Demand is not the problem. On his final earnings call as CEO, Tim Cook said supply constraints reflect “a demand forecast issue, to be candid, where the iPhone and the Mac are both doing remarkably better than we thought they would do.” iPhone revenue grew 22% to $54.3 billion that quarter, while Mac sales rose 29%. Going forward, the question is whether supply catches up to support September quarter guidance of 9% to 11% growth.
Review Apple’s growth by iPhone, Mac, and Services before the next earnings report (It’s free) >>>
A Great Business Priced Like One
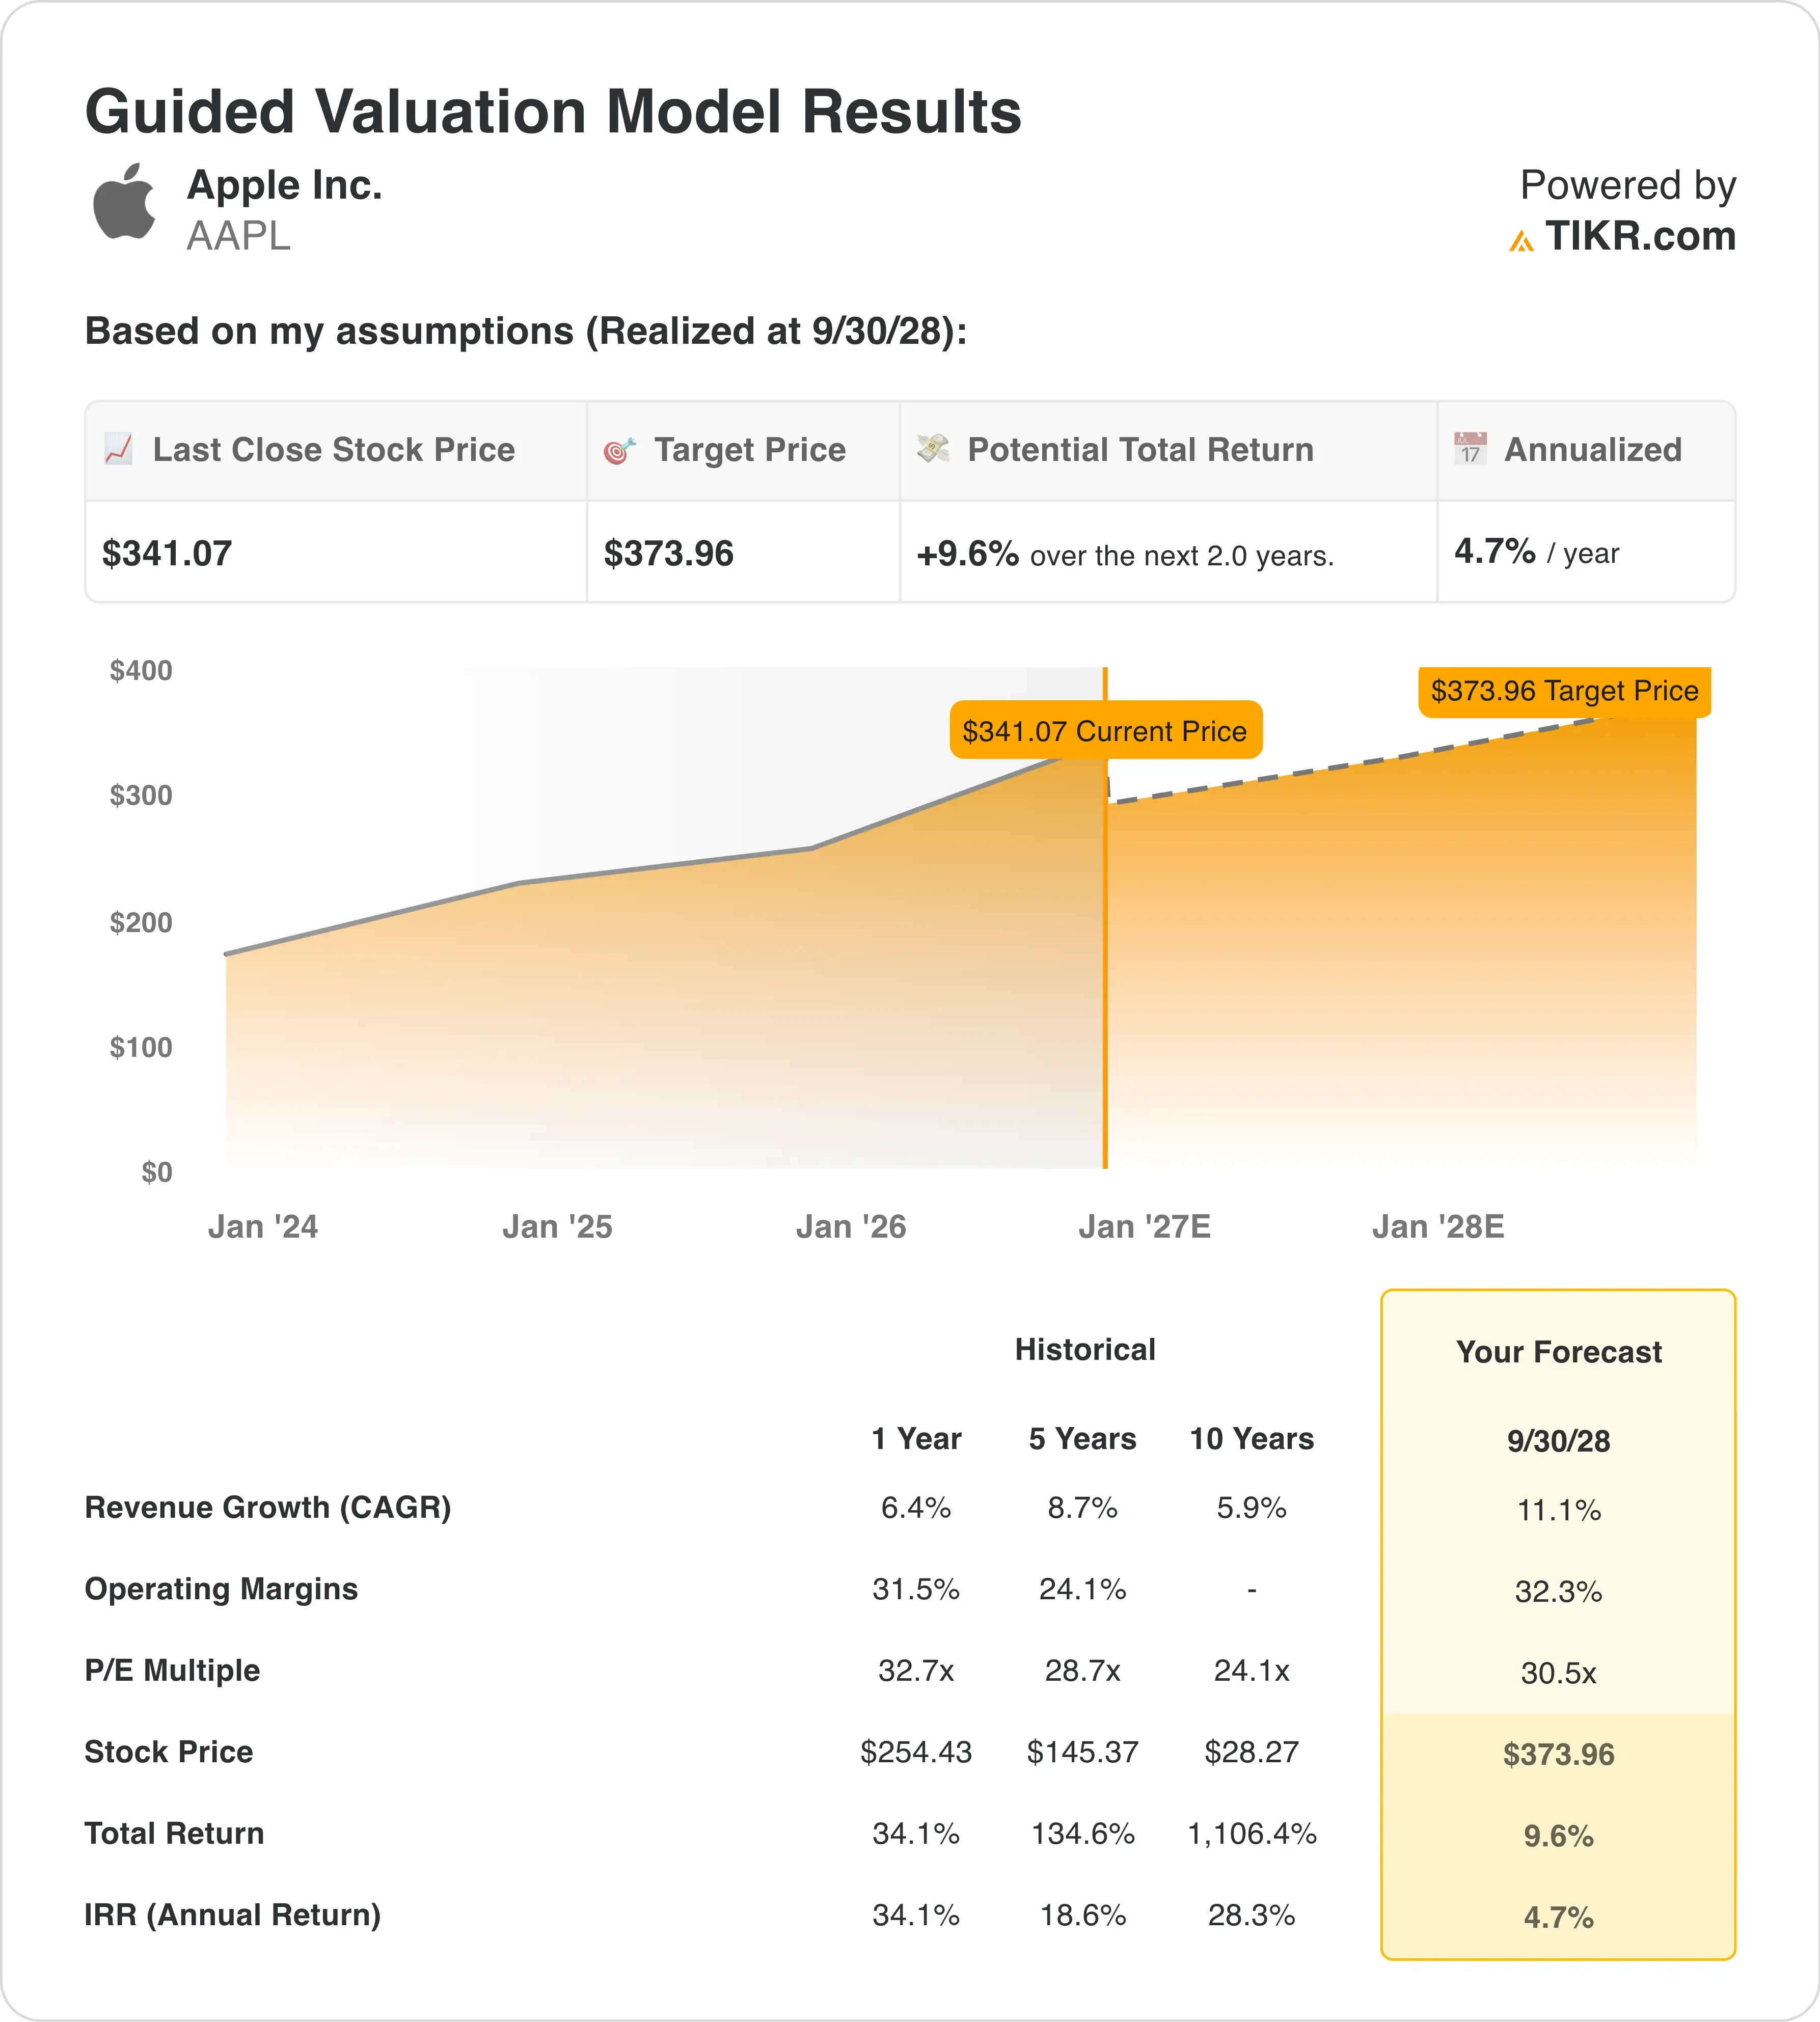
Under valuation model assumptions realized through 9/30/28, the stock is modeled using:
- Revenue Growth (CAGR): 11.1%
- Operating Margins: 32.3%
- Exit P/E Multiple: 30.5x
Based on these inputs, the model estimates a target price of $374, implying 9.6% total upside from the current share price of $341 and a 4.7% annualized return over the next 2.0 years.
These assumptions are not stingy. Revenue growth of 11.1% a year would beat Apple’s 8.7% 5-year average and its 6.4% pace over the past year. Operating margins of 32.3% also edge above last year’s 31.5%. So the model already credits Apple with a strong iPhone 18 cycle.
The problem is the starting price. Apple trades at 37.1x forward earnings, well above its 5-year average P/E of 28.7x. The model’s 30.5x exit multiple assumes some cooling from today’s level. That multiple compression absorbs most of the earnings growth.
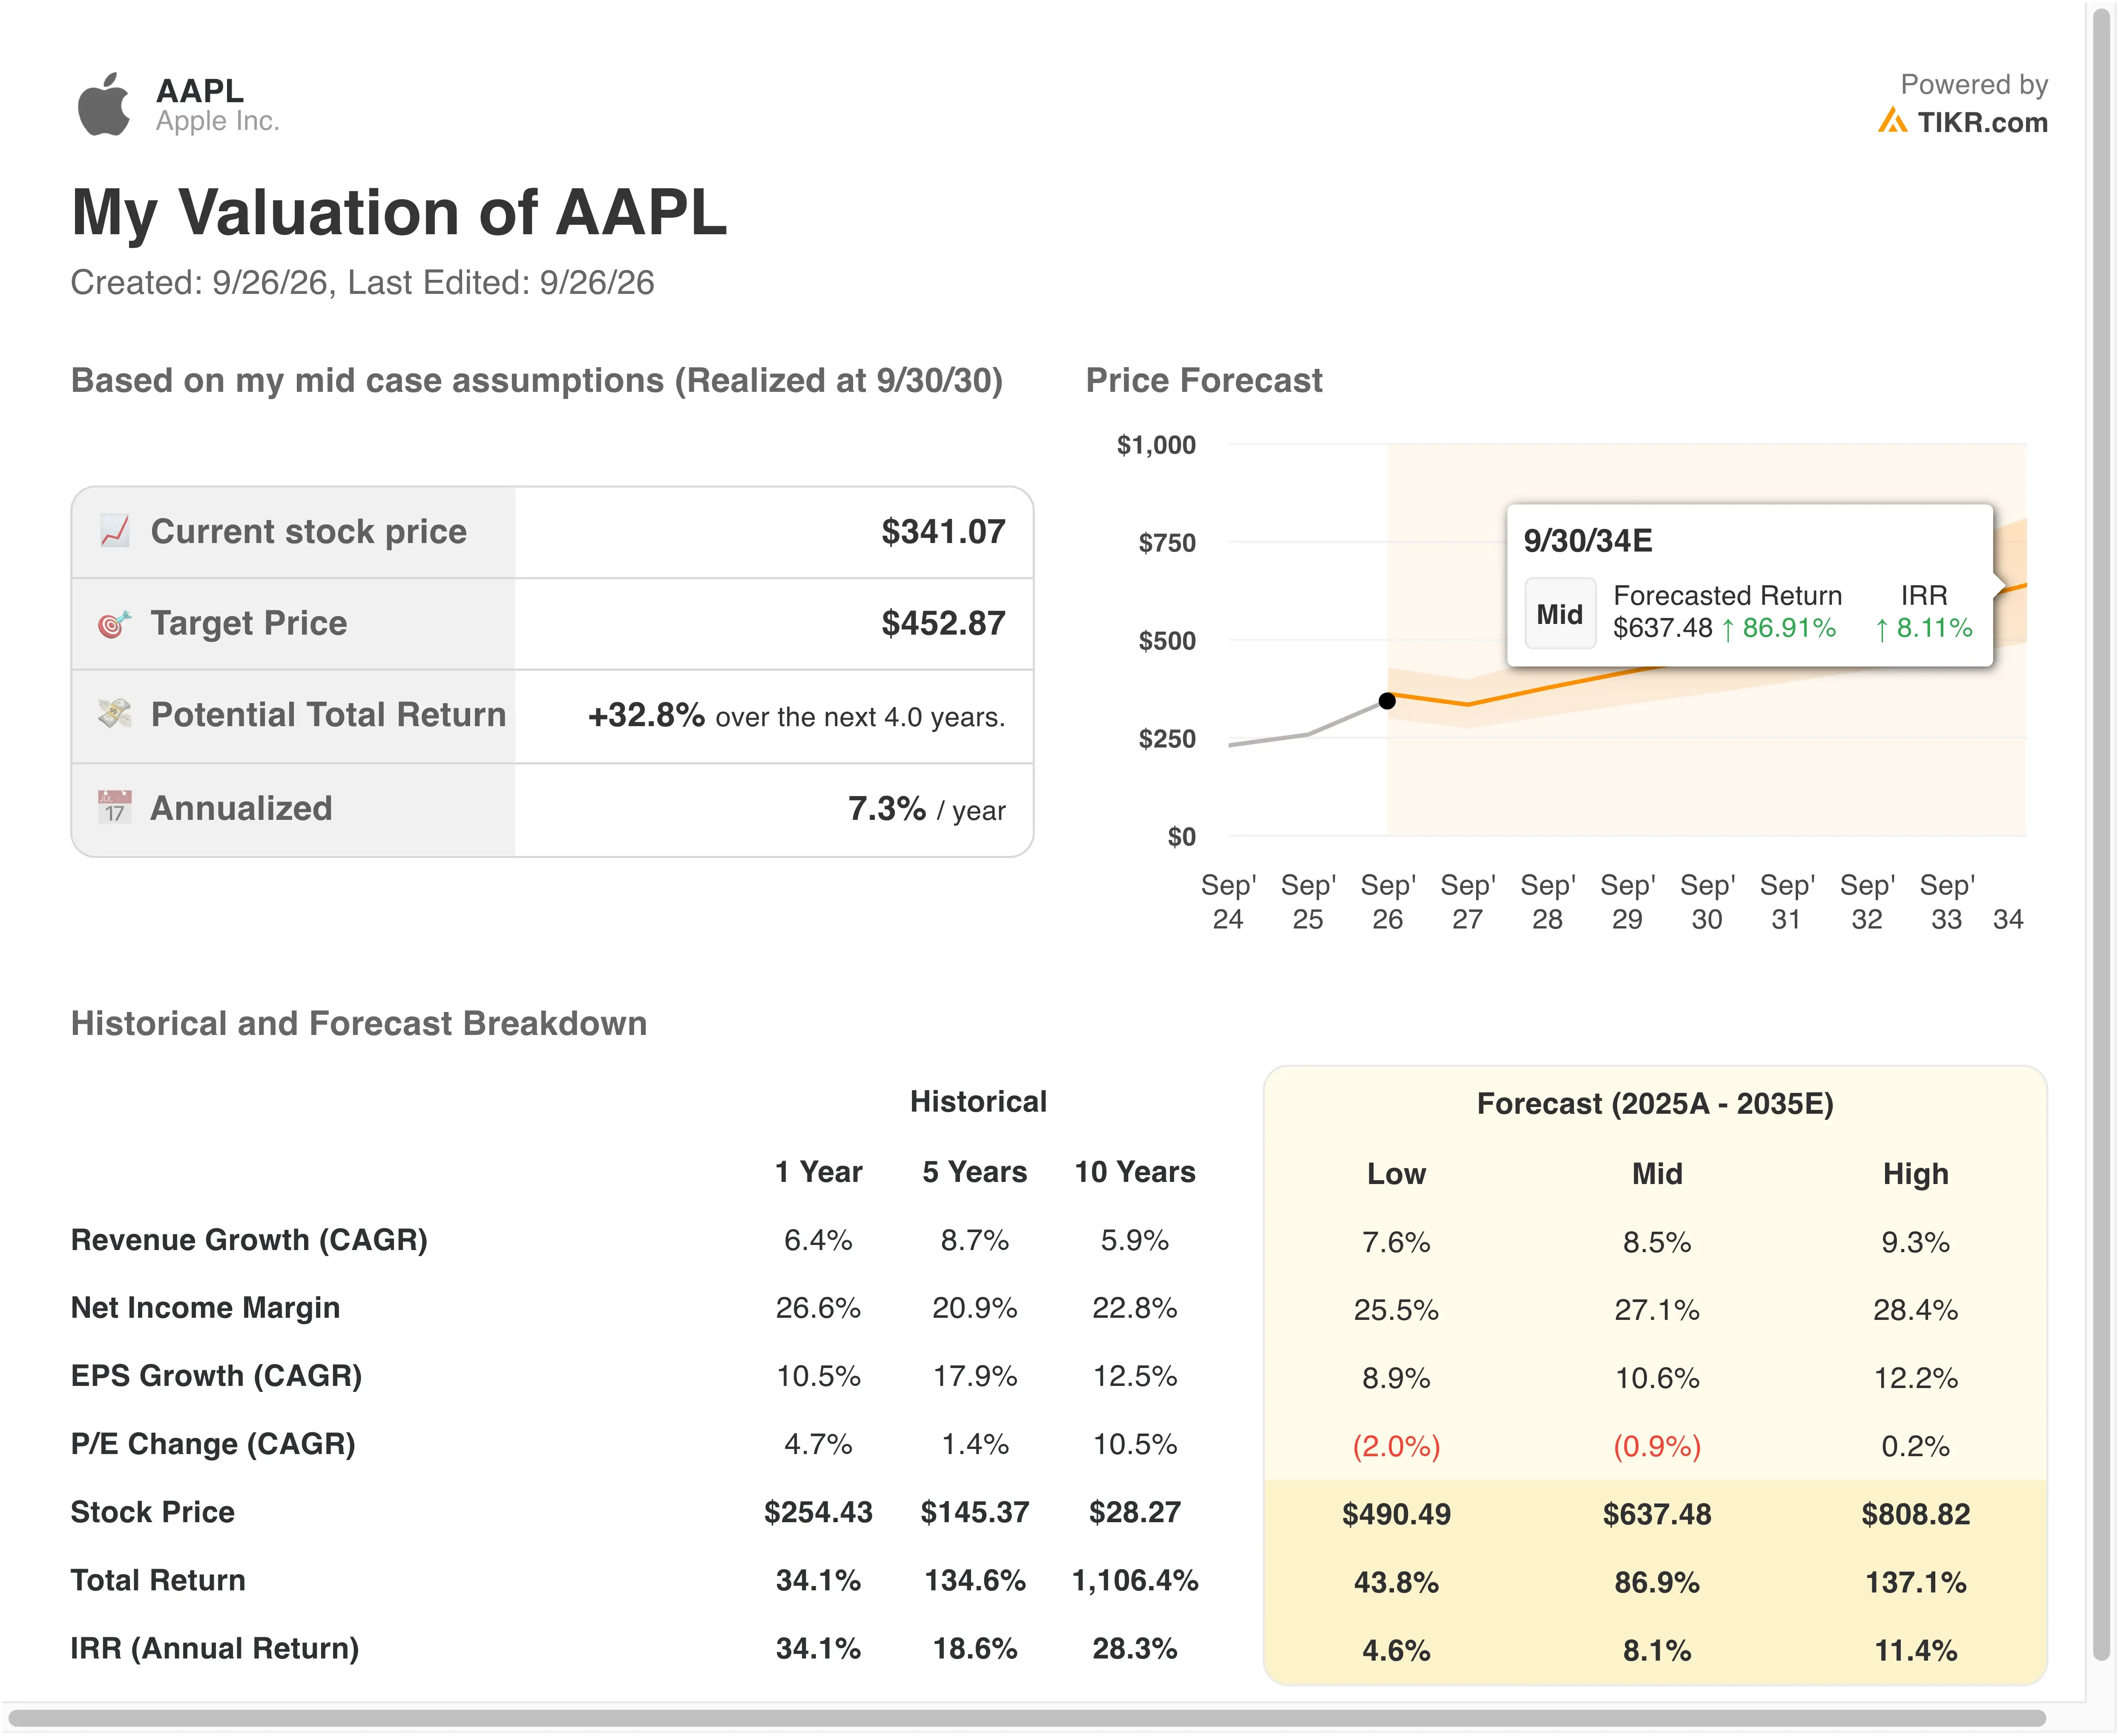
At a 4.7% annual return, the stock looks fully valued rather than cheap. That sits below the 5% level where upside starts looking limited. Microsoft also offers faster expected growth at a lower multiple, which makes Apple’s premium harder to justify on numbers alone.
None of this makes Apple a broken story. Instead, future gains likely need to come from earnings upside rather than a higher multiple. A faster AI upgrade cycle, driven by the new Siri, is the most realistic path to beating the model.
Apple’s Premium Stands Out Against Microsoft and Nvidia
Apple’s AI hardware push puts it closer to Microsoft (MSFT) and Nvidia (NVDA) than ever. Its new Macs aim to lower the cost of running AI, a market dominated by Nvidia chips and Windows PCs. That comparison also exposes a clear valuation gap.
Microsoft trades at 26.1x forward earnings, well below Apple’s 37.1x. Yet analysts expect Microsoft’s revenue to grow 18.7% a year over the next two years, compared with 12.6% for Apple. Microsoft also runs a higher LTM operating margin of 46.8% versus Apple’s 33.2%.
Nvidia’s numbers are even more striking. Analysts forecast 77.8% annual revenue growth over two years, while its LTM P/E is 28.4x versus Apple’s 39.1x. And Nvidia’s LTM operating margin reaches 65.2%. On growth and profitability, Apple is paying more for less.
Apple’s moat is different, though. It has more than 2.5 billion active devices, which gives every new service a massive built-in audience. Alphabet (GOOGL) is testing that loyalty with $899 Googlebook laptops built around Gemini AI. That matches the starting price of the new M6 Mac mini, putting Apple’s ecosystem strength to a direct test.
See whether Apple’s services growth and buybacks can lift the stock toward $271 by 2027 >>>
What’s Driving AAPL Stock Going Forward?
The iPhone 18 cycle is the main near-term driver. Apple priced the iPhone 18 Pro at $1,199, the Pro Max at $1,299, and its first foldable, the iPhone Duo, at $1,999. Higher prices could lift average selling prices, meaning more revenue per phone sold. Supply of advanced chips remains the constraint to watch.
Fiscal Q4 results, expected around October 29, will give the first read on that launch. Management guided for 9% to 11% revenue growth, including a 2.5 point currency headwind. Gross margin guidance of 47% to 48% includes a one-point benefit from tariff refunds.
AI remains the swing factor. Apple rolled out its new Siri in beta in English, with five more languages planned. Google’s Gemini helps power the personalized experience. If Siri drives upgrades, earnings could beat the model’s assumptions.
Leadership and legal changes add another layer. John Ternus has succeeded Tim Cook as CEO, with Cook moving to executive chairman. Separately, the U.S. government opposed part of the contempt finding against Apple in the Epic Games case at the Supreme Court. A favorable outcome could ease pressure on App Store economics.
Build an Apple forecast that reflects the iPhone 18 pricing reset (Free with TIKR) >>>
Should You Invest in Apple?
The only way to really know is to look at the numbers yourself. TIKR gives you free access to the same institutional-quality financial data that professional analysts use to answer exactly that question.
Pull up AAPL, and you’ll see years of historical financials, what Wall Street analysts expect for revenue and earnings in the quarters ahead, how valuation multiples have moved over time, and whether price targets are trending up or down.
You can build a free watchlist to track AAPL alongside every other stock on your radar. No credit card required. Just the data you need to decide for yourself.
Analyze AAPL stock on TIKR Free→
Disclaimer:
Please note that the articles on TIKR are not intended to serve as investment or financial advice from TIKR or our content team, nor are they recommendations to buy or sell any stocks. We create our content based on TIKR Terminal’s investment data and analysts’ estimates. Our analysis might not include recent company news or important updates. TIKR has no position in any stocks mentioned. Thank you for reading, and happy investing!