Key Takeaways:
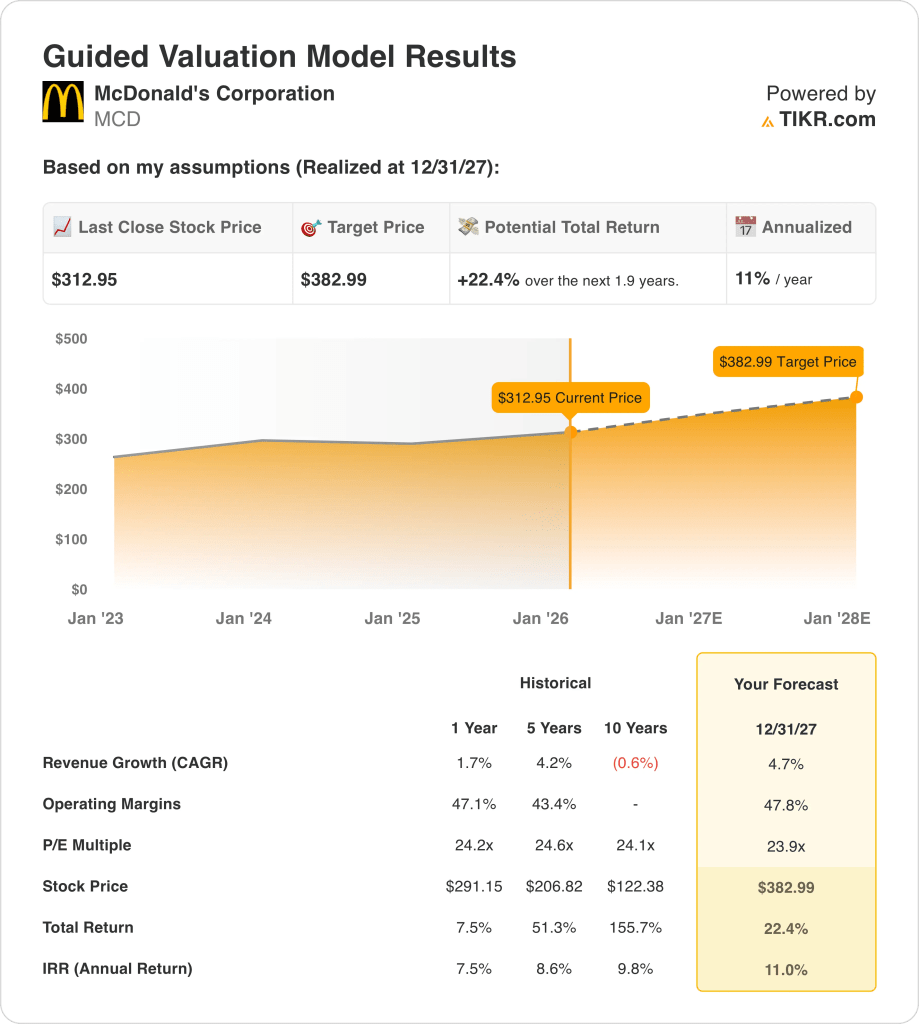
- Price Projection: McDonald’s stock could reach $383 by 2027, reflecting valuation support from stable franchise cash flows and margin resilience.
- Potential Upside: This implies 22% total upside from the current price of $313, supported by earnings growth rather than multiple expansion.
- Margin Profile: Operating margins of 48% highlight McDonald’s asset-light franchise model and strong pricing discipline across global markets.
- Annual Return: The model implies roughly 11% annualized returns over 2 years, aligning with McDonald’s historical return profile
McDonald’s (MCD) is a global franchise restaurant system, and generating stable cash flows from scale economics across thousands of locations worldwide.
Recent pricing actions in Canada and value-focused promotions reflect defensive positioning as consumers adjust spending amid higher living costs.
McDonald’s stock produced $26 billion in LTM revenue, confirming steady top-line expansion supported by franchise fees and menu price increases.
MCD stock’s operating income reached roughly $12 billion, with 46% operating margins reflecting cost discipline and a highly profitable franchised model.
Despite 48% margins and a $200 billion market cap, the stock trades at 24x earnings, testing valuation durability.
What the Model Says for MCD Stock
We analyzed McDonald’s stock using predictable franchise revenues, operating margins near 47.8%, and disciplined capital returns supporting defensive global positioning.
Based on 4.7% revenue growth, 47.8% operating margins, and a 23.9x exit multiple, the model projects steady earnings expansion.
That implies a $383 target price, representing 22.4% total upside and an 11.0% annualized return over 1.9 years.
Our Valuation Assumptions
TIKR’s Valuation Model lets you plug in your own assumptions for a company’s revenue growth, operating margins, and P/E multiple, and calculates the stock’s expected returns.
Here’s what we used for MCD stock:
1. Revenue Growth: 4.7%
McDonald’s revenue expanded modestly over the past decade, reflecting a mature global footprint supported by franchised royalties and steady international restaurant count growth.
Revenue growth slowed to about 2% annually as softer consumer spending offset pricing and digital gains.
Future growth hinges on value-menu resets, delivery expansion, and international licensing amid competitive pricing pressure.
Consensus estimates project 4.7% revenue growth, reflecting pricing discipline and stable demand without aggressive traffic recovery.
2. Operating Margins: 47.8%
McDonald’s historically sustained operating margins between 43% and 47%, supported by a heavily franchised model and limited exposure to direct labor costs.
Margins improved toward 48% as franchise mix increased, technology investments scaled, and supply-chain efficiencies stabilized following prior inflation disruptions.
Margin durability depends on franchisee health, commodity cost control, and marketing efficiency, while risks include sustained discounting and regulatory wage pressures in key markets.
In line with analyst consensus projections, operating margins near 47.8% balance structural efficiency with normalization risks across labor, food inputs, and global promotional activity.
3. Exit P/E Multiple: 23.9x
McDonald’s shares historically traded between roughly 24× and 25× earnings during periods of stable growth, reflecting defensive cash flows and brand durability.
Current valuation embeds investor caution around long-term growth ceilings, despite consistent earnings delivery and dependable capital return programs.
Multiple support requires steady same-store sales, franchise stability, and sustained margins, while downside risk emerges if pricing power weakens amid heightened competition.
Based on street consensus estimates, a 23.9× exit multiple reflects balanced expectations for mature growth, resilient profitability, and continued income-oriented investor demand.
What Happens If Things Go Better or Worse?
McDonald’s stock outcomes depend on franchise economics, pricing discipline, and cost control, creating a range of execution-driven paths through 2029.
- Low Case: If value competition pressures traffic and costs, revenue grows around 3.9% with margins near 32.7% → 4.6% annualized return.
- Mid Case: With core execution holding steady, revenue growth near 4.4% and margins improving toward 34.5% → 9.8% annualized return.
- High Case: If pricing strength and efficiency persist, revenue reaches about 4.8% and margins approach 35.8% → 14.4% annualized return.

How Much Upside Does It Have From Here?
With TIKR’s new Valuation Model tool, you can estimate a stock’s potential share price in under a minute.
All it takes is three simple inputs:
- Revenue Growth
- Operating Margins
- Exit P/E multiple
If you’re not sure what to enter, TIKR automatically fills in each input using analysts’ consensus estimates, giving you a quick, reliable starting point.
From there, TIKR calculates the potential share price and total returns under Bull, Base, and Bear scenarios so you can quickly see whether a stock looks undervalued or overvalued.
See a stock’s true value in under 60 seconds (Free with TIKR) >>>
Looking for New Opportunities?
- See what stocks billionaire investors are buying so you can follow the smart money.
- Analyze stocks in as little as 5 minutes with TIKR’s all-in-one, easy-to-use platform.
- The more rocks you overturn… the more opportunities you’ll uncover. Search 100K+ global stocks, global top investor holdings, and more with TIKR.
Disclaimer:
Please note that the articles on TIKR are not intended to serve as investment or financial advice from TIKR or our content team, nor are they recommendations to buy or sell any stocks. We create our content based on TIKR Terminal’s investment data and analysts’ estimates. Our analysis might not include recent company news or important updates. TIKR has no position in any stocks mentioned. Thank you for reading, and happy investing!