Key Stats for PG Stock
- Past-Week Performance: 4%
- 52-Week Range: $138 to $180
- Valuation Model Target Price: $178
- Implied Upside: 19% over 2.4 years
What Happened?
Procter & Gamble stock (PG) rose about 4% over the past week, trading near recent highs as shares rebounded following earlier consumer demand concerns.
During a January 22 media call, management noted U.S. sales volumes declined 1%, China consumer sentiment remained weak, and premium products lifted units but carried lower margins.
Just last week, management highlighted U.S. sales volumes declined 1%, China consumer sentiment remained weak, and premium product sales increased units but generated lower margins.
Investors appeared to focus on January commentary emphasizing international growth, sustained marketing investment, and continued AI spending, which offset near-term softness already reflected in prior expectations.
Moreover, on January 26, P&G disclosed a routine insider share disposal by Chief Brand Officer Marc Pritchard, which did not materially influence sentiment or trading activity.
These developments did not prompt changes to P&G’s guidance or long-term strategy, and the stock move reflected existing expectations rather than a shift in underlying business conditions.
Is PG Stock Fairly Valued Right Now?
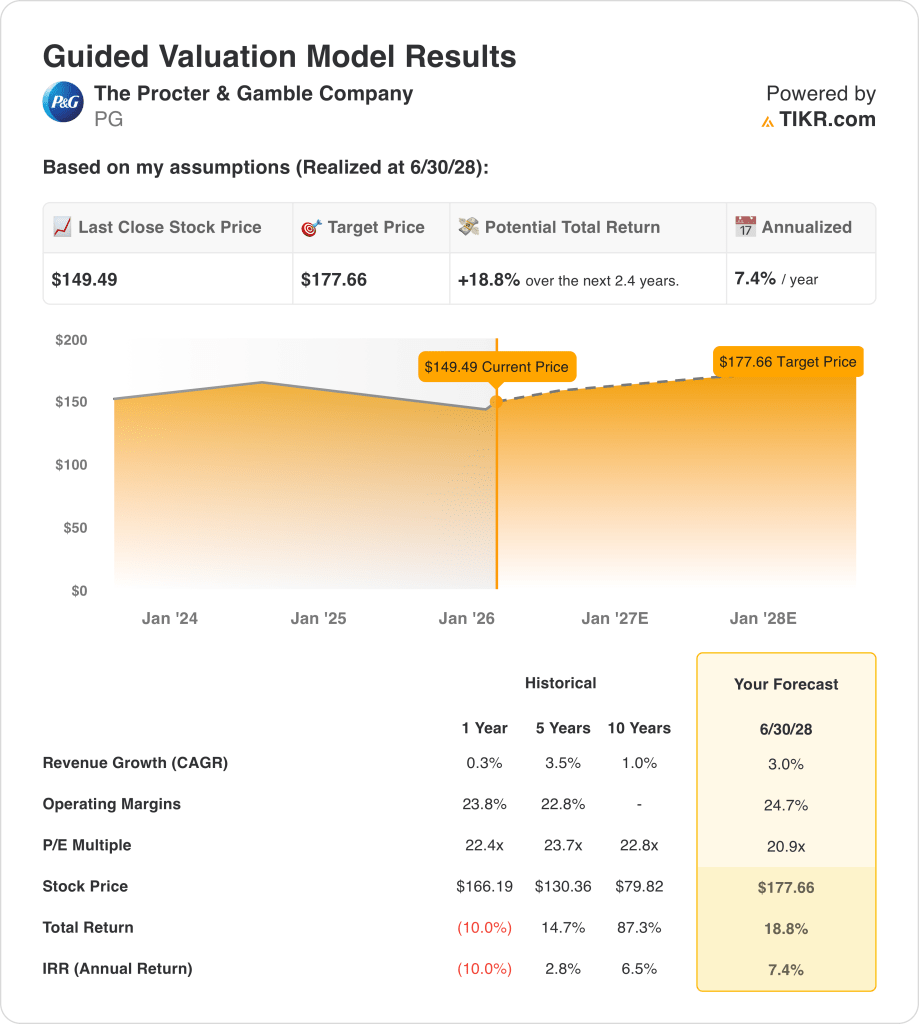
Under the valuation model shown, the stock is modeled using:
- Revenue Growth: 3%
- Operating Margins: 24.7%
- Exit P/E Multiple: 20.9x
Under valuation assumptions through June 2028, Procter & Gamble stock outcomes depend on execution across growth, margins, and valuation assumptions.
The model assumes 3.0% revenue growth, operating margins of 24.7%, and an exit P/E multiple of 20.9x by fiscal 2028.
Based on these inputs, the model estimates a $177.66 target price, implying 18.8% total upside and a 7.4% annualized return.
Results rely on international growth, pricing discipline, marketing scale, and productivity gains offsetting softer U.S. volumes.
Procter & Gamble stock reflects execution risk and consumer demand uncertainty, leaving returns sensitive to operating performance.
Value Any Stock in Under 60 Seconds (It’s Free)
With TIKR’s new Valuation Model tool, you can estimate a stock’s potential share price in under a minute.
All it takes is three simple inputs:
- Revenue Growth
- Operating Margins
- Exit P/E Multiple
From there, TIKR calculates the potential share price and total returns under Bull, Base, and Bear scenarios so you can quickly see whether a stock looks undervalued or overvalued.
If you’re not sure what to enter, TIKR automatically fills in each input using analysts’ consensus estimates, giving you a quick, reliable starting point.
See a stock’s true value in under 60 seconds (Free with TIKR) >>>