Key Stats for AMD Stock
- Past-Week Performance: 12%
- 52-Week Range: $76 to $267
- Valuation Model Target Price: $401
- Implied Upside: 55% over 1.9 years
What Happened?
Advanced Micro Devices (AMD) stock rose about 12% over the past week, trading near the $250 level as shares extended gains following a strong rally earlier this month.
Last week’s move followed Bernstein raising its price target to $225 from $220, reflecting increased confidence in AMD’s AI execution.
Bernstein acknowledged progress in AMD’s AI roadmap while noting customer concentration risk, with OpenAI currently the only sizable Helios server customer.
The brokerage also highlighted that the OpenAI ramp begins later this year, reducing pressure on near-term AI revenue expectations despite longer-term optimism.
Bernstein’s note left AMD’s guidance, demand trends, and long-term outlook unchanged.
The move reflects a recalibration of expectations rather than a deterioration in the underlying business, following reinforcement of the existing AI narrative.
Is AMD Stock Fairly Valued Right Now?
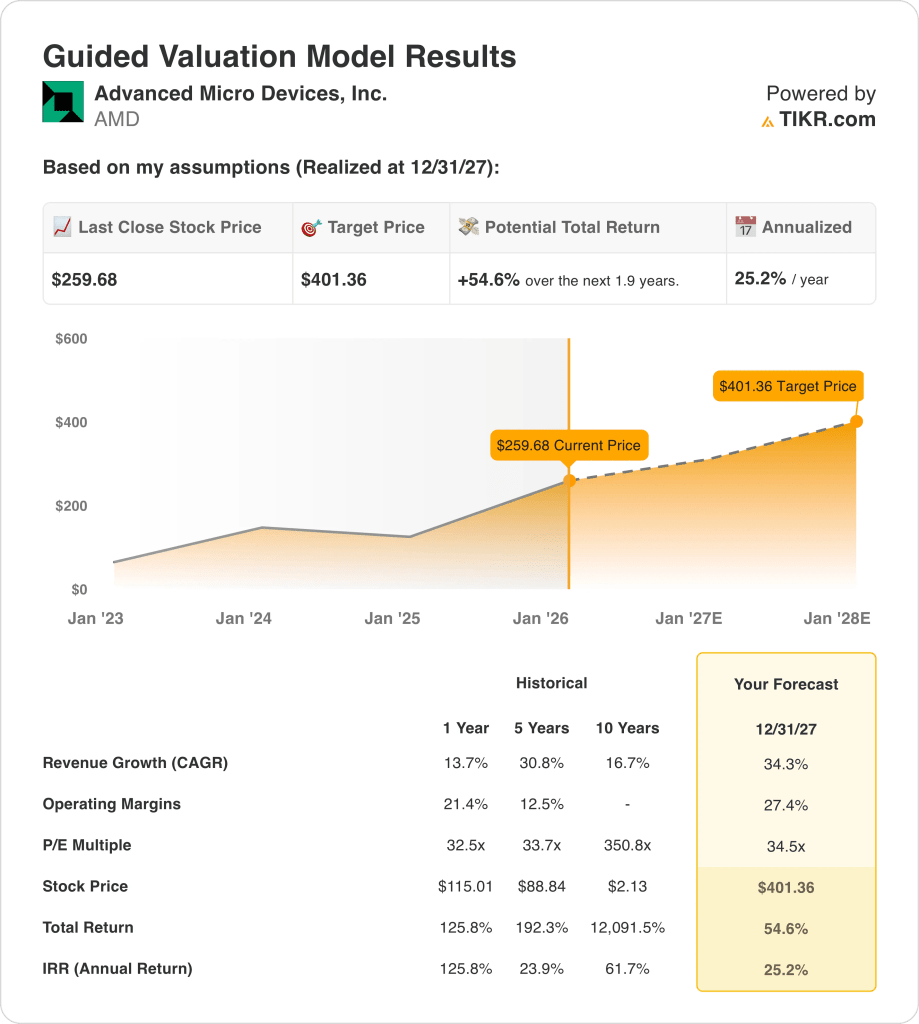
Under the valuation model shown, the stock is modeled using:
- Revenue Growth: 34.3%
- Operating Margins: 27.4%
- Exit P/E Multiple: 34.5x
Under valuation model assumptions through 2027, AMD outcomes depend on execution across growth, margins, and valuation inputs.
The model assumes 34.3% revenue CAGR, 27.4% operating margins, and a 34.5x exit P/E multiple by 2027.
Based on these inputs, the model estimates a $401 target price, implying 54.6% total upside, or 25.2% annualized returns.
Execution depends on sustained AI-driven demand, customer expansion beyond OpenAI, pricing leverage, and margin improvement from scale and product mix.
AMD stock valuation reflects execution risk and sensitivity to assumptions, meaning outcomes may vary despite strong recent momentum and elevated expectations.
Value Any Stock in Under 60 Seconds (It’s Free)
With TIKR’s new Valuation Model tool, you can estimate a stock’s potential share price in under a minute.
All it takes is three simple inputs:
- Revenue Growth
- Operating Margins
- Exit P/E Multiple
From there, TIKR calculates the potential share price and total returns under Bull, Base, and Bear scenarios so you can quickly see whether a stock looks undervalued or overvalued.
If you’re not sure what to enter, TIKR automatically fills in each input using analysts’ consensus estimates, giving you a quick, reliable starting point.