Key Stats for Cencora Stock
- This week’s performance: 0.3%
- 52-week range: $238 to $378
- Valuation model target price: $437
- Implied upside: 23.7% over 2.7 years
Value your favorite stocks like Cencora with 5 years of analysts’ forecasts using TIKR’s new Valuation Model (It’s free) >>>
What Happened?
Cencora, Inc. (COR) stock traded slightly higher this week, with shares closing near $353 on January 23, 2026, as investors weighed steady fundamentals against a premium valuation.
The move came during a quiet news period after Cencora’s appearance at the 44th Annual JP Morgan Healthcare Conference on January 12, where management’s participation reinforced confidence in the company’s positioning across U.S. and international pharmaceutical distribution.
The stock has already delivered a strong 43.7% total return over the past year, so trading action this week largely reflected investors consolidating gains rather than reacting to new company‑specific announcements.
With the next major catalyst expected to be Cencora’s fiscal Q1 2026 earnings report on February 4, short‑term price moves have been modest as the market waits for updated guidance on revenue growth, margin trends, and cash generation.
The company will also host its Annual General Meeting and a shareholder/analyst call on March 5, which could include further strategic commentary on capital allocation, international expansion, and service offerings.
Until those events, trading is likely to follow broader healthcare and market sentiment, because there have been no major fundamental surprises since the recent conferences and dividend announcement in late 2025.
See analysts’ growth forecasts and price targets for Cencora (It’s free) >>>
Is Cencora Stock Undervalued?
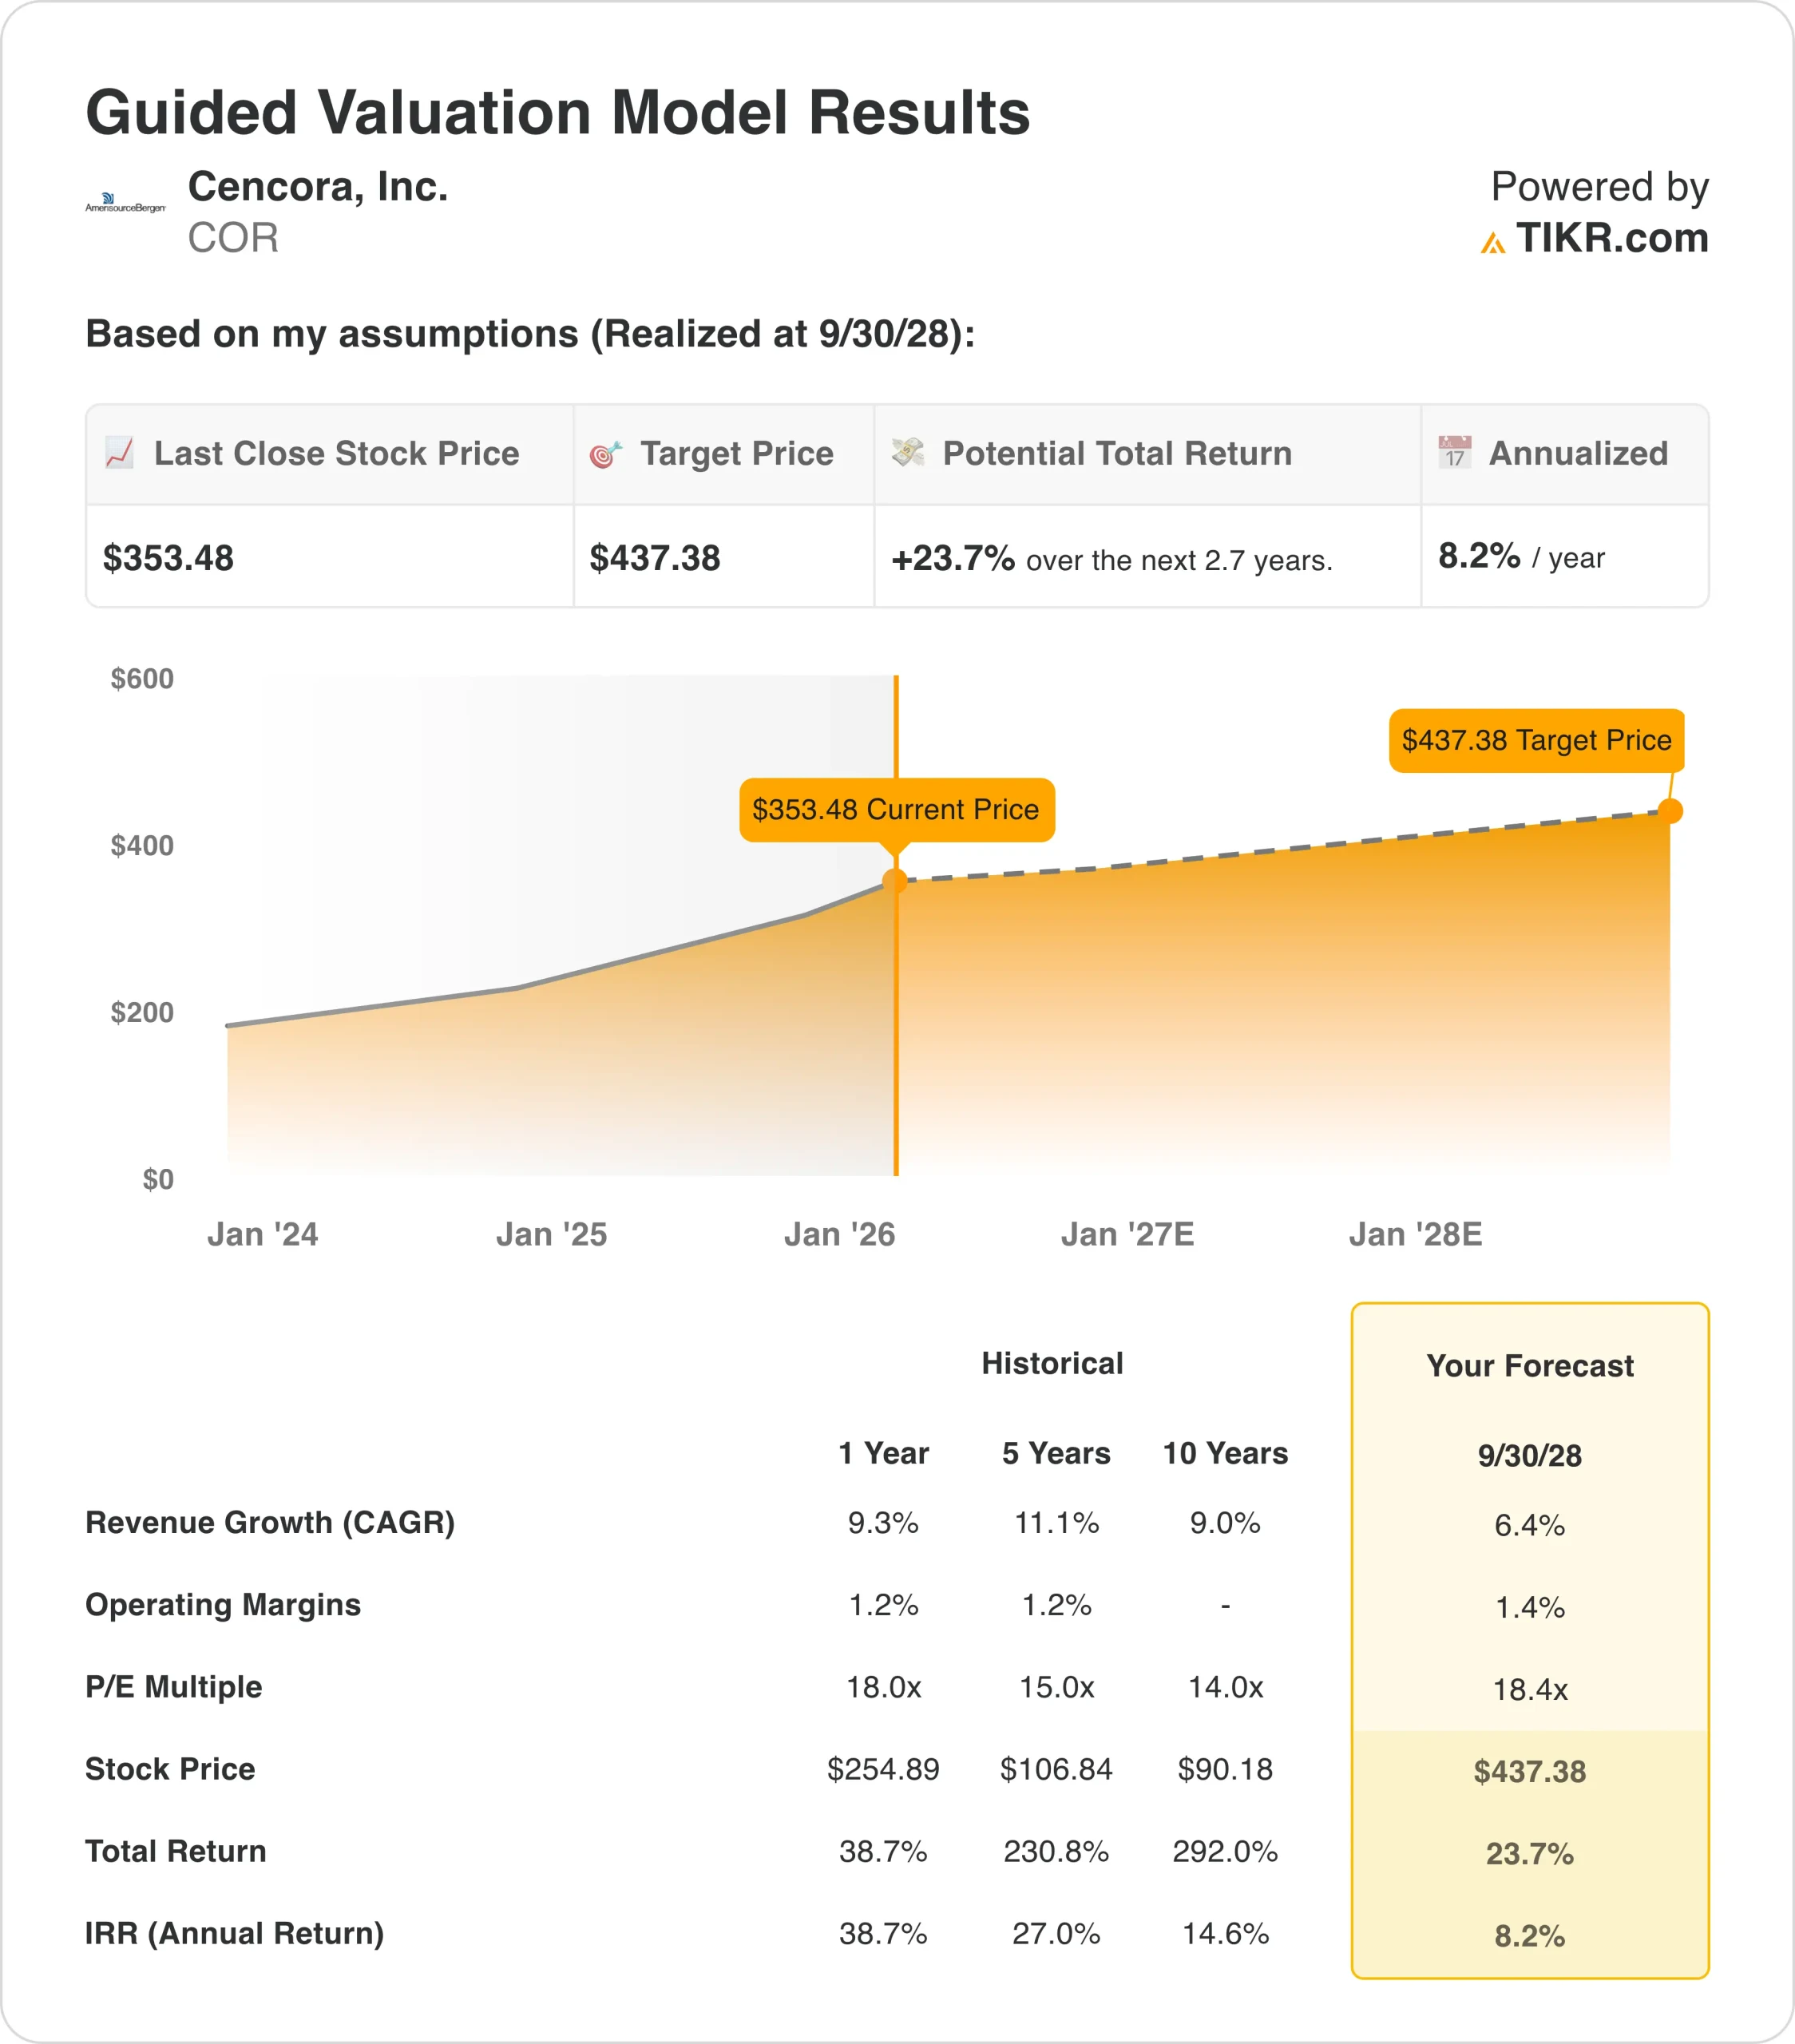
Under the valuation model assumptions realized through September 2028, the stock is modeled using:
- Revenue growth (CAGR): 6.4%
- Operating margins: 1.4%
- Exit P/E multiple: 18.4x
Based on these inputs, the model estimates a target price of $437, implying a 23.7% potential total return from the current share price of $353 and an 8.2% annualized return over the next 2.7 years.
These assumptions are broadly in line with Cencora’s recent growth trajectory, but they reflect some moderation relative to its last three‑year EPS growth rate as the business scales.
The target multiple of 18.4x sits below the current LTM P/E of 44.4x and slightly below the NTM P/E of 20.1x, which suggests that the modeled upside depends on both continued earnings growth and some normalization in valuation.
Business execution remains the key driver behind those assumptions because Cencora’s growth is closely tied to prescription volumes, specialty drug demand, and its ability to win and retain large distribution contracts.
Estimate a company’s fair value instantly (Free with TIKR) >>>
Value Any Stock in Under 60 Seconds (It’s Free)
With TIKR’s new Valuation Model tool, you can estimate a stock’s potential share price in under a minute.
All it takes is three simple inputs:
- Revenue Growth
- Operating Margins
- Exit P/E Multiple
From there, TIKR calculates the potential share price and total returns under Bull, Base, and Bear scenarios so you can quickly see whether a stock looks undervalued or overvalued.
If you’re not sure what to enter, TIKR automatically fills in each input using analysts’ consensus estimates, giving you a quick, reliable starting point.
See a stock’s true value in under 60 seconds (Free with TIKR) >>>