

Stock screeners transform the search for undervalued stocks from guesswork into a systematic process. Instead of relying on tips, headlines, or random discovery, you define specific criteria and let the screener surface companies that meet them. A universe of thousands of stocks becomes a manageable list of candidates worth researching.
The challenge is knowing what to screen for. Undervaluation is not as simple as a low P/E ratio. A stock can appear cheap on one metric while being expensive on another. It can look undervalued relative to the market while being fairly priced for its specific circumstances. The most effective screens combine multiple valuation measures with quality filters that eliminate companies that are cheap for good reasons.
Many investors run screens that are either too broad or too narrow. A screen with minimal criteria returns hundreds of stocks, most of which are cheap because their businesses are deteriorating. A screen with excessive criteria returns nothing, filtering out even legitimately undervalued companies. The goal is finding the balance that surfaces genuine opportunities while keeping the list focused enough for thorough research.
This guide explains how to build effective screens for undervalued stocks, which metrics matter most, how to avoid common traps, and how to use TIKR’s Global Screener to find opportunities the market may be overlooking.
Why Stock Screeners Work for Finding Value
Markets are generally efficient, but not perfectly so. Thousands of stocks trade on global exchanges, and even professional investors cannot analyze every company in depth. This creates pockets of inefficiency where stocks become mispriced because too few people are paying attention.
Screeners exploit this dynamic by casting a wide net. You can scan the entire market for companies meeting your criteria in seconds. Without a screener, you might never encounter a small-cap industrial company in Europe or a mid-cap retailer in Japan that happens to trade at a significant discount to intrinsic value. The screener surfaces these opportunities automatically.
Screeners also enforce discipline. When you define your criteria upfront, you remove the temptation to chase stories or follow the crowd. A stock either meets your standards or it does not. This objectivity prevents the emotional decision-making that leads many investors to buy overvalued stocks with compelling narratives while ignoring undervalued ones that lack excitement.
The limitation is that screeners identify candidates, not conclusions. A stock that passes your screen deserves research, not immediate purchase. The screen is the first filter in a multi-step process that ends with a deep understanding of the business and conviction in its value.

TIKR tip: TIKR’s Global Screener covers over 100,000 stocks across global markets. You can screen by valuation, growth, profitability, and dozens of other criteria, then save screens to run periodically as market conditions change.
Build your own screener to find the best stocks to buy today (Free with TIKR) >>>
Key Metrics for Identifying Undervalued Stocks
Different valuation metrics capture different aspects of cheapness. Using multiple metrics provides a more complete picture than relying on any single measure.
Price-to-Earnings (P/E) is the most widely used valuation metric. It compares the stock price to earnings per share. A low P/E suggests you are paying less for each dollar of profit. Forward P/E based on estimated earnings is often more useful than trailing P/E because it reflects the business’s future prospects.
EV/EBITDA compares enterprise value to operating cash flow before depreciation. Because it accounts for debt, this metric is useful for comparing companies with different capital structures. It also avoids distortions from depreciation policies and interest expenses that can affect P/E.
Price-to-Free-Cash-Flow focuses on actual cash generation rather than accounting earnings. Free cash flow is the cash available to shareholders after capital expenditures. A low free cash flow multiple suggests the stock is cheap relative to its cash flow generation.
Price-to-Book (P/B) compares the market value to the accounting value of assets minus liabilities. This metric is most useful for asset-heavy businesses like banks, insurers, and industrial companies. A P/B below 1.0 means the market values the company at less than its liquidation value.
Earnings Yield inverts the P/E ratio to show earnings as a percentage of price. This allows direct comparison to bond yields or other investment alternatives. A stock with a 10% earnings yield generates more income per dollar invested than one with a 5% yield.
No single metric works in all situations. P/E can be misleading for companies with irregular earnings. P/B means little for asset-light businesses. The best approach is to use multiple metrics together and identify which are most relevant to the specific industry.
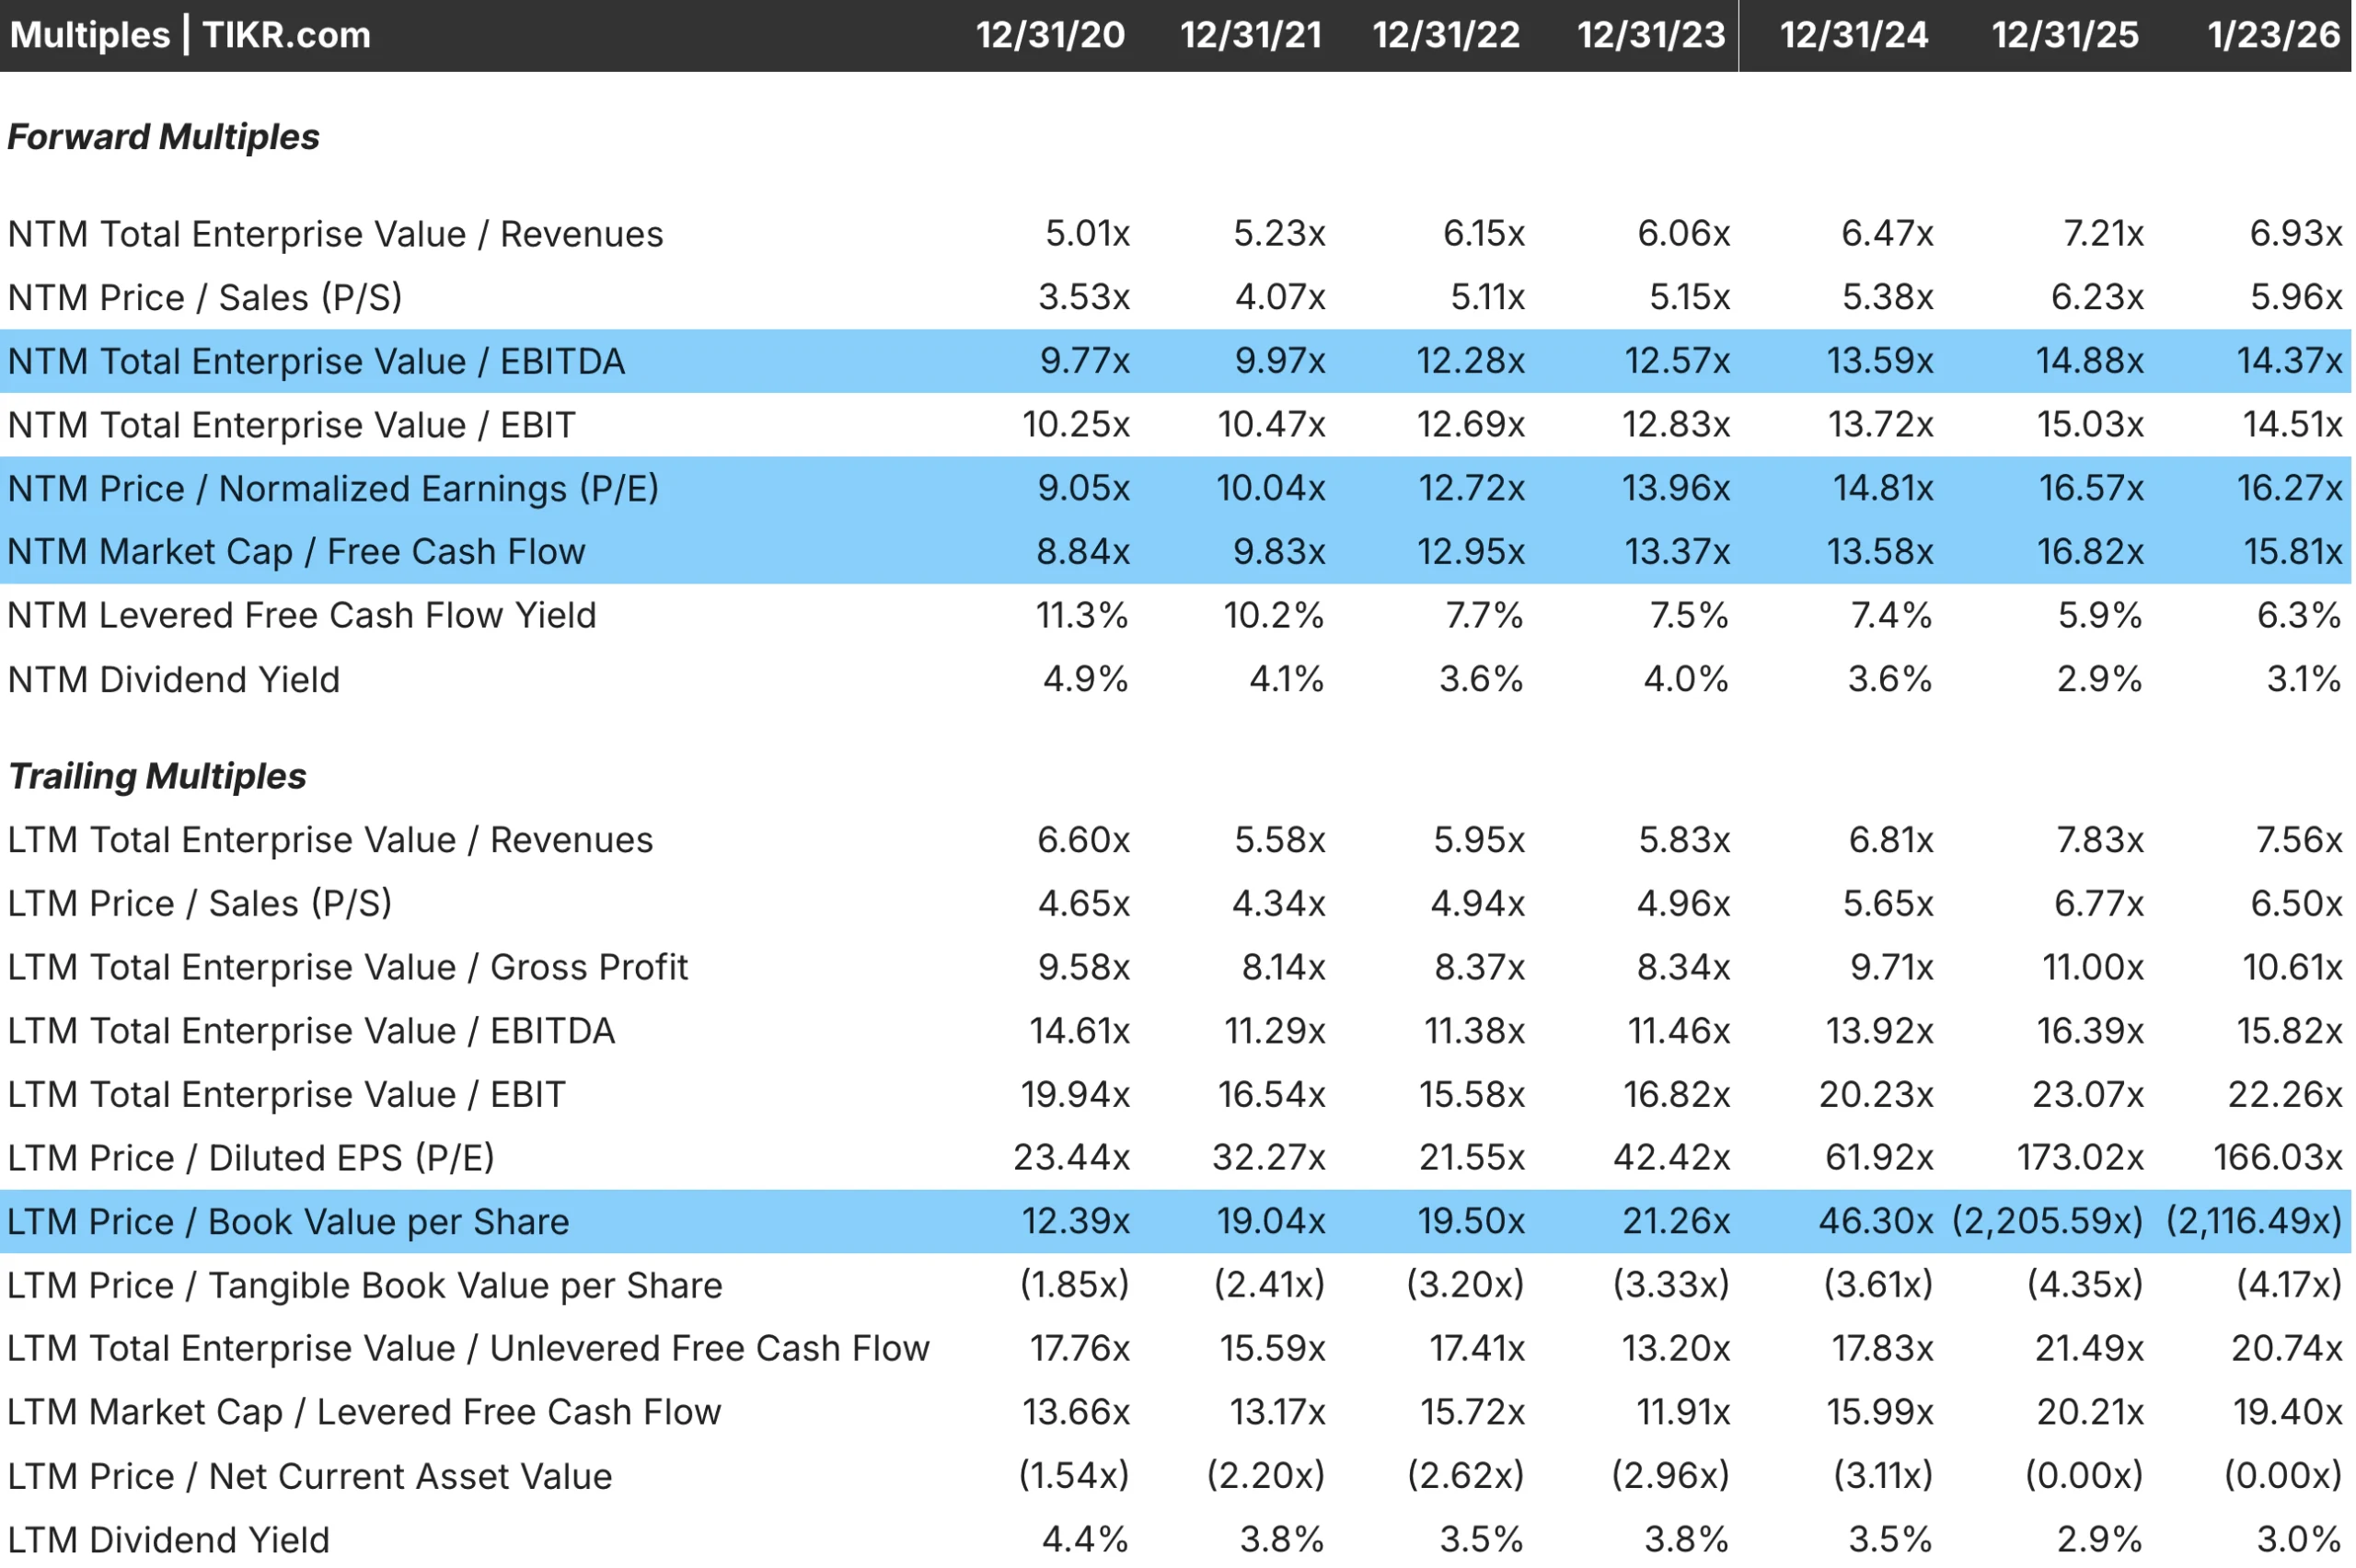
TIKR tip: TIKR displays all these valuation metrics in a single view. Use the Valuation tab to see how a stock compares to its own history and to industry peers across multiple measures.
Value any stock in less than 60 seconds with TIKR’s new Valuation Model (It’s free) >>>
Building a Basic Value Screen
A good starting screen balances selectivity with practicality. Too few criteria return an unmanageable list. Too many criteria filter out legitimate opportunities. Start simple and refine based on results.
Begin with a valuation threshold. Set a maximum P/E or EV/EBITDA that defines your target zone. For a basic value screen, you might require a P/E below 15 or an EV/EBITDA below 10. These thresholds identify stocks trading below market averages without being so restrictive that the screen returns nothing.
Add a profitability requirement. Cheap stocks are often cheap because the businesses are unprofitable. Require positive earnings, positive free cash flow, or a minimum operating margin to filter out companies where low valuation reflects fundamental problems rather than opportunity.
Include a quality filter. A return on capital above a minimum threshold, such as 10%, ensures that businesses generate adequate returns. This single filter eliminates many value traps where cheap stocks remain cheap because the companies destroy value over time.
Consider growth criteria. A stock with positive revenue growth and positive earnings growth is less likely to be in permanent decline. Even modest growth requirements filter out businesses that are shrinking their way toward irrelevance.
Apply geographic or sector filters based on your circle of competence. If you only want to analyze U.S. companies, filter by country. If you understand certain industries better than others, focus there. The best opportunities are the ones you can evaluate thoroughly.
A sample screen might include: P/E below 15, positive free cash flow, ROC above 10%, revenue growth positive over three years, and market cap above $500 million for liquidity. This combination typically returns 50 to 150 stocks, a manageable number for further research.
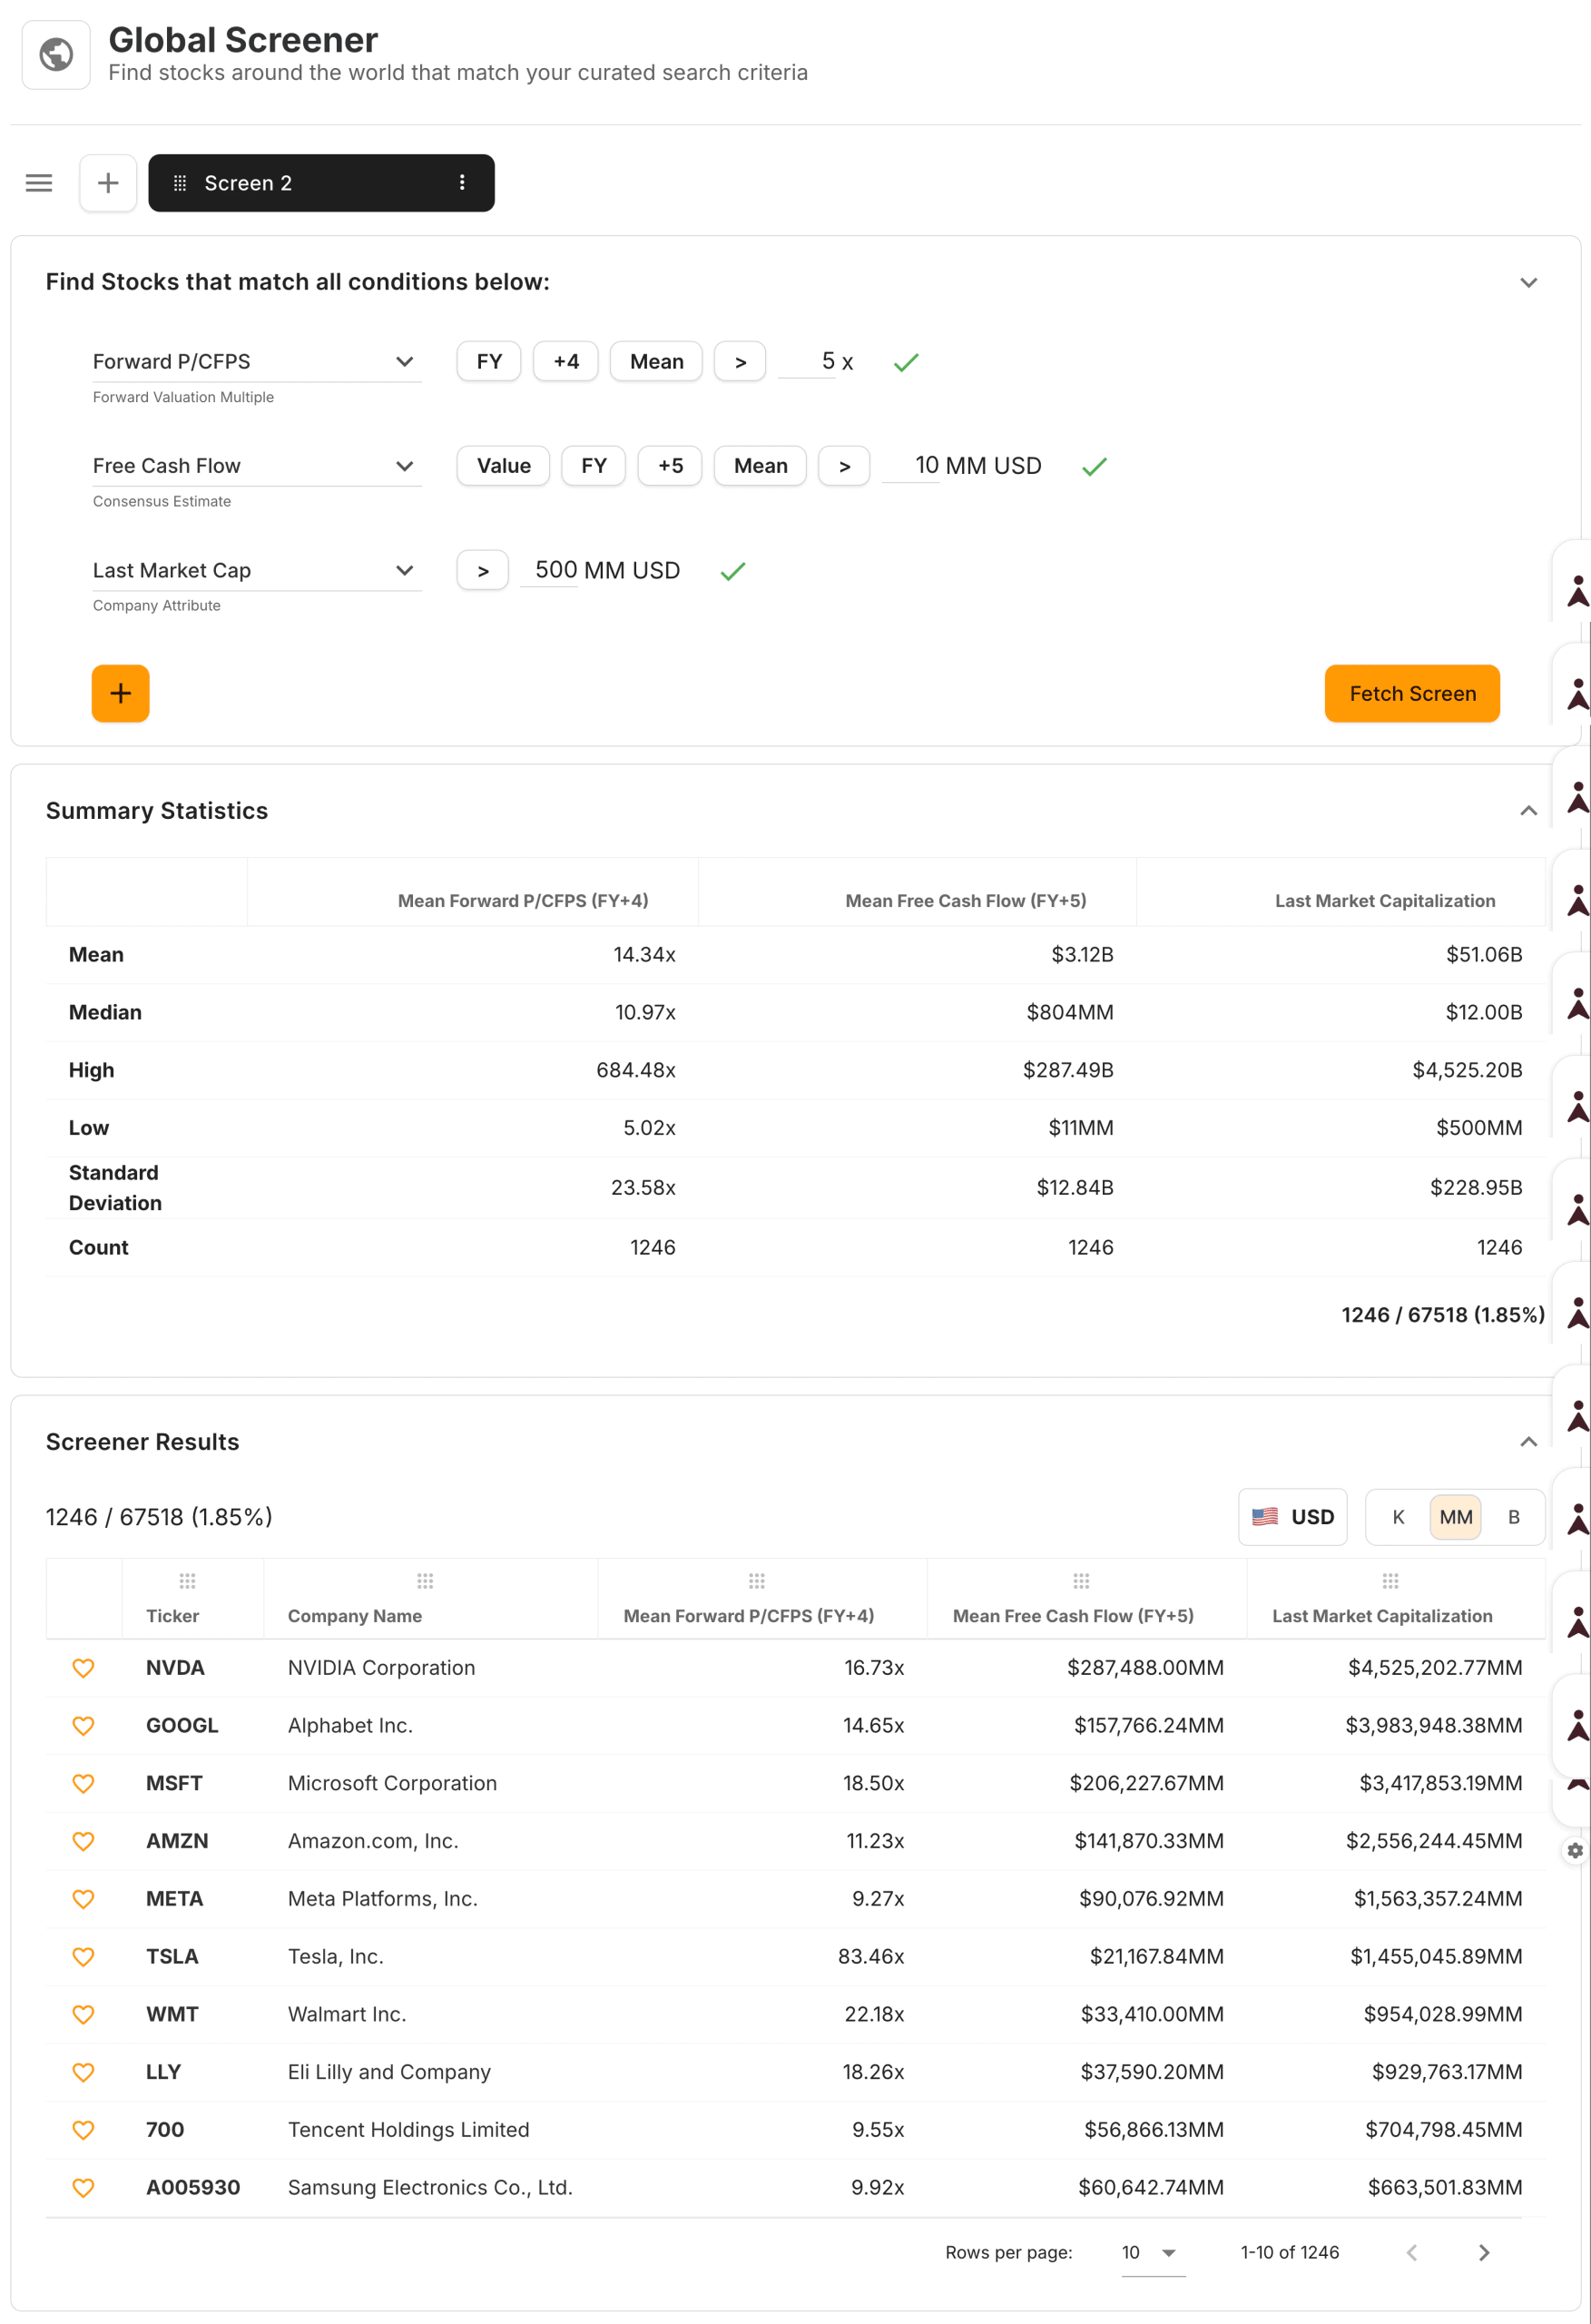
TIKR tip: Build and save custom screens in TIKR’s Global Screener. Run them monthly to identify new candidates as valuations change and to remove stocks that no longer meet your criteria.
Screen over 75,000 global stocks with TIKR (It’s free) >>>
Avoiding Value Traps
The biggest risk in screening for undervalued stocks is the value trap. These are stocks that appear cheap but remain cheap indefinitely because the underlying businesses continue to deteriorate. The low valuation is not an opportunity but a reflection of genuine problems.
Declining revenue is the most common characteristic of value traps. A company with shrinking sales is usually losing customers, market share, or relevance. No valuation is low enough if the business is disappearing. Require positive revenue growth or at least stable revenue to filter out terminal decline.
Deteriorating margins suggest the company is losing pricing power or facing cost pressures it cannot control. A stock might look cheap on current earnings, but if margins are compressing, future earnings will be lower than today’s. Watch for a consistent decline in margins over multiple years.
Falling returns on capital indicate a weakening competitive position. A company whose ROC has dropped from 15% to 8% over five years is becoming less efficient at generating profits. This trajectory often continues, making current earnings an unreliable guide to future performance.
Excessive debt creates a risk that overwhelms any valuation discount. A heavily leveraged company trading at 8x earnings might seem cheap until you realize that earnings could evaporate if interest rates rise or the business hits a rough patch. Screen for reasonable debt levels relative to cash flow.
Secular decline affects entire industries regardless of individual company quality. Newspapers, traditional retail, and certain manufacturing sectors face structural headwinds that no management team can fully overcome. Cheap stocks in dying industries are often cheap for permanent reasons.
The antidote to value traps is combining valuation screens with quality filters. A cheap, high-quality stock is an opportunity. A cheap, low-quality stock is usually a trap.

TIKR tip: After running a screen, review each candidate’s financial trends in TIKR’s Detailed Financials. Look for stable or improving revenue, margins, and ROC. Deteriorating trends are warning signs regardless of how cheap the stock appears.
Combining Valuation with Quality
The most effective screens balance valuation with indicators of business quality. This combination identifies stocks that are both cheap and good, rather than merely cheap.
Return on capital is the single best indicator of quality. Companies earning high returns on capital typically possess competitive advantages that protect profitability. Requiring a ROC above 12% or 15% filters out businesses that generate unattractive economics.
Margin stability indicates pricing power and cost control. A company that maintains consistent gross and operating margins across economic cycles demonstrates resilience. Screen for margins above industry averages or margins that have remained stable over five years.
Free cash flow generation confirms that accounting profits translate to real cash. Require positive free cash flow and, ideally, a free cash flow conversion rate above 80% of net income. This filter eliminates companies where earnings are inflated by aggressive accounting.
Balance sheet strength provides a safety margin. A company with low debt and ample cash can weather downturns that would stress weaker competitors. Screen for net debt to EBITDA below 2x or 3x, depending on industry norms.
Consistent earnings suggest predictable businesses. Companies with highly volatile earnings are harder to value and more likely to disappoint. Screening for low earnings variability over five years filters for stable operations.
A quality-value screen might require: P/E below 15, ROC above 12%, operating margin above 10%, positive free cash flow, net debt to EBITDA below 2x, and revenue growth positive over three years. This combination typically returns fewer stocks but higher-quality candidates.
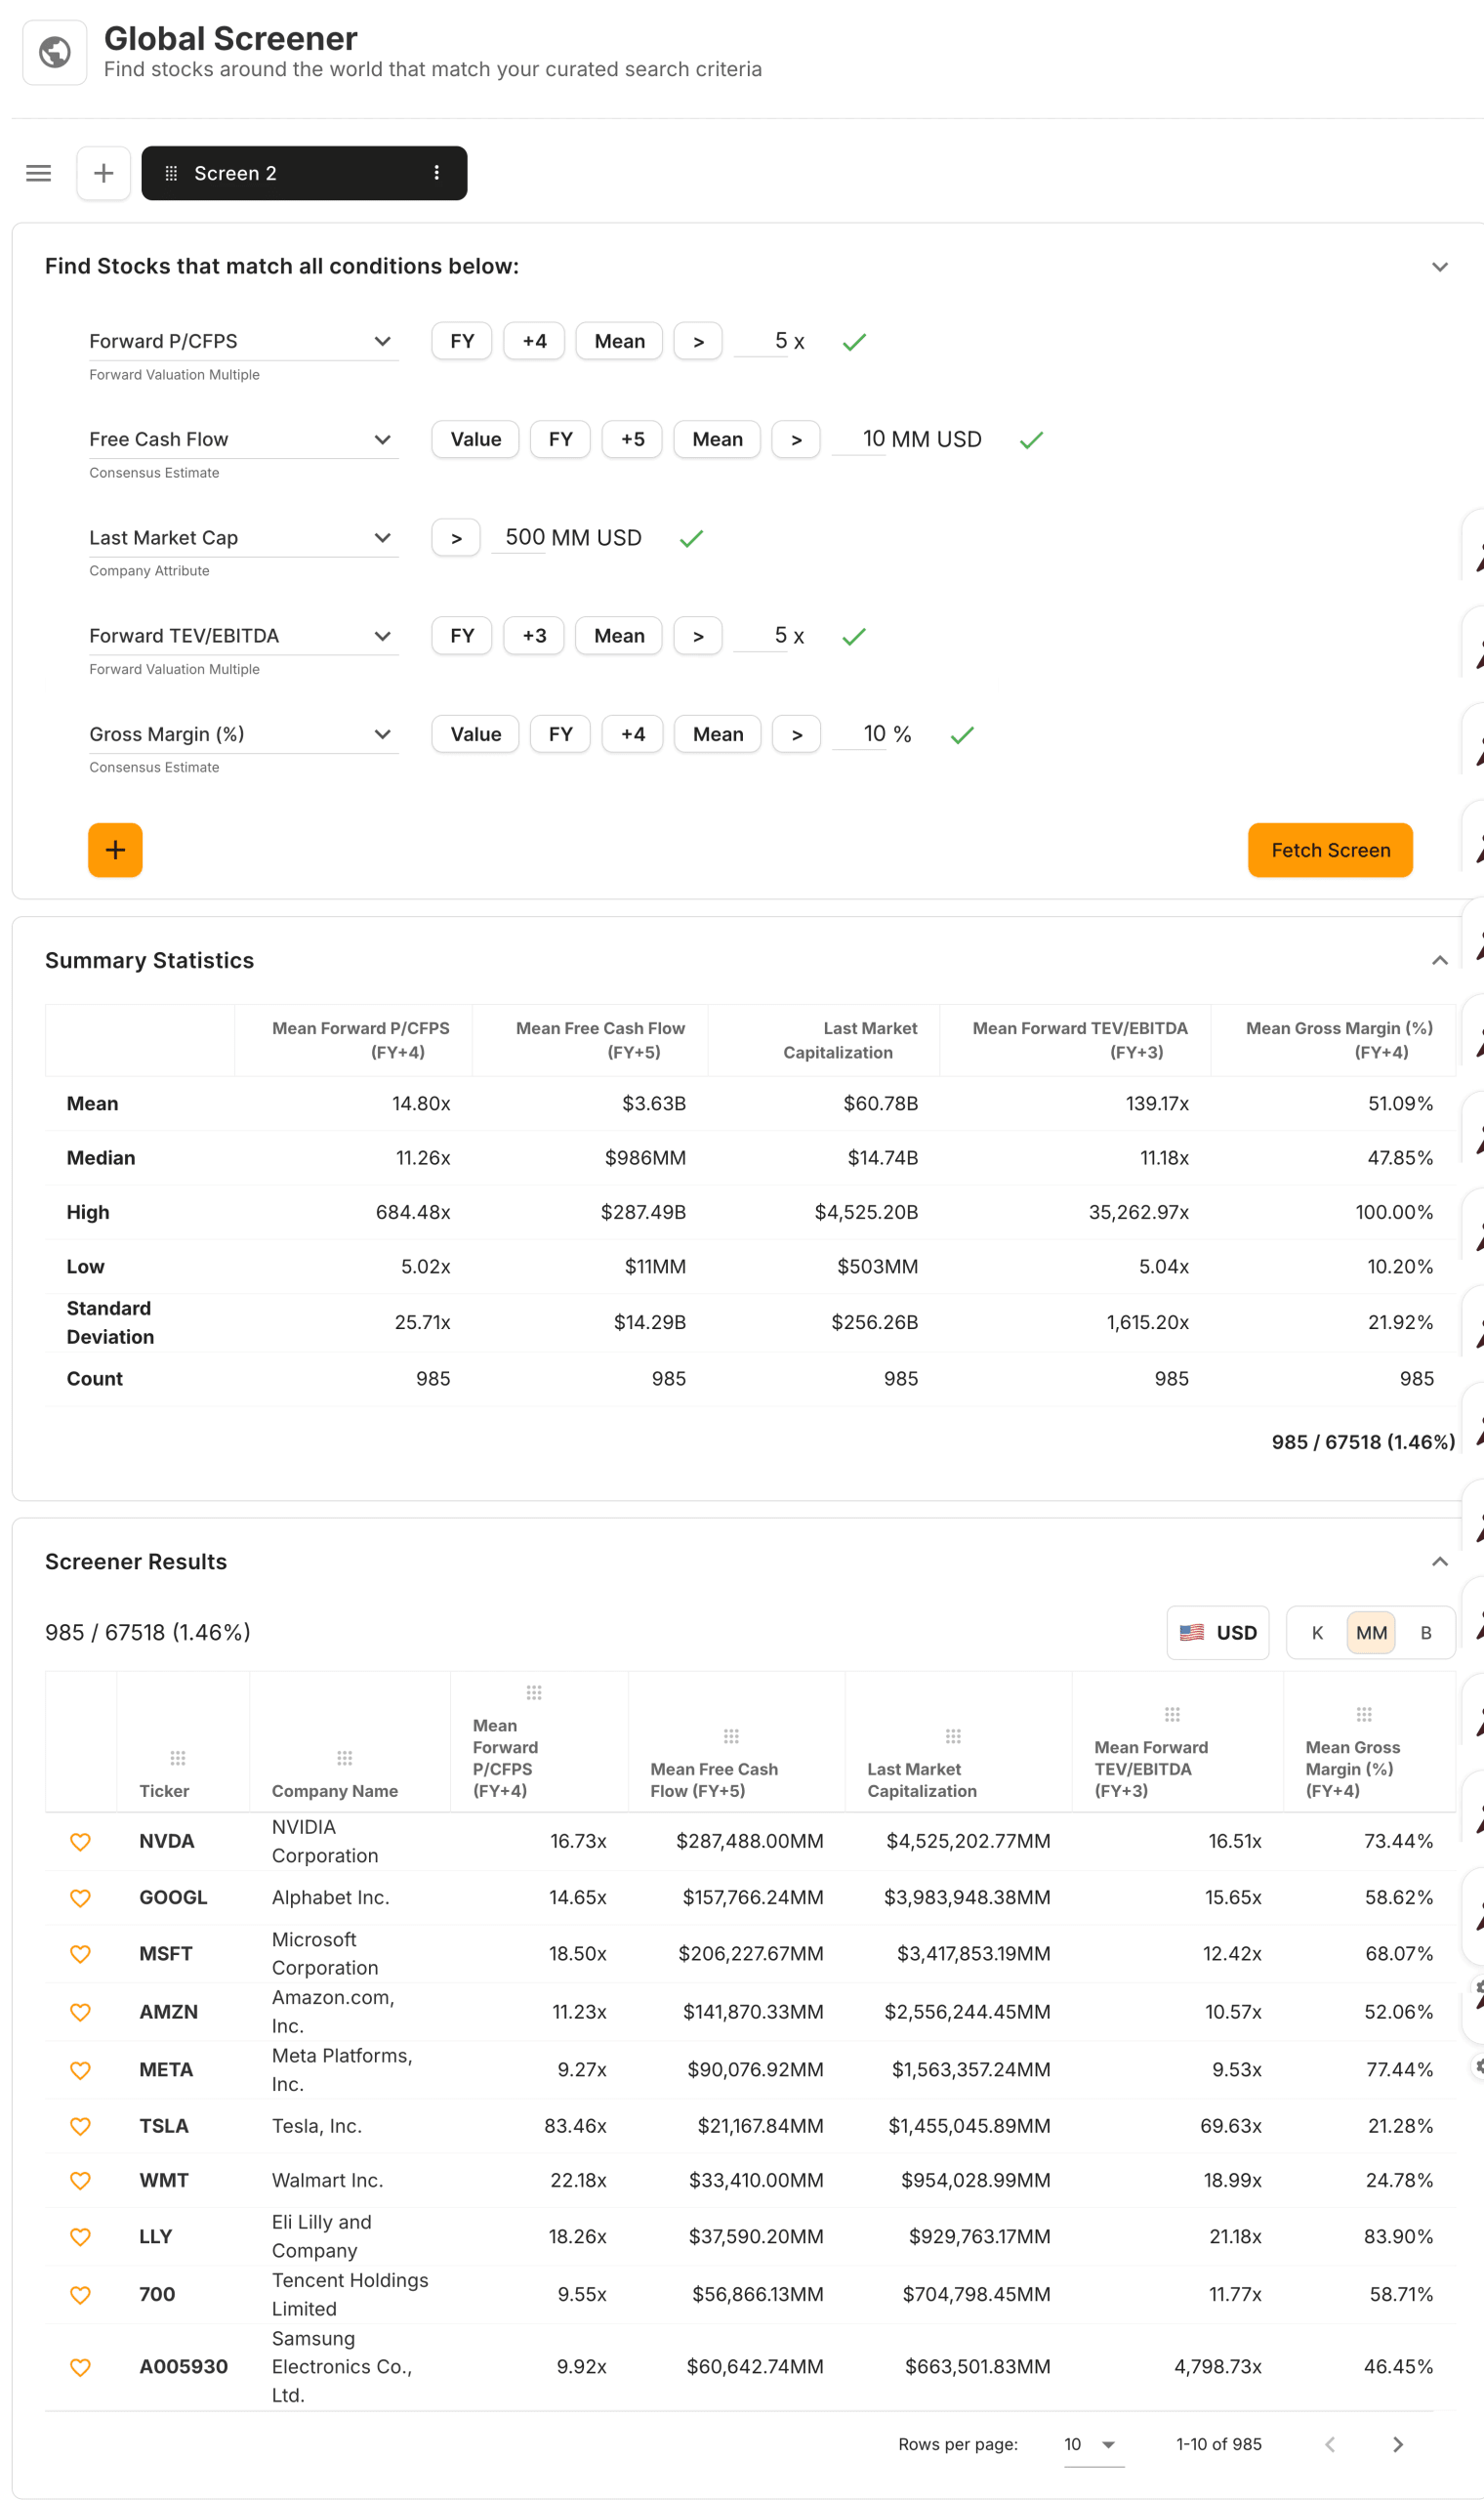
TIKR tip: Use TIKR’s screening flexibility to combine valuation and quality criteria in a single screen. Save different versions for different strategies, such as a deep value screen with minimal quality filters versus a quality-value screen with higher standards.
Build your own screener to find the best stocks to buy today (It’s free) >>>
Comparing Screen Stocks to Historical Valuation
A stock that passes a value screen might still be expensive relative to its own history. A company that has always traded at 10x earnings is not undervalued at 12x just because the market average is 18x. Historical context matters.
After running a screen, compare each candidate’s current valuation to its five-year and ten-year averages. A stock trading at the low end of its historical range is more likely undervalued than one trading at the high end. The screener identifies stocks that are cheap relative to the market. Historical comparisons identify stocks that are cheap relative to their own history.
Consider why the historical range might have changed. A company that has improved its growth rate or profitability might deserve a higher multiple than it has historically traded at. Conversely, a company facing new competitive threats might deserve a lower multiple. Do not assume mean reversion without understanding whether the business has changed.
Watch for multiple compression that reflects deteriorating fundamentals. If a stock has de-rated from 20x to 10x earnings over five years while revenue and margins have also declined, the lower multiple reflects genuine value destruction. The stock is not cheap. It is appropriately priced for a weaker business.
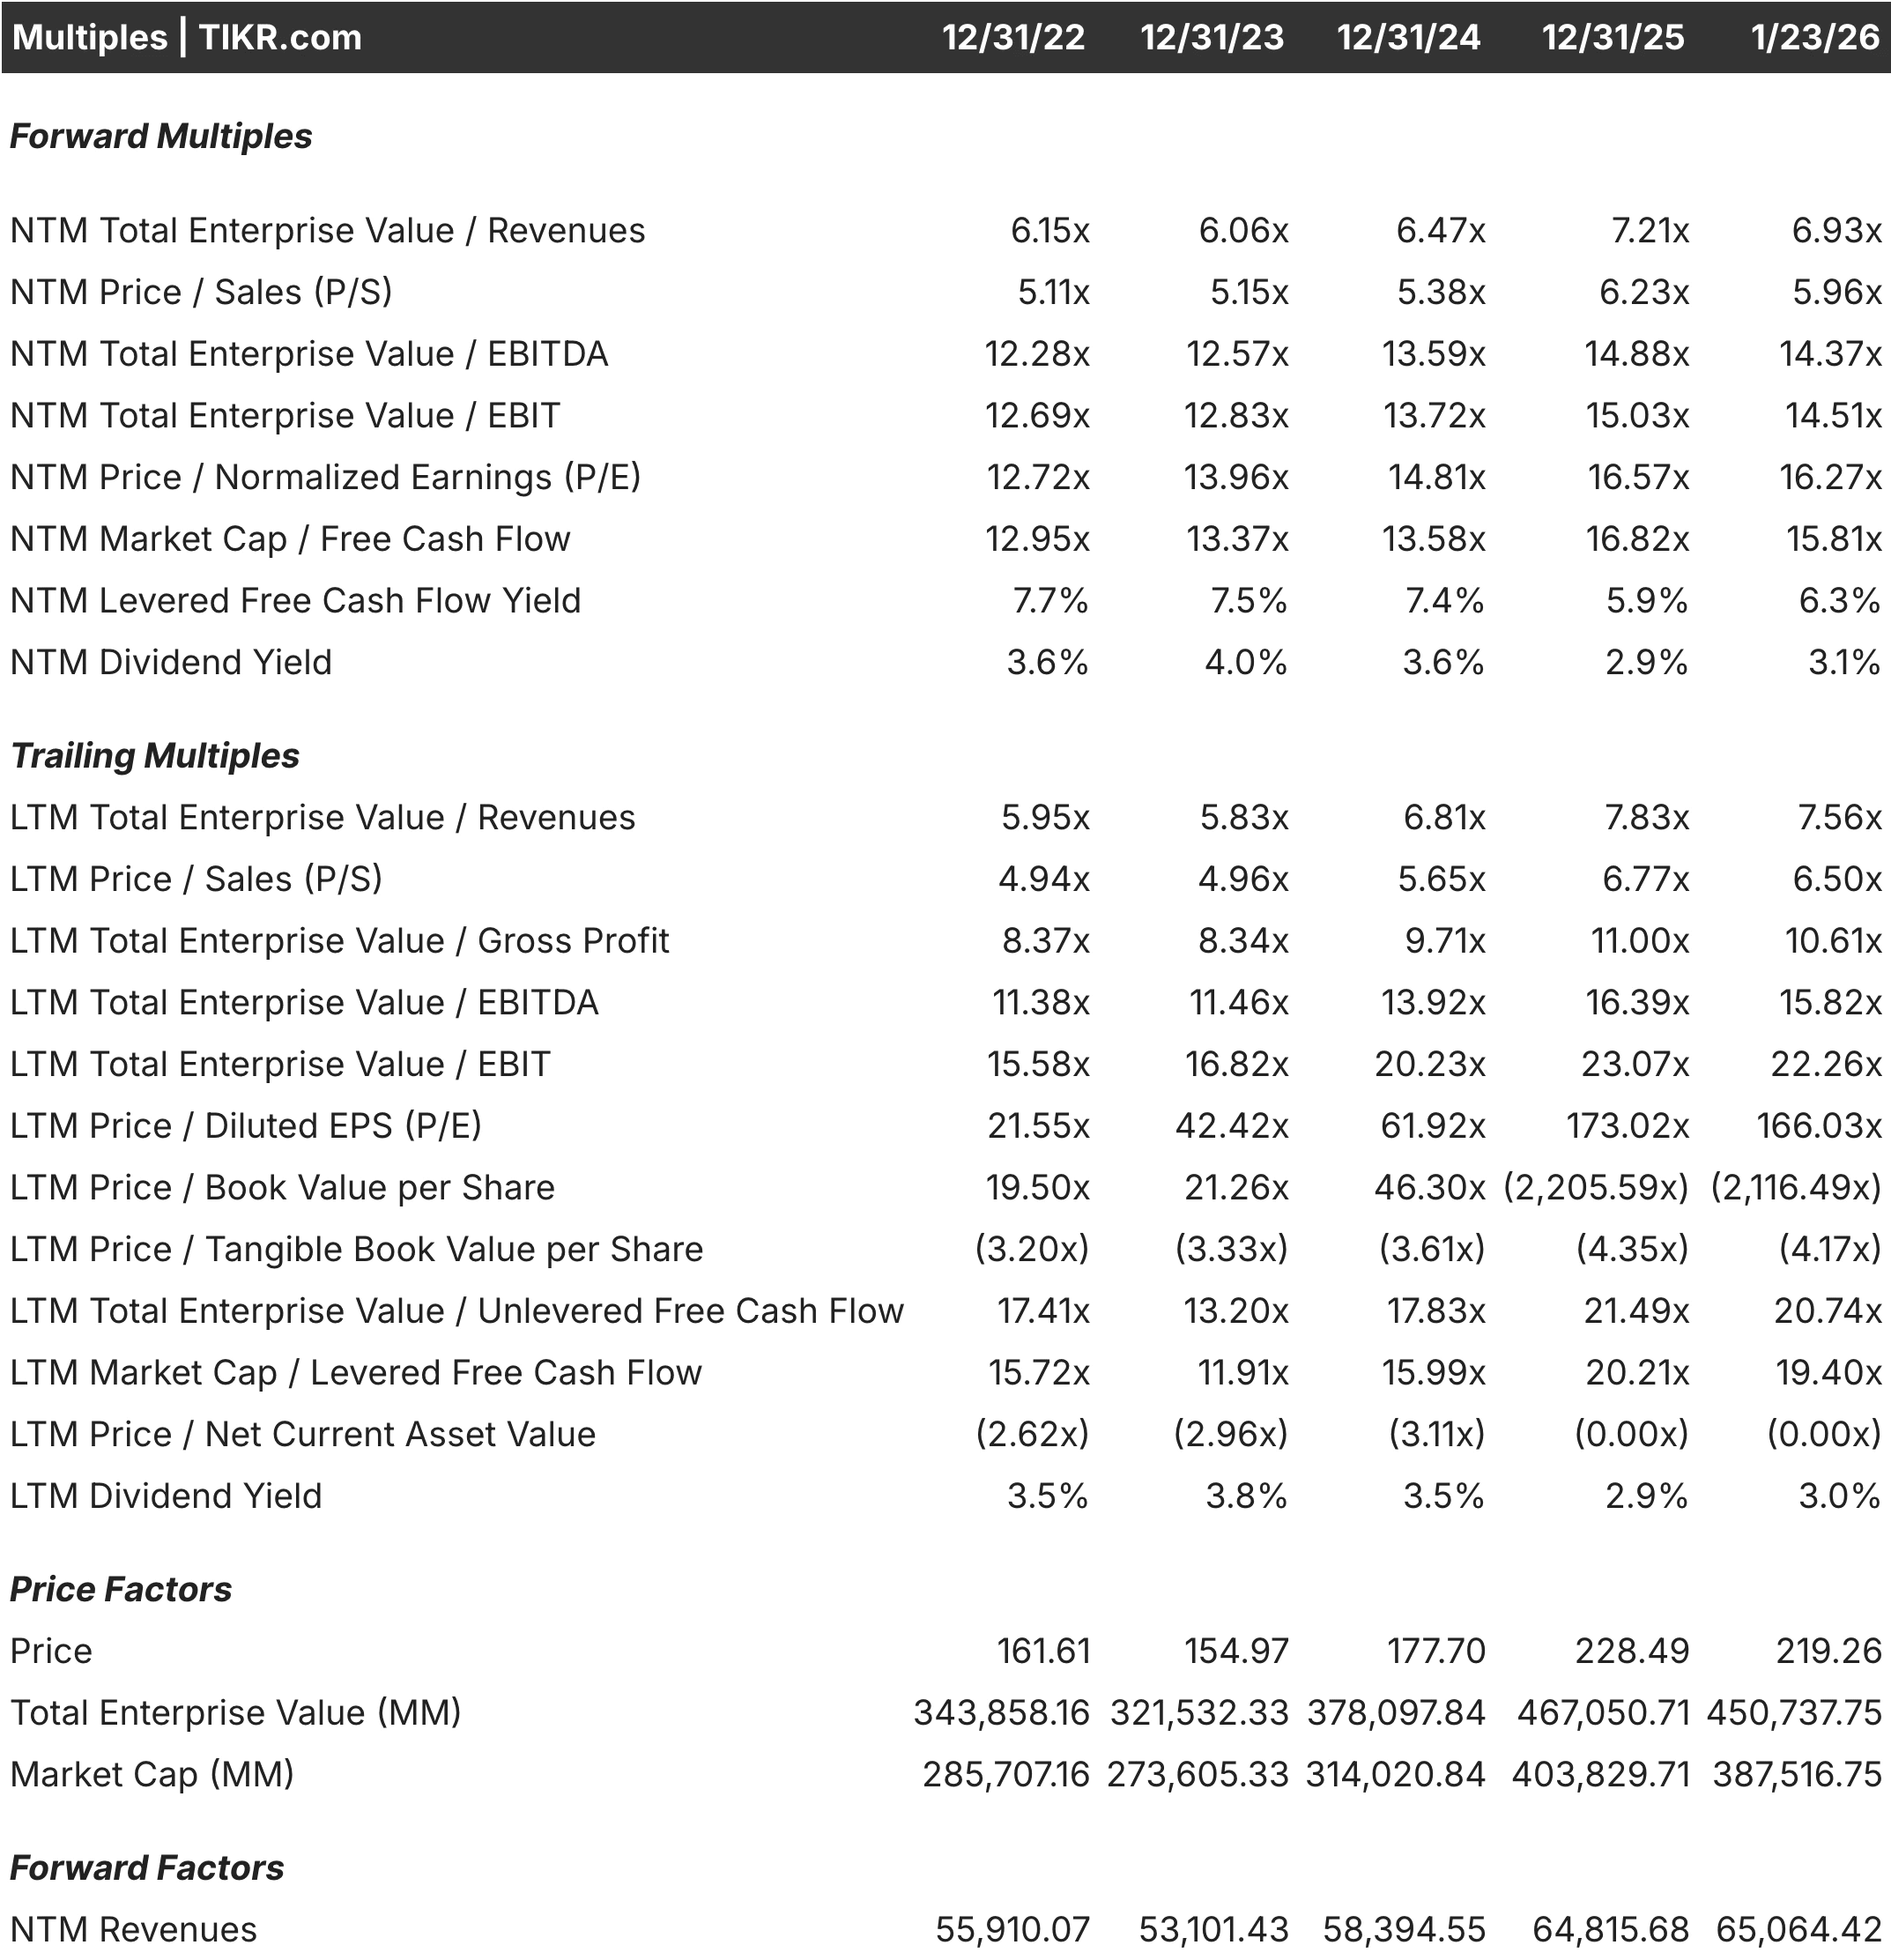
TIKR tip: TIKR’s Valuation tab displays current multiples alongside historical averages. After running a screen, check each candidate to see whether the current valuation represents a discount to history or simply reflects changed circumstances.
From Screen Results to Research
A stock that passes your screen warrants deeper analysis, not an automatic purchase. The screen is a filter that narrows the universe. Research determines whether the opportunity is real.
Understand the business model. Can you explain how the company makes money and what drives its profitability? If the business is too complex or outside your expertise, move to the next candidate regardless of how attractive the valuation appears.
Identify why the stock is cheap. Every undervalued stock has a reason for its low valuation. The market might be wrong, but it is rarely ignorant. Understand the bear case and determine whether it is overblown or legitimate.
Assess the quality of earnings. Review cash flow relative to reported earnings. Check whether margins are stable or compressing. Verify that revenue growth is organic rather than acquired. Confirm that the business fundamentals support the valuation metrics.
Evaluate management and capital allocation. How has management deployed cash flow? Are they reinvesting at high returns, making value-destructive acquisitions, or returning capital to shareholders? Check insider ownership and recent transactions.
Determine your margin of safety. Even after research, your analysis could be wrong. Buy only when the discount to your estimate of fair value is large enough to protect against errors. A 20% to 30% margin of safety is typically the minimum.
This process transforms screen results into investment decisions. Most candidates will be eliminated during the research process, leaving a small number of high-conviction opportunities.

TIKR tip: Use TIKR’s full platform to research screened candidates. Review financials, estimates, ownership, and transcripts without leaving the platform. This integrated workflow makes the research process efficient.
The TIKR Takeaway
Stock screeners make the search for undervalued stocks systematic rather than haphazard. You define criteria based on your investment philosophy and let the screener surface candidates from a universe too large to analyze manually.
The key is building screens that combine valuation with quality. A low P/E or EV/EBITDA identifies cheapness, but quality filters like return on capital, margin stability, and free cash flow generation separate genuine opportunities from value traps. The best screens balance selectivity with practicality, returning a manageable list of candidates worth researching.
TIKR’s Global Screener provides the tools to build and run these screens across over 100,000 global stocks. You can filter by dozens of criteria, save screens to run periodically, and research candidates using integrated financials, estimates, and ownership data.
Finding undervalued stocks is not about luck or tips. It is about defining what you are looking for, systematically screening, and conducting research to separate real opportunities from traps. A disciplined process surfaces ideas you would never discover otherwise and builds conviction that makes holding through volatility possible.
Find undervalued stocks in less than 60 seconds with TIKR’s new Valuation Model (It’s free) >>>
Value Any Stock in Under 60 Seconds with TIKR
With TIKR’s new Valuation Model tool, you can estimate a stock’s potential share price in under a minute.
All it takes is three simple inputs:
- Revenue Growth
- Operating Margins
- Exit P/E Multiple
If you’re not sure what to enter, TIKR automatically fills in each input using analysts’ consensus estimates, giving you a quick, reliable starting point.
From there, TIKR calculates the potential share price and total returns under Bull, Base, and Bear scenarios so you can quickly see whether a stock looks undervalued or overvalued.
See a stock’s true value in under 60 seconds (Free with TIKR) >>>
Looking for New Opportunities?
- Discover which stocks billionaire investors are purchasing, so you can follow the smart money.
- Analyze stocks in as little as 5 minutes with TIKR’s all-in-one, easy-to-use platform.
- The more rocks you overturn… the more opportunities you’ll uncover. Search 100K+ global stocks, global top investor holdings, and more with TIKR.
Disclaimer:
Please note that the articles on TIKR are not intended to serve as investment or financial advice from TIKR or our content team, nor are they recommendations to buy or sell any stocks. We create our content based on TIKR Terminal’s investment data and analysts’ estimates. Our analysis might not include recent company news or important updates. TIKR has no position in any stocks mentioned. Thank you for reading, and happy investing!


