
Key Stats for HUBG Stock
- This-Week Performance: 8%
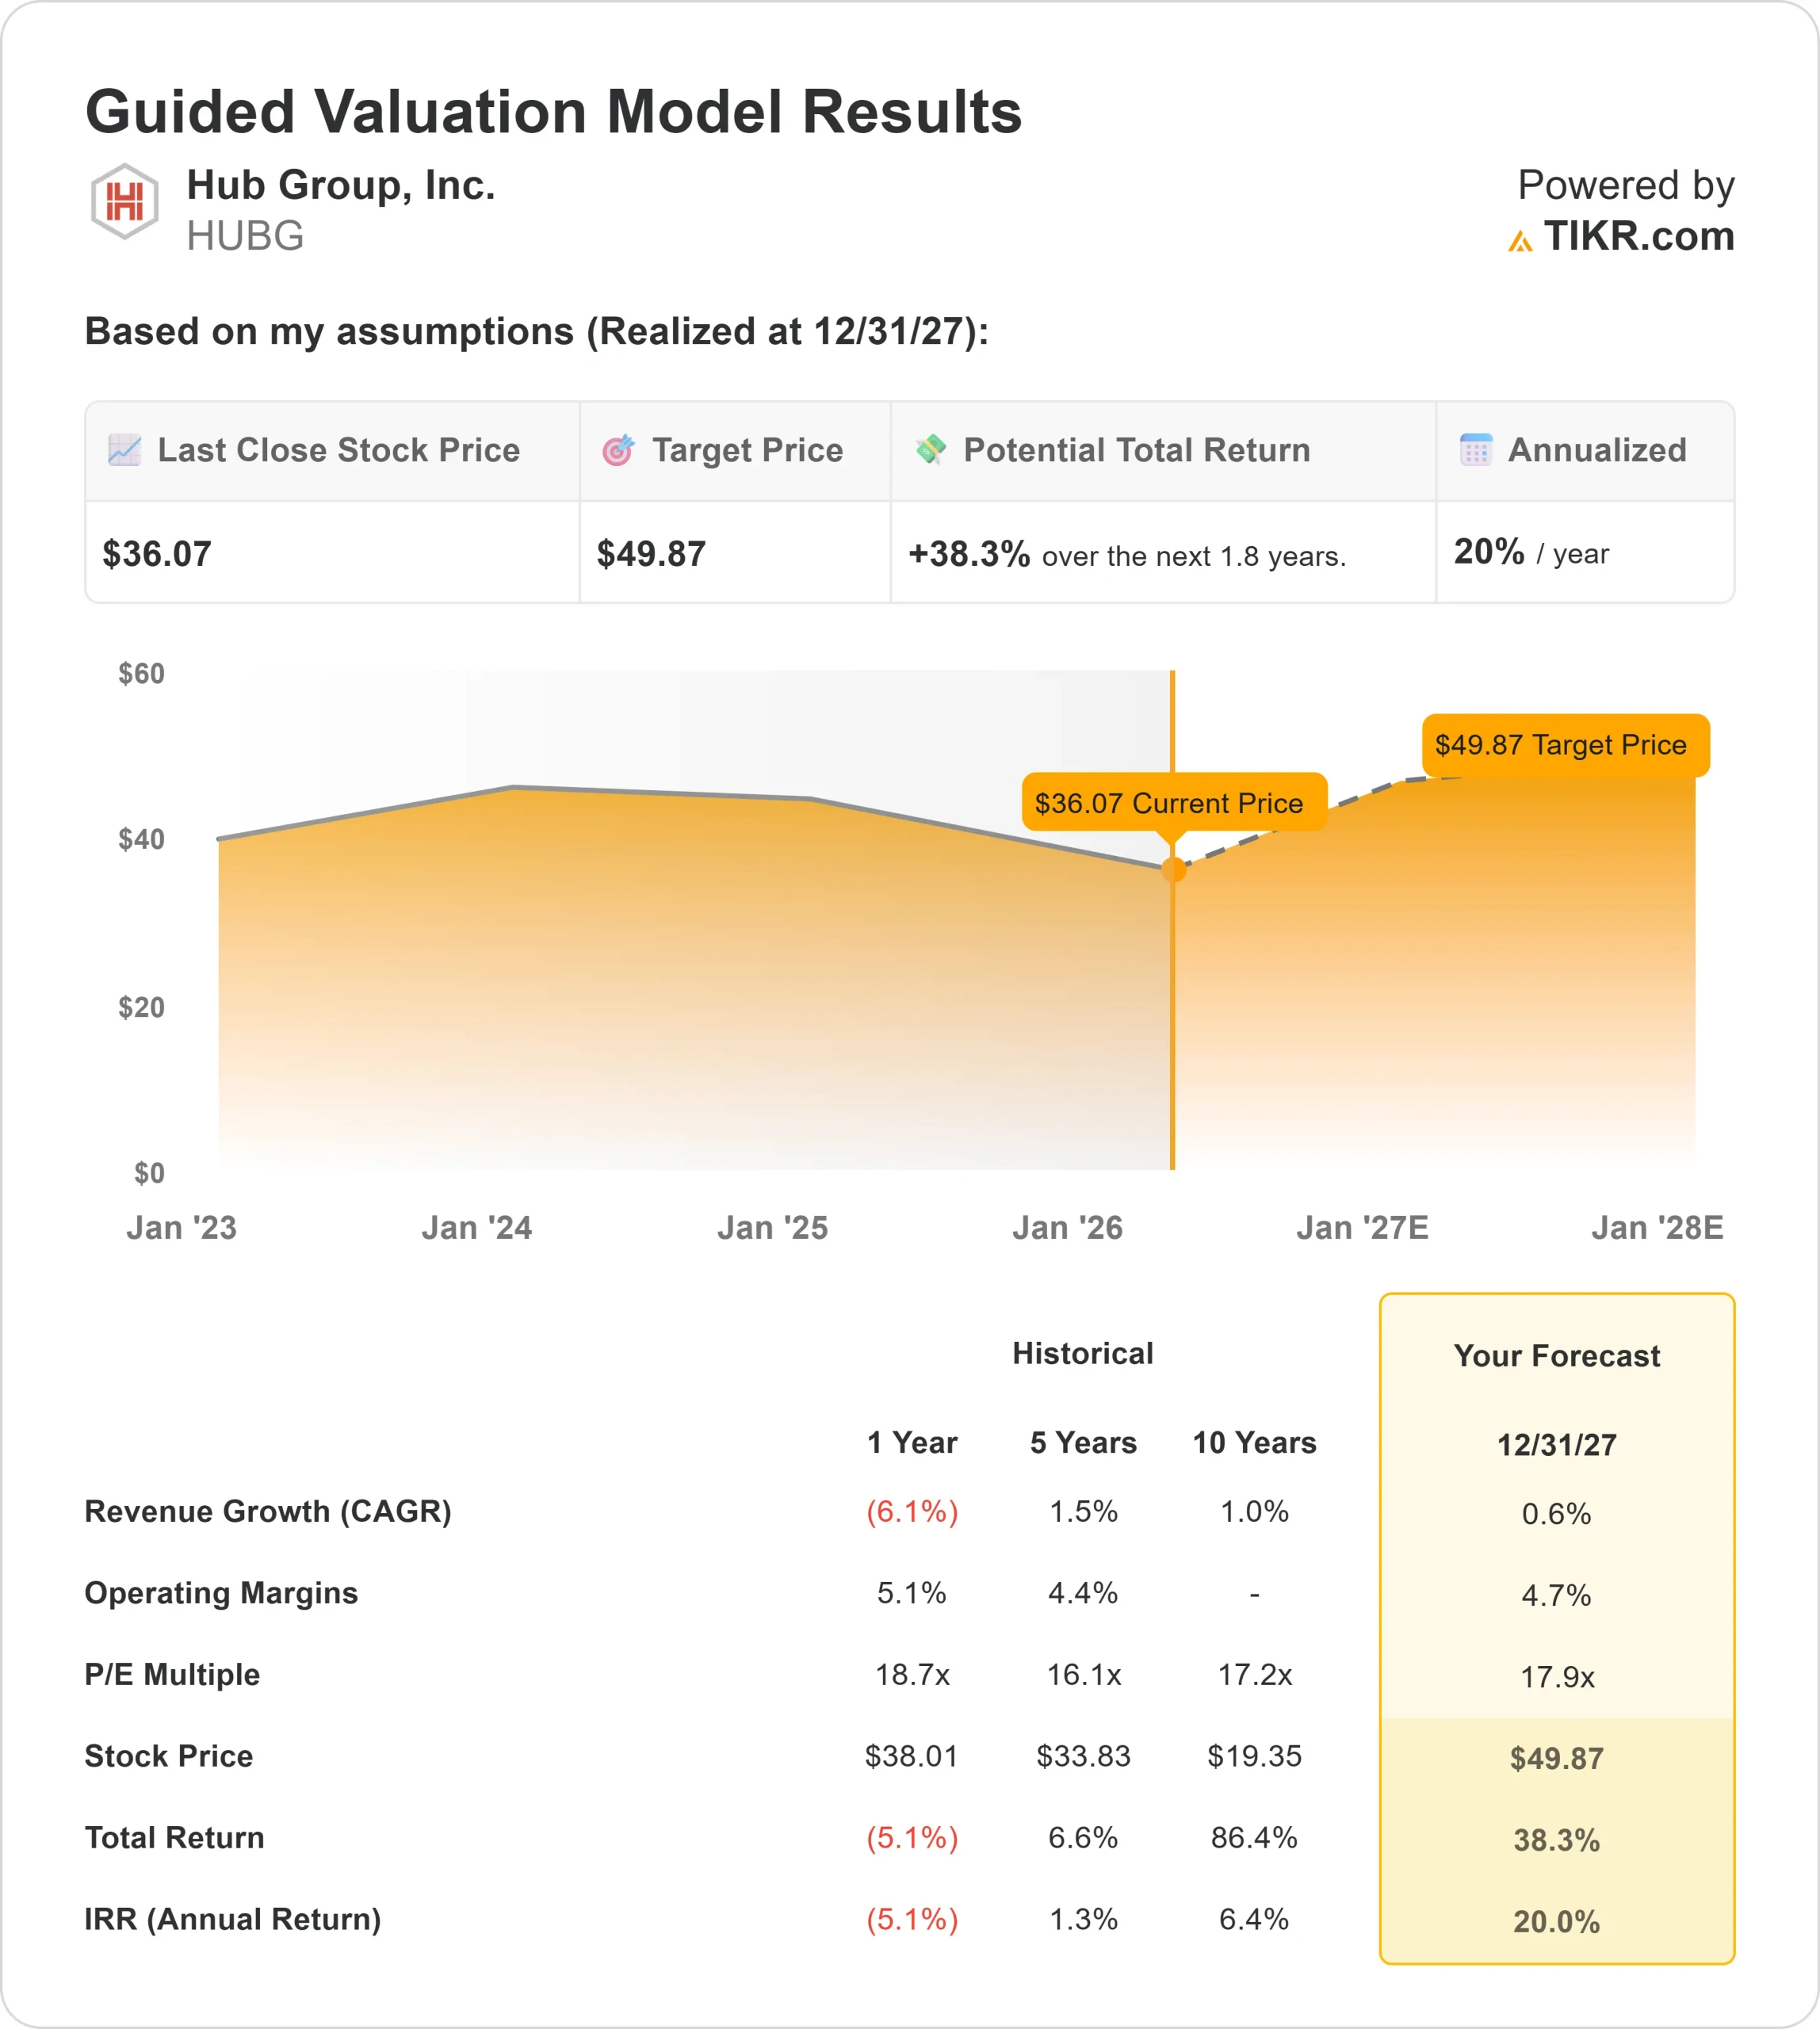
- 52-Week Range: $31 to $53
- Valuation Model Target Price: $50
- Implied Upside: 38%
Analyze your favorite stocks like Hub Group with TIKR (It’s free) >>>
What Happened?
Hub Group stock rose about 8% this week, finishing near $36 per share as investors reacted to a shift in the freight market narrative from contraction toward early stabilization, even as the company works through recent accounting-related issues.
Shares moved higher throughout the week, suggesting sustained buying interest rather than a short-term bounce.
The stock moved higher this week primarily because investors are beginning to price in a recovery in freight volumes, with recent industry commentary pointing to stabilizing shipment demand after a prolonged downturn.
This improving outlook has also supported competitors like J.B. Hunt Transport Services and Schneider National, both of which operate large intermodal and logistics networks and are seeing early signs of volume stabilization, reinforcing the view that the freight cycle may be nearing a bottom.
This week, Hub Group remained in focus after disclosing a $77 million accounting error tied to purchased transportation costs, which led to a delay in its 2025 Form 10-K filing and a Nasdaq noncompliance notice.
The restatement impacts three prior quarters, and the company stated the issue “did not affect cash flow” while it assesses potential impacts on prior-year financials.
The news triggered sharp analyst reactions, with Stifel downgrading the stock to Sell and cutting its price target to $27 from $52, while Baird lowered its target to $29 from $47 and moved to Neutral, highlighting near-term uncertainty despite improving industry conditions.
Institutional positioning provides additional context around sentiment, though most recent filings reflect earlier periods rather than current-week activity.
Hudson Bay Capital Management reduced its stake by 72%, while Fisher Asset Management cut its position by 55% and Dynamic Technology Lab lowered exposure by 67%, suggesting some investors reduced exposure following recent volatility.
At the same time, Interval Partners increased its holdings by 8% and Cramer Rosenthal McGlynn raised its stake by 15%, while long-term holders like Dimensional Fund Advisors and Vanguard maintained large positions, highlighting a mix of short-term caution and longer-term confidence in a freight recovery.
Value Hub Group instantly (Free with TIKR) >>>
Is HUBG Undervalued?
Under valuation assumptions, the stock is modeled using:
- Revenue Growth (CAGR): 0.6%
- Operating Margins: 4.7%
- Exit P/E Multiple: 17.9x
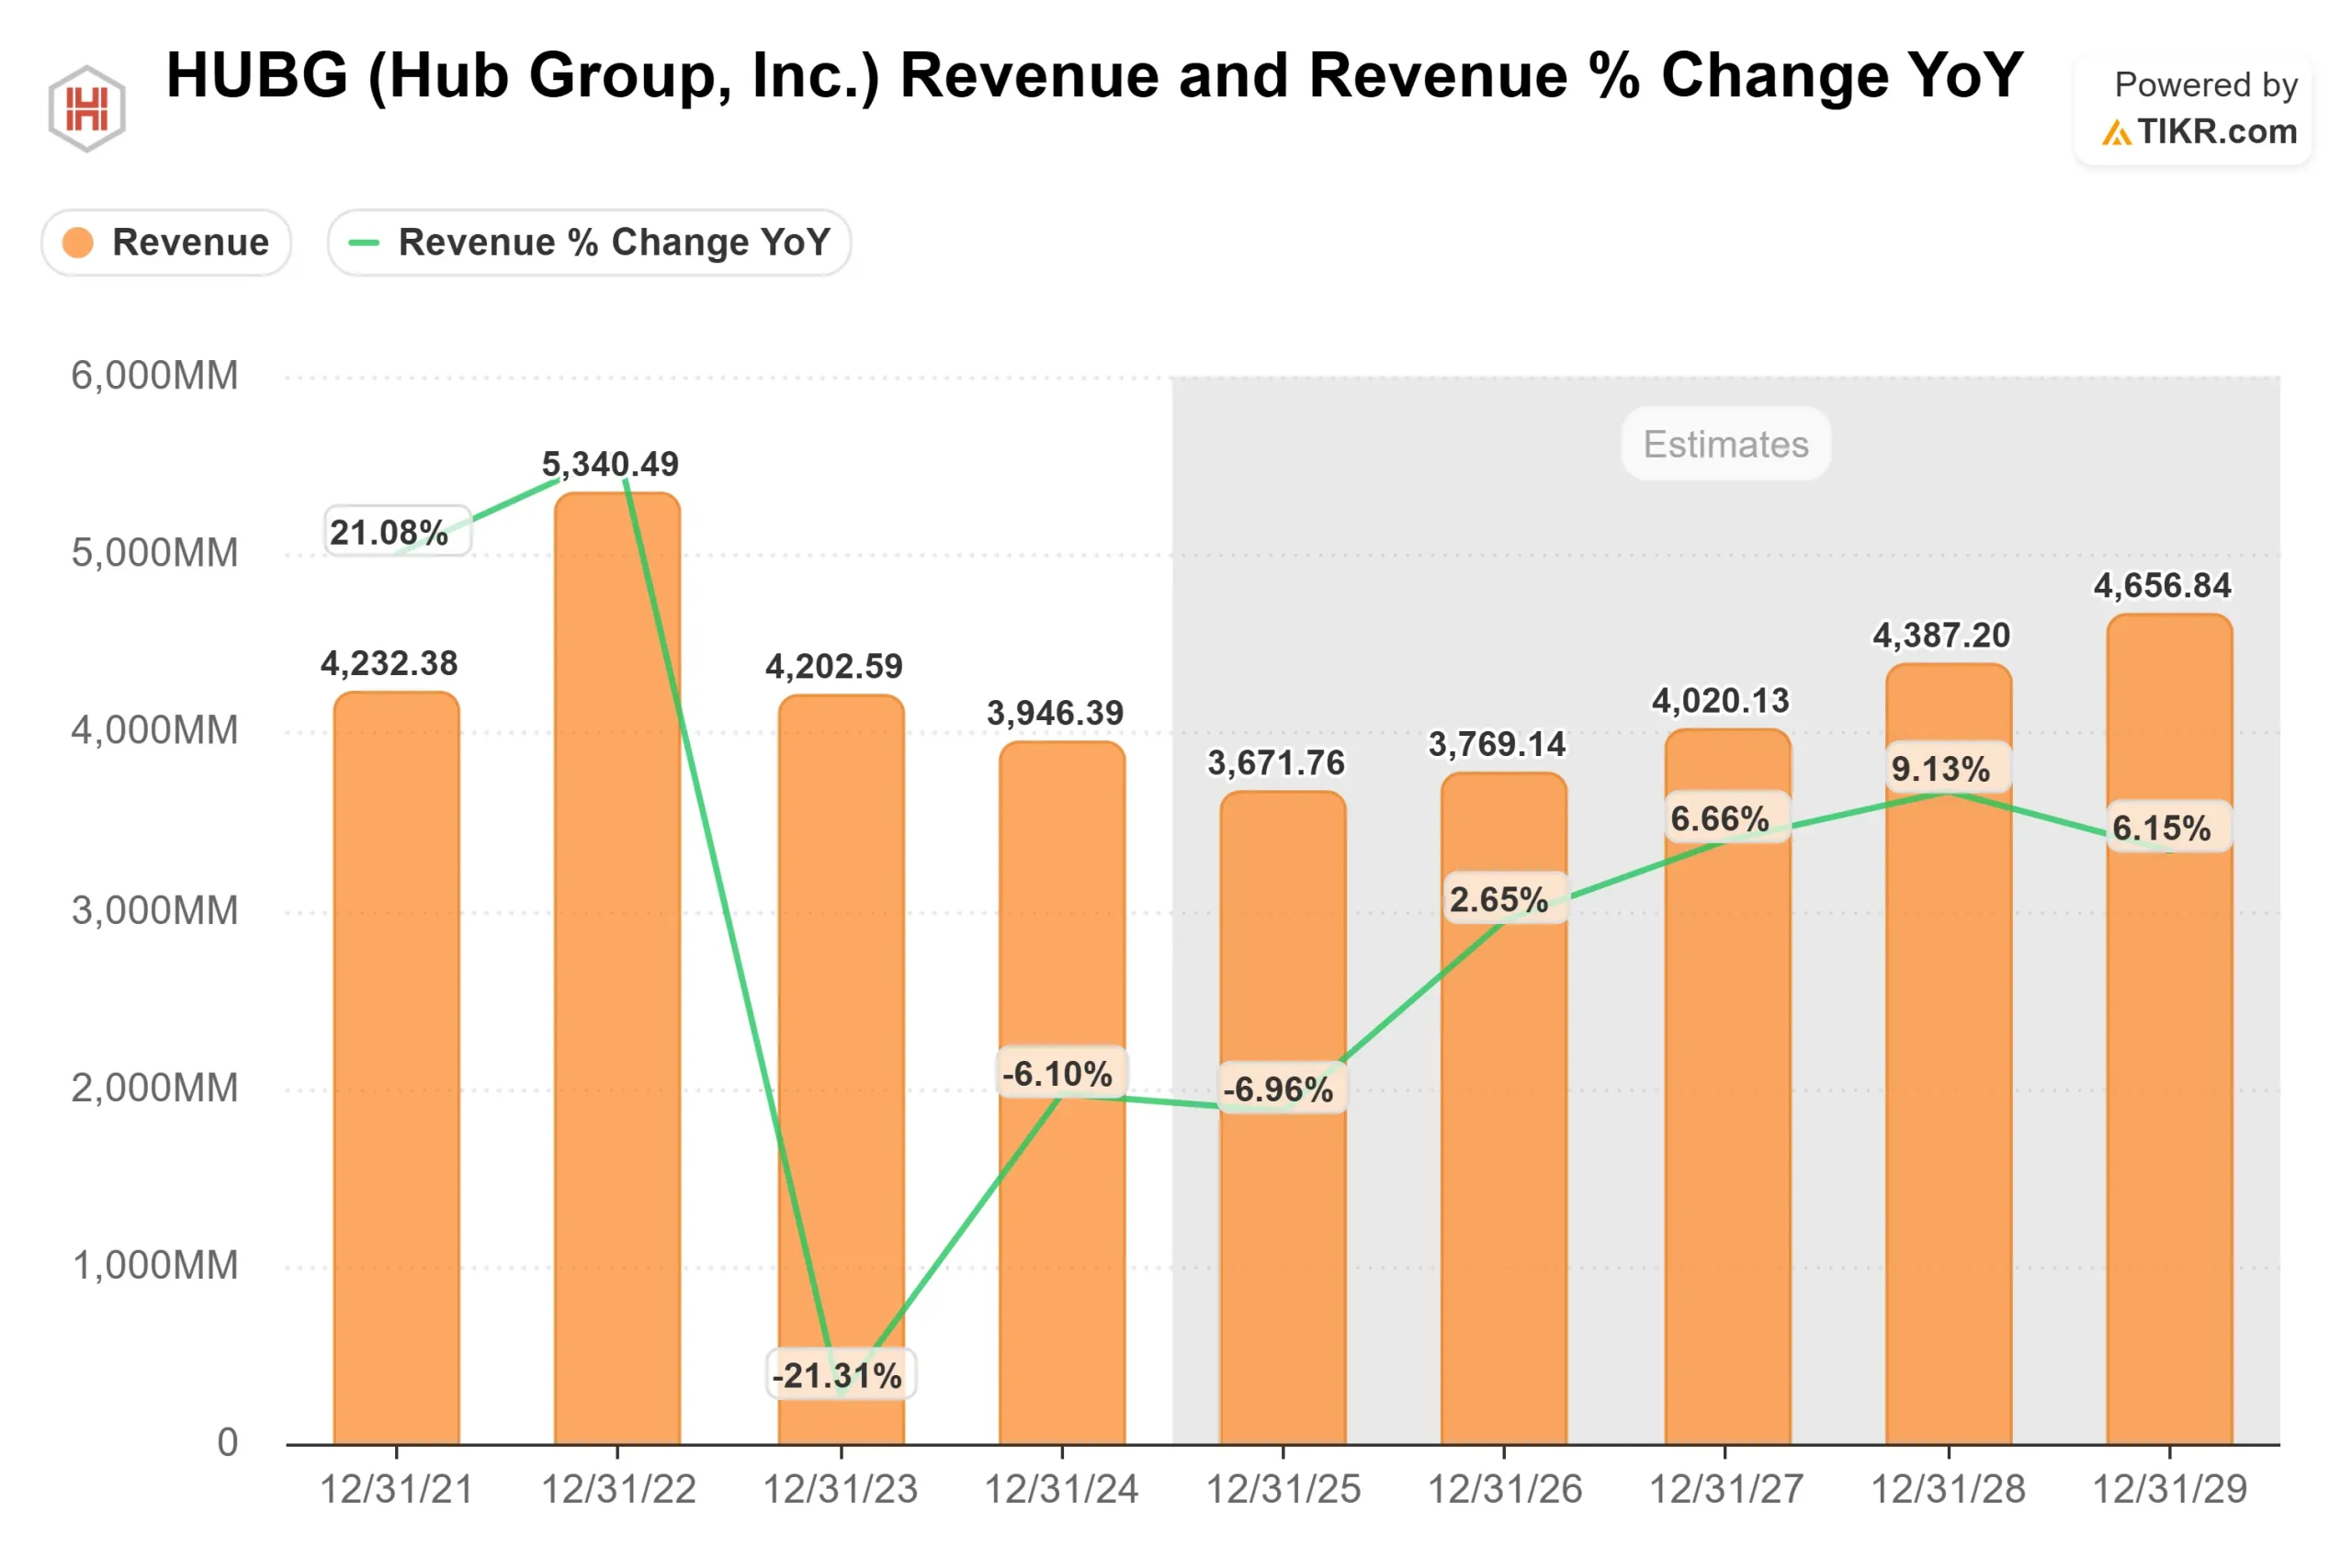
Hub Group’s sales declined during the freight downturn as shipment volumes and pricing weakened across the industry.
The key driver of future upside is margin recovery, as Hub Group’s asset-light model allows profits to scale quickly when volumes return and network utilization improves.
See analysts’ growth forecasts and price targets for Hub Group (It’s free) >>>
Contract repricing is another important lever, as lower-priced agreements signed during the downturn are expected to roll off and reset at higher rates, directly improving revenue per load and operating margins.
Growth in dedicated transportation and logistics services also provides a more stable and higher-margin revenue base, helping reduce earnings volatility compared to pure intermodal exposure.
At current levels, Hub Group appears undervalued, with future performance driven by freight demand normalization, pricing recovery, and operating leverage as the cycle improves.
How Much Upside Does HUBG Stock Have From Here?
Investors can estimate Hub Group potential share price, or what any stock could be worth, in under a minute using TIKR’s New Valuation Model tool.
All it takes is three simple inputs:
- Revenue Growth
- Operating Margins
- Exit P/E Multiple
From there, TIKR calculates the potential share price and total returns under Bull, Base, and Bear scenarios so you can quickly see whether a stock looks undervalued or overvalued.
If you’re not sure what to enter, TIKR automatically fills in each input using analysts’ consensus estimates, giving you a quick, reliable starting point.
Value Hub Group in under 60 seconds with TIKR (It’s free) >>>