Key Stats for Shell Stock
- Past-Week Performance: 1.3%
- 52-Week Range: $29 to $40
- Current Price: $40
What Happened to Shell Stock?
Shell (SHEL) plc is currently trading at its all-time highs at $40, as the stock absorbed simultaneous Q4 earnings showing sub-5% free cash flow per share growth, an emergency Train 3 shutdown at Atlantic LNG, and Venezuela’s Dragon project remaining frozen despite new U.S. general licenses issued February 13.
Last February 5, Shell announced a 4% dividend increase and a $3.5 billion buyback program, marking its 17th consecutive quarter of $3 billion or more in buybacks, even as Q4 adjusted earnings came in at $3.3 billion against a backdrop of lower oil prices and non-cash tax charges.
Underneath that shareholder return commitment, Shell’s full year 2025 results revealed genuine operational strength, with CFFO reaching $43 billion, free cash flow exceeding $26 billion, and structural cost reductions hitting $5.1 billion, reaching the lower bound of the 2028 target three years ahead of schedule.
Increasingly, the market is being forced to weigh Shell’s disciplined capital return track record against a reserve life that has fallen to roughly 7.8 years, a prolonged Chemicals downturn, and an Atlantic LNG complex running at 9 of 12 million metric tonnes per annum capacity due to supply shortages.
CEO Wael Sawan stated on the Q4 2025 earnings call that “you can be sure of Shell,” citing $5.1 billion in structural savings, a 15% Mobility ROACE, 21% Lubricants ROACE, and 70% progress toward its 2030 Scope 1 and 2 emissions halving target.
Broadly, Shell’s ability to sustain over 10% annual free cash flow per share growth through 2030 now depends on LNG Canada ramping to full capacity, Bonga South West reaching a 2027 FID, and the Dragon project delivering first gas within three years, all of which remain in execution, not yet in results.
Wall Street’s Take on Shell Stock
Despite SHEL stock hitting its $5.1 billion cost reduction target three years early, unlocking Venezuela’s Dragon project via U.S. general licenses on February 13, and sustaining its 17th consecutive $3 billion-plus quarterly buyback, the fundamental revenue trajectory remains a meaningful headwind heading into 2026.
The bear case on fundamentals is hard to ignore, with revenue declining from $381.3 billion in 2022 to a projected $260.3 billion in 2026, EBITDA margins compressing to 20.6%, and normalized EPS essentially flat at $3.13 versus $3.15 in 2025.
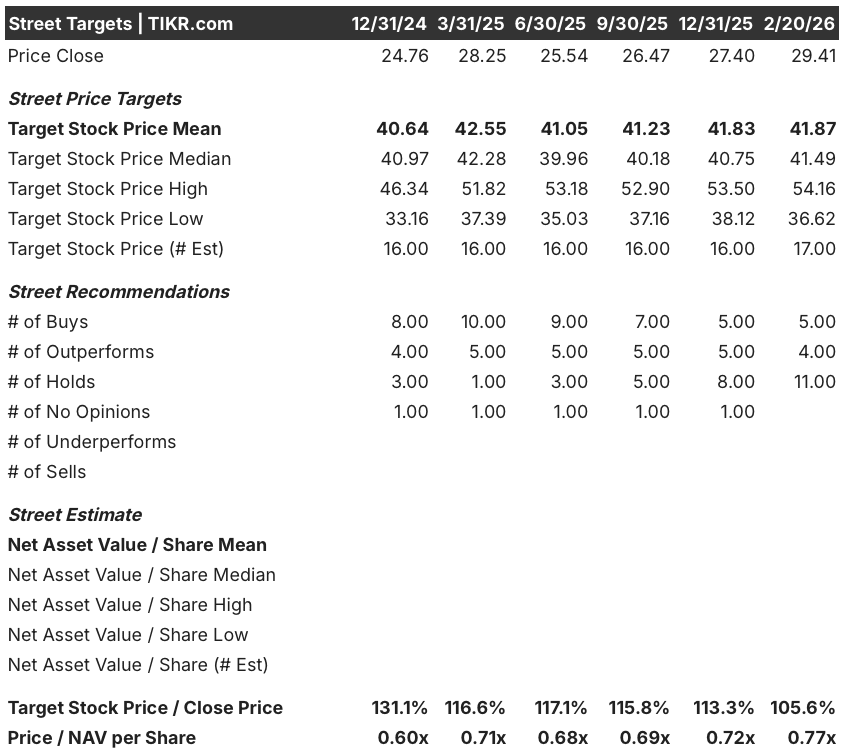
Nevertheless, Wall Street’s 17 analysts converge on a mean price target of $41.9 against the current $40.00 price, with 5 Buys and 4 Outperforms, implying modest but positive upside as operational execution and buybacks hold the floor.
The target spread tells a more divided story, ranging from a low of $36.6 to a high of $54.2, reflecting deep disagreement over whether Shell’s LNG growth, Chemicals recovery, and deepwater expansion can offset structural oil price and margin pressure.
What Does the Valuation Model Say?
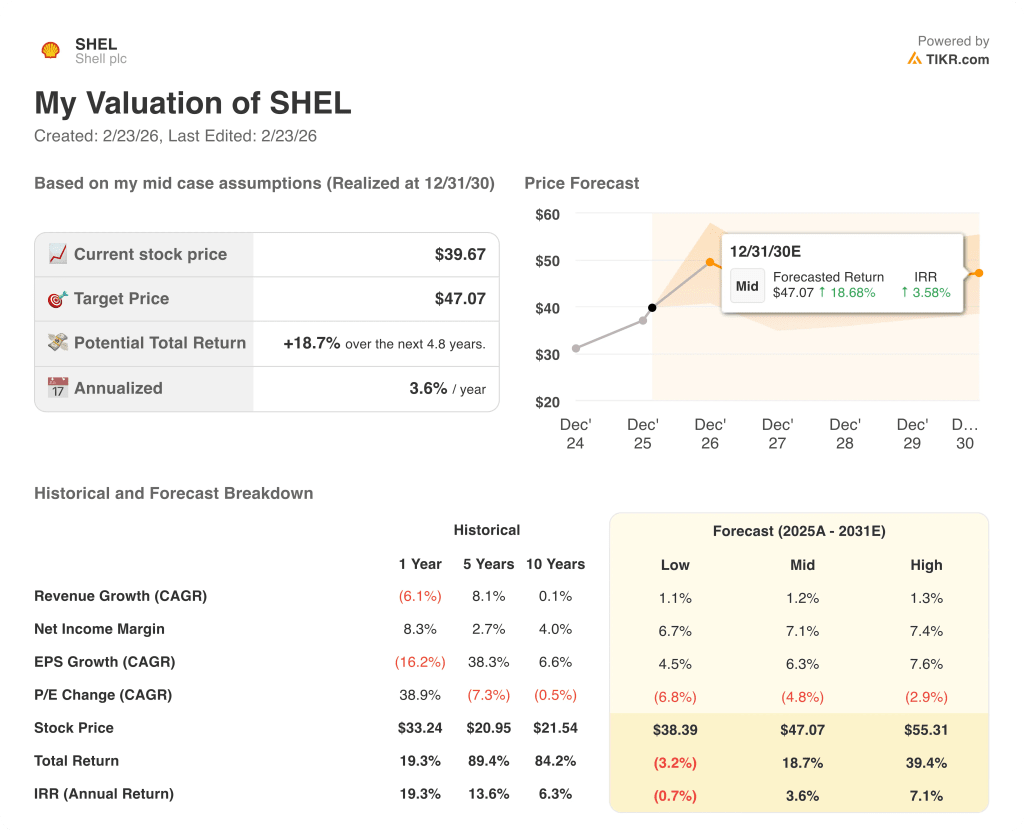
Accounting for the Dragon project optionality, Atlantic LNG volume recovery, and ongoing buybacks, a mid-case valuation model prices SHEL stock at $47.1 by December 2030, representing an 18.7% total return but only a 3.6% annualized IRR from current levels.
The core risk is that Shell’s P/E multiple continues compressing, as the model projects a negative 4.8% P/E CAGR in the mid case, meaning EPS growth alone will not be enough to drive meaningful price appreciation without a sentiment re-rating.
At $40.00, Shell looks fairly valued at best, offering income and capital return consistency but limited price upside for investors seeking growth, making it a hold for yield-oriented investors rather than a compelling re-rating story.
Value Any Stock in Under 60 Seconds (It’s Free)
With TIKR’s new Valuation Model tool, you can estimate a stock’s potential share price in under a minute.
All it takes is three simple inputs:
- Revenue Growth
- Operating Margins
- Exit P/E Multiple
From there, TIKR calculates the potential share price and total returns under Bull, Base, and Bear scenarios so you can quickly see whether a stock looks undervalued or overvalued.
If you’re not sure what to enter, TIKR automatically fills in each input using analysts’ consensus estimates, giving you a quick, reliable starting point.