Key Stats for EQT Corporation Stock
- Past-6-Month Performance: 13%
- 52-Week Range: $44 to $62
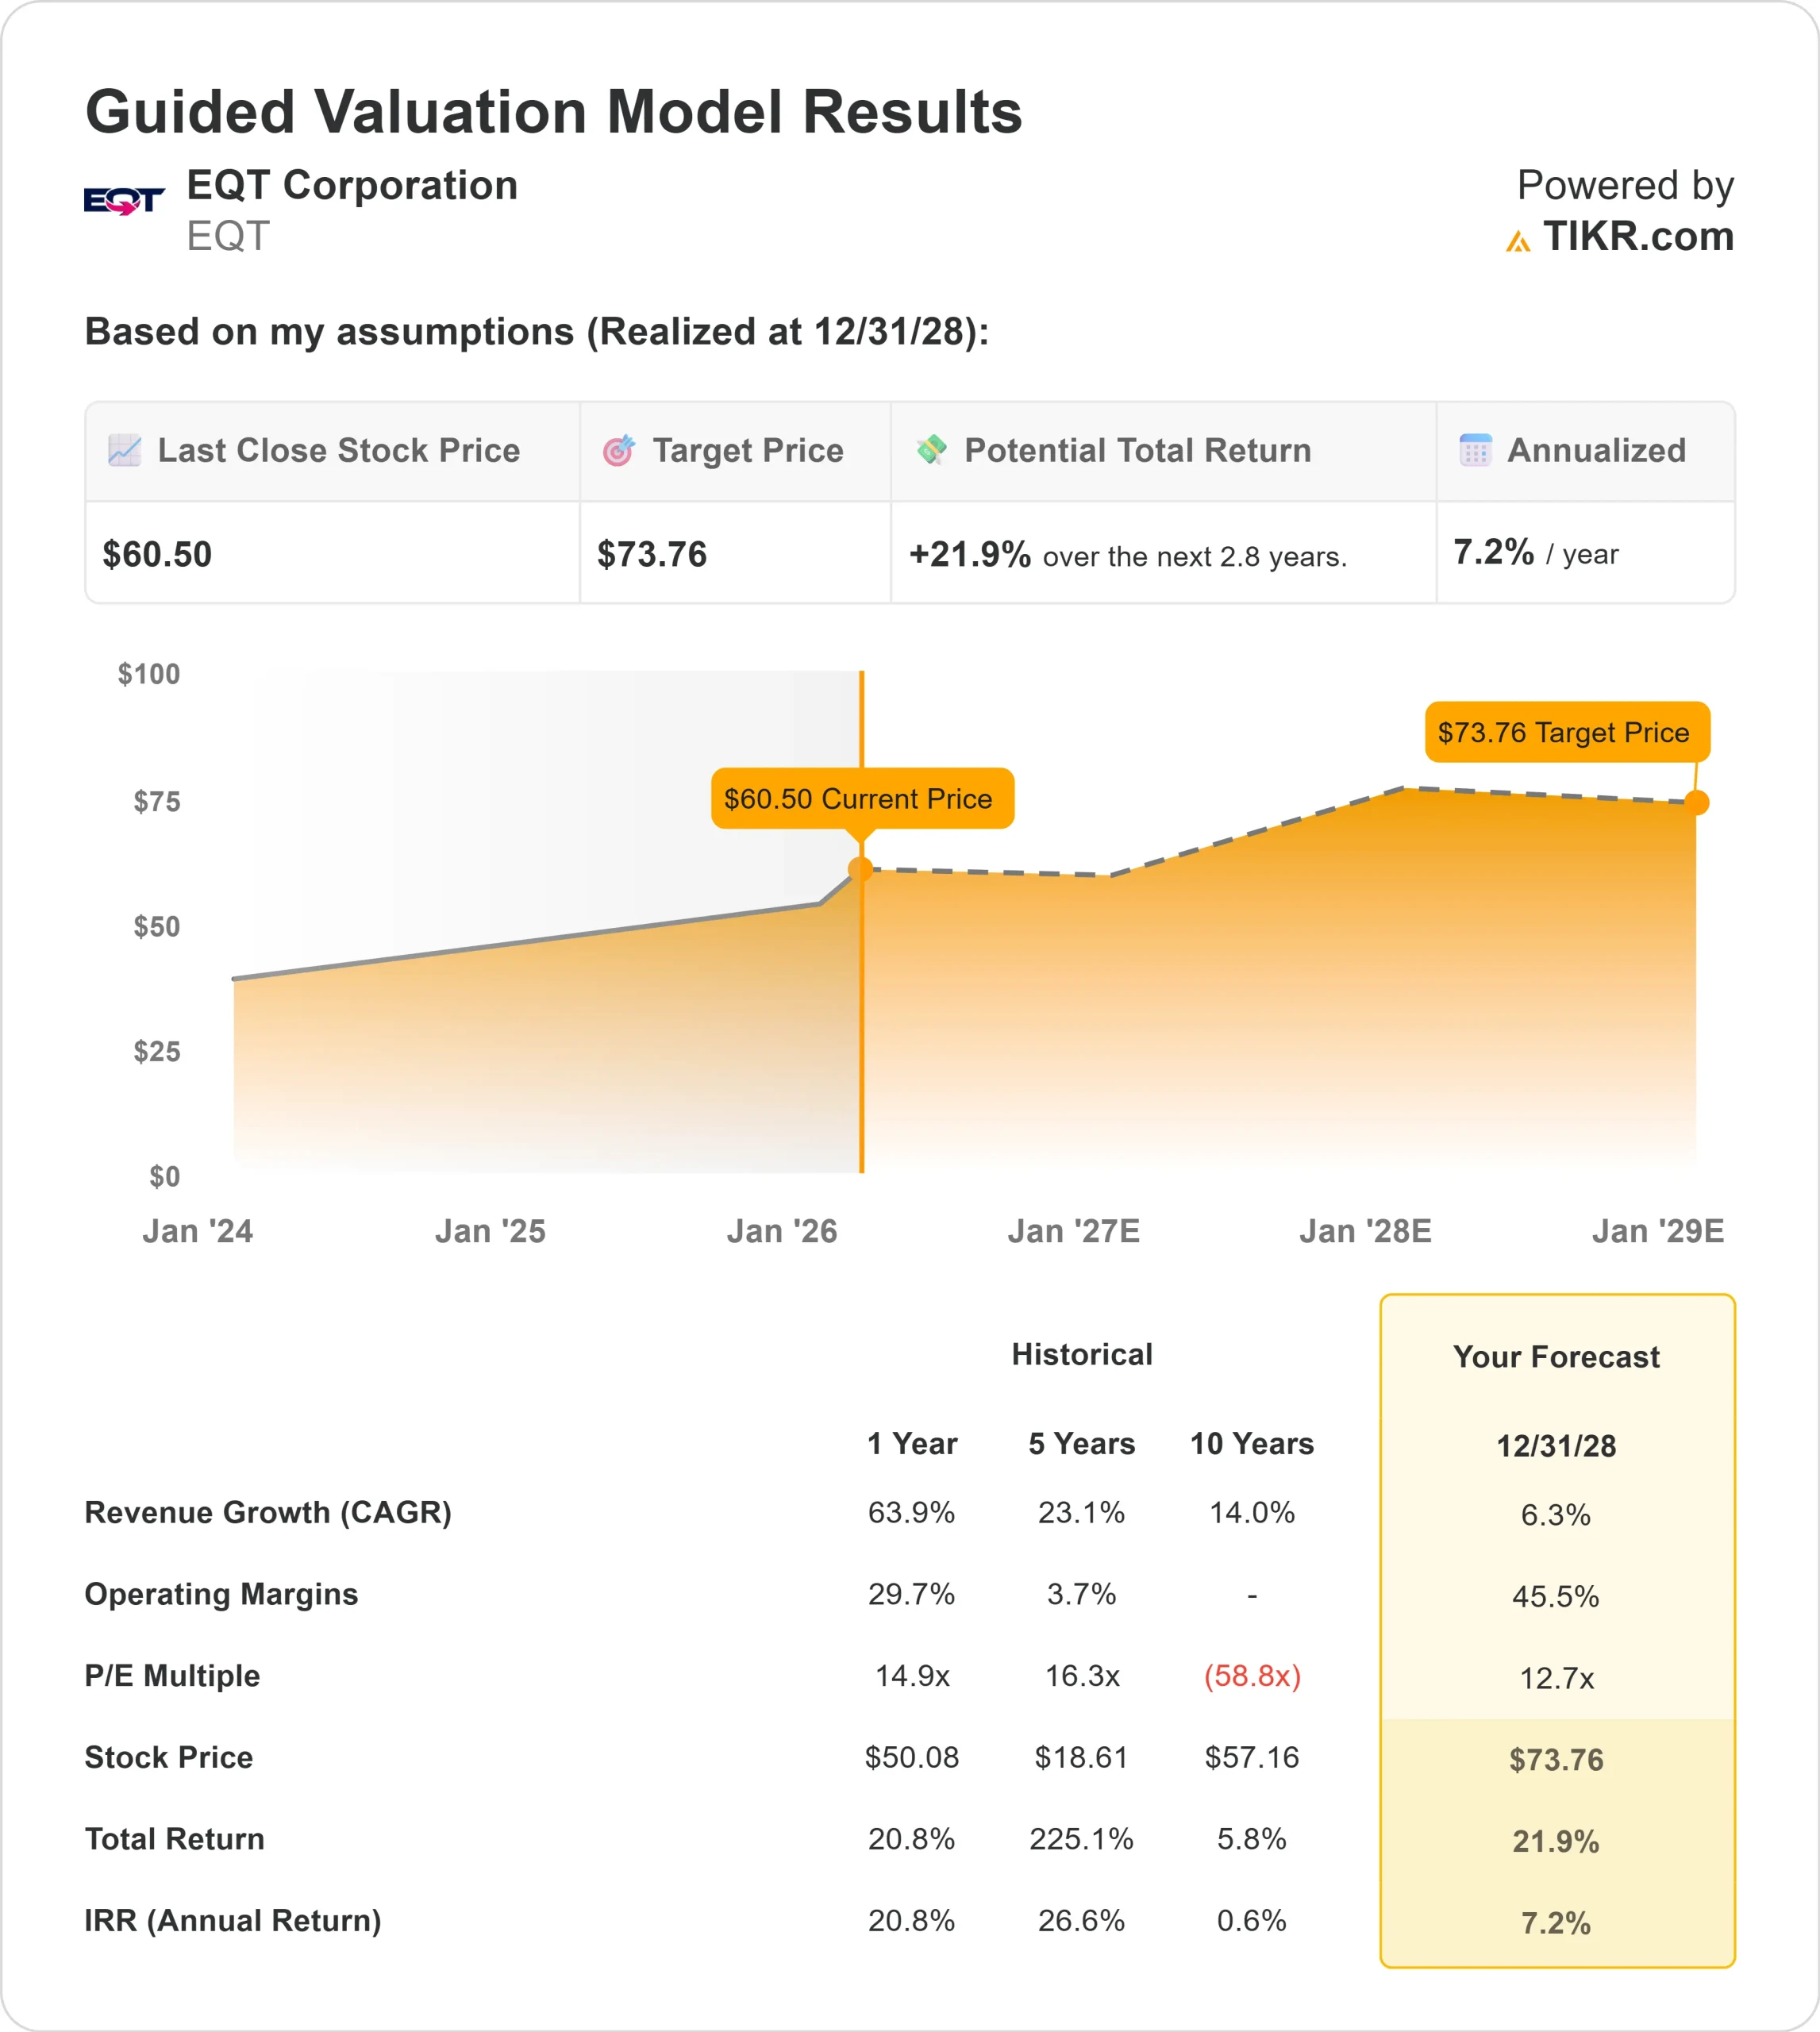
- Valuation Model Target Price: $74
- Implied Upside: 22%
Value your favorite stocks like EQT Corporation with 5 years of analysts’ forecasts using TIKR’s new Valuation Model (It’s free) >>>
What Happened?
EQT Corporation stock shares have risen about 13% over the last six months, recently trading near $59 per share as investors reacted to analyst upgrades, firmer natural gas pricing, and improving free cash flow visibility.
The stock moved above its 50 day moving average near $55 on volume of roughly 8 million shares, reinforcing positive momentum across the energy space.
The advance was fueled by bullish analyst revisions that strengthened confidence in EQT’s earnings outlook. Wells Fargo raised its price target to $70 from $66 and maintained an Overweight rating, while TD Cowen lifted its target to $70 from $65 and reiterated a Buy rating.
TD Securities upgraded the stock to Strong Buy, and the broader Street consensus stands at Moderate Buy with an average price target near $65 across 1 Strong Buy, 19 Buy, 5 Hold, and 1 Sell ratings.
Those upgrades reflected growing confidence in EQT’s free cash flow generation and leverage to tightening gas markets.
Institutional buying added further support. Advisors Preferred LLC initiated a new Q3 stake of roughly 18,000 shares valued near $1 million.
Sound Shore Management increased its position by 32% to about 1.5 million shares worth $83 million, while Reaves W H & Co. boosted its stake by 213% to about 1.0 million shares valued near $56 million.
Canada Post Corp Registered Pension Plan, Mitsubishi UFJ Trust & Banking Corp, and Cullen Frost Bankers also materially increased their holdings. Institutional investors now own about 91% of the stock.
Options activity shows some near-term hedging as shares climbed. Investors purchased roughly 35,000 put contracts, about 77% above normal volume, while short interest declined 16% to around 22 million shares, or roughly 4% of shares outstanding.
The combination of rising analyst confidence, strong institutional accumulation, and easing short pressure has supported the stock’s steady six-month advance.
See analysts’ growth forecasts and price targets for EQT Corporation (It’s free) >>>
Is EQT Corporation Undervalued?
Under valuation assumptions, the stock is modeled using:
- Revenue Growth (CAGR): 6%
- Operating Margins: 46%
- Exit P/E Multiple: 13x
EQT’s growth outlook is supported by disciplined production management and improved market access through infrastructure investments such as the Mountain Valley Pipeline and Clarington Connector.
These projects enhance exposure to premium demand regions and reduce basis volatility, directly supporting realized pricing and cash margins.

Operational efficiency remains a key driver. Compression investments delivered 15% greater-than-expected base production uplift, and well costs per lateral foot declined 13% year over year.
Lower structural costs allow incremental gas price strength to translate more directly into free cash flow, strengthening per-share value even without aggressive production growth.
Management expects 2026 adjusted EBITDA of approximately $6.5 billion and free cash flow of about $3.5 billion, providing flexibility for continued deleveraging, infrastructure growth investments, and potential shareholder returns.
Marketing optimization contributed over $200 million of free cash flow uplift last year relative to guidance, reinforcing earnings quality.
Based on these inputs, the model estimates a target price of $74, implying roughly 22% upside from current levels.
At current levels near $59, EQT appears undervalued, with 2026 performance likely driven by LNG demand growth, infrastructure expansion, disciplined capital spending, and sustained free cash flow generation rather than speculative volume growth.
Estimate a company’s fair value instantly (Free with TIKR) >>>
Value Any Stock in Under 60 Seconds (It’s Free)
With TIKR’s new Valuation Model tool, you can estimate a stock’s potential share price in under a minute.
All it takes is three simple inputs:
- Revenue Growth
- Operating Margins
- Exit P/E Multiple
From there, TIKR calculates the potential share price and total returns under Bull, Base, and Bear scenarios so you can quickly see whether a stock looks undervalued or overvalued.
If you’re not sure what to enter, TIKR automatically fills in each input using analysts’ consensus estimates, giving you a quick, reliable starting point.
See a stock’s true value in under 60 seconds (Free with TIKR) >>>