Key Takeaways:
- Schneider Electric is a global leader in energy management and industrial automation, helping customers improve efficiency, reliability, and sustainability across buildings, infrastructure, and industry.
- SU stock could reasonably reach €371 per share by December 2029, based on our valuation assumptions.
- This implies a total return of 57.5% from today’s price of €235, with an annualized return of 12.1% over the next 4.0 years.
Schneider Electric S.E. (SU) is reinforcing its position as a leading provider of integrated energy management and automation solutions by scaling digital platforms, software, and services.
The company focuses on helping customers digitize and electrify their operations to cut energy waste and support the global transition to low‑carbon infrastructure.
Over the past decade, Schneider Electric has combined steady organic growth with margin discipline and portfolio optimization. The stock price has compounded strongly over 5 and 10 years, supported by rising earnings, expanding returns, and investors’ growing focus on electrification and efficiency solutions.
Here’s why Schneider Electric stock could continue to offer solid long-term returns as it executes on its electrification and digitalization strategy while maintaining a strong financial track record.
What the Model Says for Schneider Electric Stock
Under the base case, the analysis looks at how SU’s earnings power could evolve as demand for energy efficiency, automation, and grid modernization continues to grow.
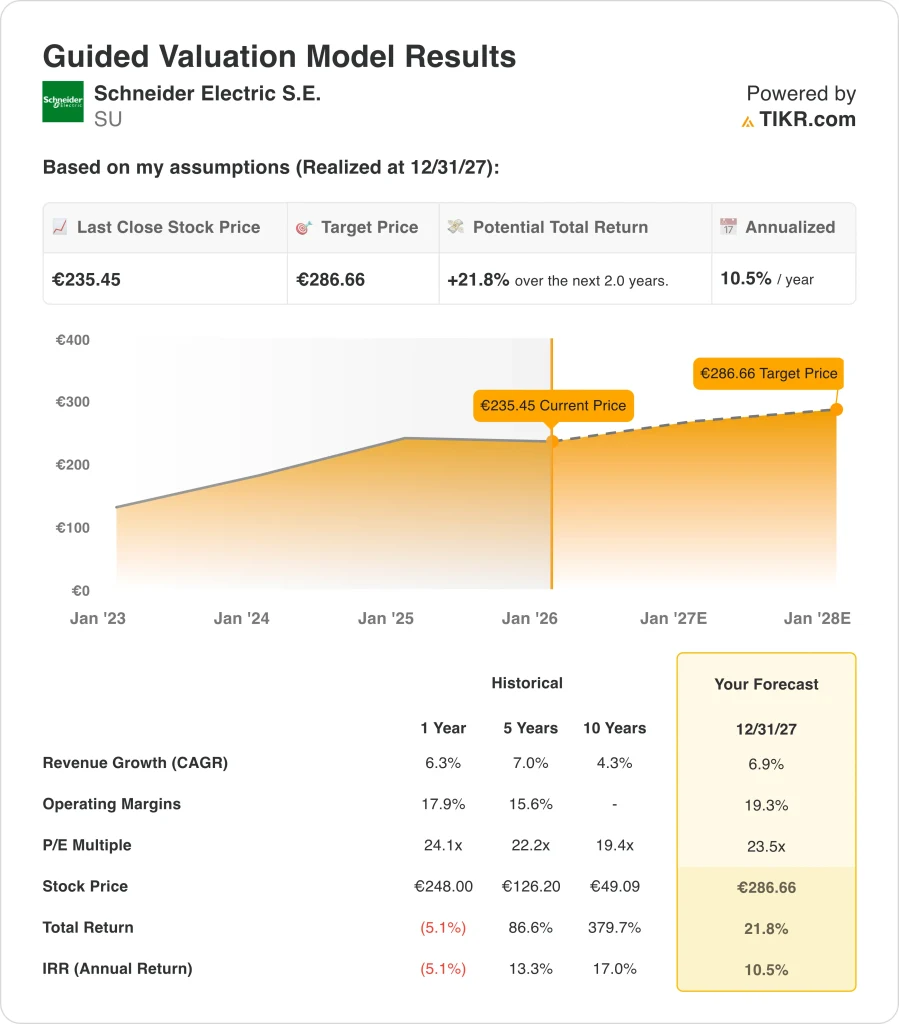
Based on estimates of 6.9% annual revenue growth, 19.3% net income margins, and a normalized exit P/E multiple of 23.5x, the model projects SU stock could rise from €235 to €287 per share.
That would be a 21.8% total return, or a 10.5% annualized return over the next 2.0 years.
Our Valuation Assumptions
TIKR’s Valuation Model lets you plug in your own assumptions for a company’s revenue growth, operating margins, and P/E multiple, and calculates the stock’s expected returns.
Here’s what we used for Schneider Electric stock:
1. Revenue Growth: 6.9%
Schneider Electric has delivered consistent top-line growth over time, with historical revenue compound annual growth rates (CAGR) of 6.3% over the past year, 7.0% over five years, and 4.3% over ten years.
Based on analysts’ consensus estimates, the model assumes revenue growth of 7.2% in the low case, 8.0% in the mid case, and 8.9% in the high case from 2024 to 2030. These assumptions reflect Schneider’s exposure to structural themes like electrification, automation, and digital services, while still remaining within a range consistent with the company’s historical performance profile.
2. Operating Margins: 19.3%
Historically, Schneider Electric has combined solid revenue growth with improving profitability. Net income margins have averaged 11.3% over the last year, 10.8% over five years, and 9.5% over ten years, indicating gradual margin expansion as the business scales its higher-value offerings.
Based on analysts’ consensus estimates, we assumes an earnings-per-share (EPS) growth assumptions of 7.8% in the low case, 10.6% in the mid case, and 12.3% in the high case between 2024 and 2030.
At the same time, it assumes a modest contraction in the price-to-earnings (P/E) multiple, with a P/E CAGR of negative 4.7% in the low case, negative 2.7% in the mid case, and negative 0.8% in the high case.
3. Exit P/E Multiple: 23.5x
Under these assumptions, the mid-case scenario results in a forecast share price of €370 by the end of 2029, compared with the current stock price of €235 in the model.
This equates to the 57.5% total return and 12.1% annualized IRR mentioned earlier, suggesting that SU could still offer attractive long-term returns if it delivers on its growth and margin trajectory.
Build your own Valuation Model to value any stock (It’s free!) >>>
What Happens If Things Go Better or Worse?
Different scenarios for Schneider Electric through 2030 naturally produce a range of potential outcomes rather than a single fixed result (these are estimates, not guaranteed returns):
- Low Case: Lower growth and steeper multiple compression lead → 6.3% annual returns
- Mid Case: Steady revenue growth around 8%, EPS growth above 10%, and only moderate P/E contraction → 12.1% annual returns
- High Case: Continued execution on electrification and digitalization initiatives, and healthy capital allocation → 17.3% annual returns
These scenarios highlight how Schneider’s future returns depend on both operational performance and market valuation.

See what analysts think about SU stock right now (Free with TIKR) >>>
How Much Upside Does Schneider Electric Stock Have From Here?
With TIKR’s new Valuation Model tool, you can estimate a stock’s potential share price in under a minute.
All it takes is three simple inputs:
- Revenue Growth
- Operating Margins
- Exit P/E Multiple
If you’re not sure what to enter, TIKR automatically fills in each input using analysts’ consensus estimates, giving you a quick, reliable starting point.
From there, TIKR calculates the potential share price and total returns under Bull, Base, and Bear scenarios so you can quickly see whether a stock looks undervalued or overvalued.
See a stock’s true value in under 60 seconds (Free with TIKR) >>>
Looking for New Opportunities?
- See what stocks billionaire investors are buying so you can follow the smart money.
- Analyze stocks in as little as 5 minutes with TIKR’s all-in-one, easy-to-use platform.
- The more rocks you overturn… the more opportunities you’ll uncover. Search 100K+ global stocks, global top investor holdings, and more with TIKR.
Disclaimer:
Please note that the articles on TIKR are not intended to serve as investment or financial advice from TIKR or our content team, nor are they recommendations to buy or sell any stocks. We create our content based on TIKR Terminal’s investment data and analysts’ estimates. Our analysis might not include recent company news or important updates. TIKR has no position in any stocks mentioned. Thank you for reading, and happy investing!