
Key Takeaways:
- Air France-KLM is rebuilding profitability and balance sheet strength after the pandemic, and is achieving ongoing cost efficiencies across its network and low-cost Transavia operations.
- AF stock could reasonably reach €14 per share by December 2029, based on our valuation assumptions.
- This implies a total return of 20.2% from today’s price of €11, with an annualized return of 4.8% over the next 4.0 years.
Air France-KLM SA (AF) is one of Europe’s leading airline groups, operating the Air France, KLM, and Transavia brands. The group is focusing on disciplined capacity management and strict cost control as it works to reinforce margins.
The recovery in traffic is helping AF stabilize earnings even as competitive pressures remain key risks for the coming years.
Here’s why Air France-KLM stock could still offer moderate return potential through 2029 as it continues to repair its balance sheet.
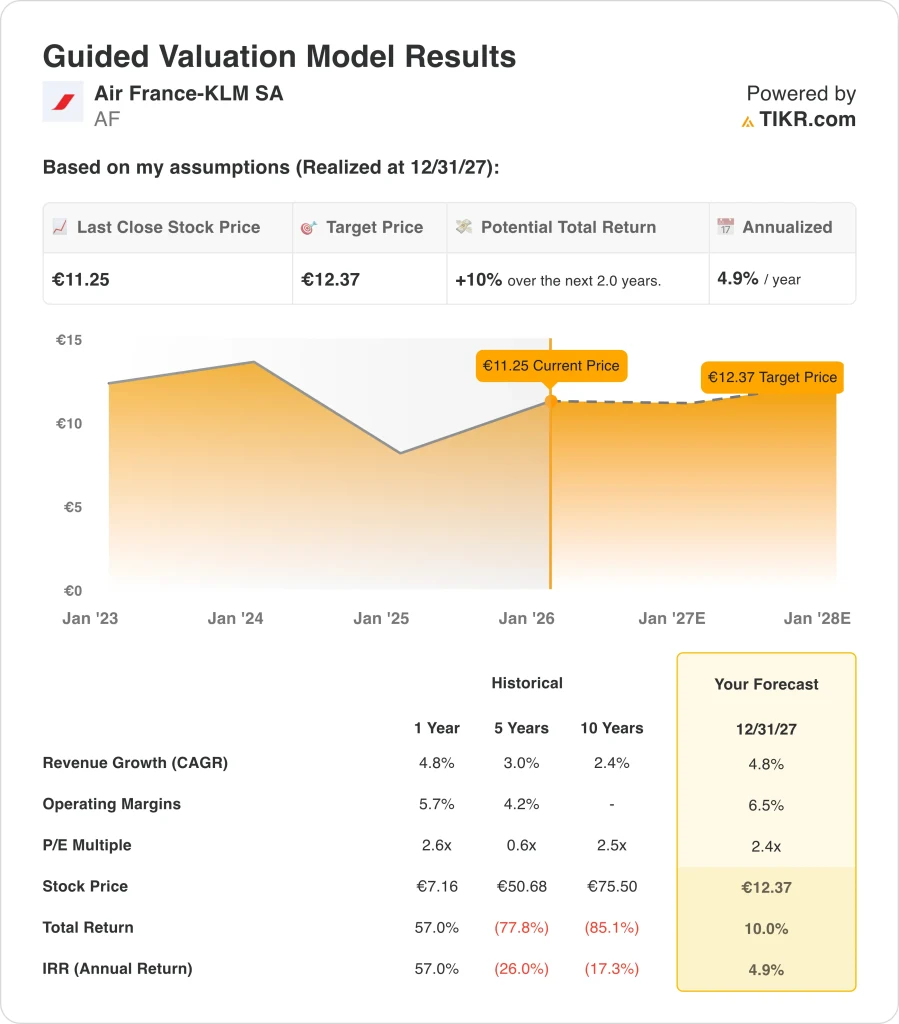
What the Model Says for Air France-KLM SA Stock
We analyzed the potential outcomes for Air France-KLM stock using TIKR’s Valuation Model, focusing on the group’s normalized earnings power and valuation.
Based on mid‑case estimates of 4.8% annual revenue growth, a 6.5% operating margin, and an exit P/E multiple of 2.4x, the model projects that Air France-KLM’s share price could move from €11 to €12.
That would be a 10% total return, or a 4.9% annualized return over the next 2.0 years.
Our Valuation Assumptions
TIKR’s Valuation Model lets you plug in your own assumptions for a company’s revenue growth, operating margins, and P/E multiple, and calculates the stock’s expected returns.
Here’s what we used for Air France stock:
1. Revenue Growth: 4.8%
Air France-KLM’s historical revenue trajectory reflects both cyclical pressure and post‑pandemic normalization. Over the last year, revenue grew 4.8% as demand remained healthy and pricing stayed relatively firm, highlighting a long‑term trend of modest expansion rather than rapid structural growth.
Based on analysts’ consensus estimates, we assume a 2.9% annual revenue growth from 2026 to 2030, which aligns closely with the company’s historical averages.
2. Operating Margins: 6.5%
Air France-KLM’s profitability has improved from pandemic lows as load factors recovered and unit revenues strengthened.
Based on analysts’ consensus estimates, we use a 6.5% operating margin, which assumes AF can sustain a modestly positive margin profile through cost efficiencies and capacity management.
3. Exit P/E Multiple: 2.4x
Airline stocks often trade at low earnings multiples due to their cyclical earnings and exposure to exogenous shocks. Air France-KLM is no exception, with its multiple reflecting both recovery progress and residual balance sheet.
Based on analysts’ consensus estimates, we apply a 2.4x exit P/E multiple to AF by 2027, which is consistent with a cautious view on how the market may value the company’s normalized earnings.
Build your own Valuation Model to value any stock (It’s free!) >>>
What Happens If Things Go Better or Worse?
Different scenarios for AF stock through 2030 show a wide range of potential outcomes depending on traffic trends, cost inflation, and capital allocation discipline (these are estimates, not guaranteed returns):
- Low Case: Higher fuel costs, wage inflation, or weaker demand would largely offset operational improvements → 0.1% annual returns
- Mid Case: Relatively steady macro environment, continued cost control, and stable competitive dynamics → 4.8% annual returns
- High Case: Strong travel demand, effective yield management, and disciplined capacity decisions could support higher profitability→ 8.8% annual returns
For prospective buyers, this may imply a need for either a larger margin of safety on the entry price. For existing shareholders, the results highlight how future returns are likely to depend heavily on AF’s ability to sustain profitability improvements.

See what analysts think about AF stock right now (Free with TIKR) >>>
How Much Upside Does Air France Stock Have From Here?
With TIKR’s new Valuation Model tool, you can estimate a stock’s potential share price in under a minute.
All it takes is three simple inputs:
- Revenue Growth
- Operating Margins
- Exit P/E Multiple
If you’re not sure what to enter, TIKR automatically fills in each input using analysts’ consensus estimates, giving you a quick, reliable starting point.
From there, TIKR calculates the potential share price and total returns under Bull, Base, and Bear scenarios so you can quickly see whether a stock looks undervalued or overvalued.
See a stock’s true value in under 60 seconds (Free with TIKR) >>>
Looking for New Opportunities?
- See what stocks billionaire investors are buying so you can follow the smart money.
- Analyze stocks in as little as 5 minutes with TIKR’s all-in-one, easy-to-use platform.
- The more rocks you overturn… the more opportunities you’ll uncover. Search 100K+ global stocks, global top investor holdings, and more with TIKR.
Disclaimer:
Please note that the articles on TIKR are not intended to serve as investment or financial advice from TIKR or our content team, nor are they recommendations to buy or sell any stocks. We create our content based on TIKR Terminal’s investment data and analysts’ estimates. Our analysis might not include recent company news or important updates. TIKR has no position in any stocks mentioned. Thank you for reading, and happy investing!