Key Takeaways:
- Revenue Base: Mediobanca produces about €3 billion in annual revenue, with wealth management and advisory fees providing stable income without requiring aggressive balance sheet growth.
- Profit Efficiency: Operating margins near 55% support roughly €1 billion in net income, highlighting a capital-light model that converts earnings into distributable returns efficiently.
- Valuation Range: The stock trades between 9x and 12x earnings which reflects a moderate growth expectations despite consistent fee-driven profitability and limited credit risk.
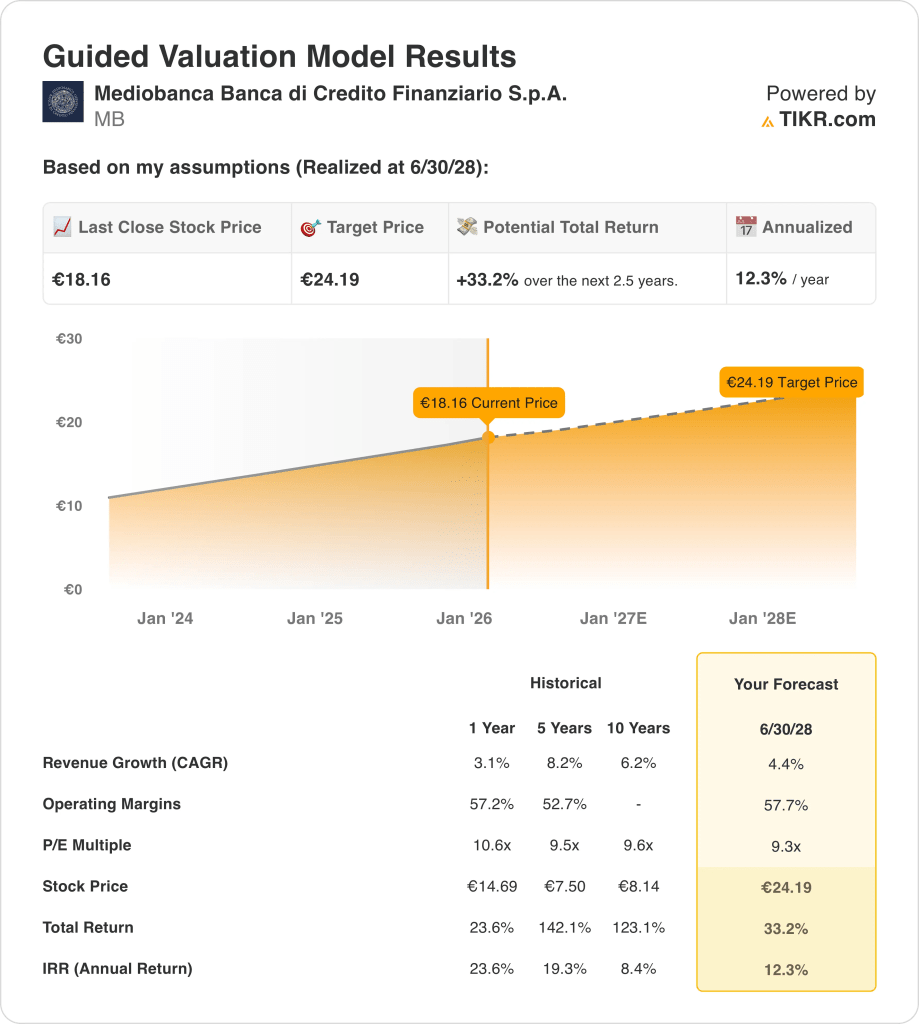
- Price Projection: Based on 4.4% revenue growth, 57.7% operating margins, and a 9.3x exit P/E, the model implies a €24 target price which is about 33% upside over the next 2.5 years.
Mediobanca (MB) is a diversified Italian financial group focused on wealth management, consumer finance, and investment banking, operating in a European banking sector shaped by normalized interest rates and tighter capital discipline.
In December 2025, Monte dei Paschi di Siena reaffirmed full trust in CEO Luigi Lovaglio while confirming ongoing working groups with Mediobanca aimed at accelerating operational and strategic synergies.
On a trailing basis, Mediobanca generated roughly €3 billion in total revenue, supported by stable net interest income and growing fee contributions from wealth management and advisory activities.
Net income reached about €1 billion with operating margins near 55%, reflecting the strength of its asset-light model compared with traditional retail-focused Italian banks.
Even as earnings quality and capital returns remain strong, the share price continues to reflect caution tied to ownership changes and consolidation dynamics, creating tension between fundamentals and market perception.
What the Model Says for Mediobanca Stock
We analyzed Mediobanca using assumptions reflecting its fee-driven banking model, capital-light structure, and consistent capital returns through dividends and buybacks.
Based on 4.4% annual revenue growth, 57.7% operating margins, and a 9.3x exit P/E, the model projects the stock reaching €24.19.
That implies a 33.2% total return, or a 12.3% annualized return, over the next 2.5 years to €24.19.
Estimate a company’s fair value instantly (Free with TIKR) >>>
Our Valuation Assumptions
TIKR’s Valuation Model lets you plug in your own assumptions for a company’s revenue growth, operating margins, and P/E multiple, and calculates the stock’s expected returns.
Here’s what we used for MB stock:
1. Annual Revenue Growth: 4.4%
Mediobanca generated roughly €3 billion in annual revenue, with historical growth between 6% and 8% over five years, supported by wealth management and advisory fees rather than balance-sheet expansion.
Recent revenue growth slowed to about 3% as rate normalization reduced trading income, but fee-based segments remained stable, anchoring forward growth to recurring client activity.
Forward growth depends on continued expansion in wealth management and consumer finance volumes, offset by limited loan book growth and a more normalized capital markets environment.
Pooled market forecasts point to 4.4% revenue growth, reflecting Mediobanca’s recurring fee income, moderate cyclicality, and limited reliance on balance-sheet expansion.
2. Operating Margins: 57.7%
Mediobanca has consistently operated with margins above 50%, reflecting a capital-light structure where advisory, asset management, and insurance holdings dominate earnings generation.
Margins remained near 57% recently as cost discipline and limited credit risk offset weaker trading income and normalized interest margins across European banking.
Sustaining margins depends on fee mix stability and controlled operating expenses, while risks include lower capital markets activity or higher compliance and personnel costs.
Analyst consensus projections place operating margins at 57.7%, representing normalized profitability that sits comfortably within Mediobanca’s historical range and reflects strong operating leverage.
3. Exit P/E Multiple: 9.3x
Mediobanca has historically traded at earnings multiples between roughly 9x and 11x, reflecting steady profitability, strong capital returns, and limited balance-sheet risk.
The current valuation reflects investor caution toward Italian financials despite consistent earnings and dividends, keeping multiples near the lower end of historical norms.
Multiple expansion would require stronger revenue acceleration or sector re-rating, while downside risk is limited by capital strength and recurring fee income.
Street consensus estimates support a 9.3× exit multiple, consistent with stable execution, tempered growth expectations, and valuation discipline in line with Mediobanca’s long-term trading history.
Build your own Valuation Model to value any stock (It’s free!) >>>
What Happens If Things Go Better or Worse?
Mediobanca’s outcomes depend on fee income durability, credit quality discipline, and cost control across wealth management and advisory activities, setting up a range of possible paths through 2031.
- Low Case: If advisory activity slows, consumer finance remains cautious, and cost efficiency plateaus, revenue grows around 3.7%, net margins stay near 35.2%, and valuation stays constrained, leaving returns reliant on earnings resilience → 6.9% annualized return.
- Mid Case: With core wealth management and advisory franchises performing as expected, revenue growth near 4.1%, net margins improving toward 37.6%, and valuation stabilizing, steady earnings expansion supports measured upside → 11.6% annualized return.
- High Case: If advisory volumes strengthen, consumer finance execution improves, and operating discipline tightens, revenue reaches about 4.5%, net margins approach 39.2%, and valuation pressure eases, allowing faster price appreciation → 15.3% annualized return.
Execution across fee-based businesses, capital discipline, and cost control matters more than macro timing, as outcomes hinge on sustaining profitability rather than balance-sheet expansion.

How Much Upside Does Mediobanca Have From Here?
With TIKR’s new Valuation Model tool, you can estimate a stock’s potential share price in under a minute.
All it takes is three simple inputs:
- Revenue Growth
- Operating Margins
- Exit P/E multiple
If you’re not sure what to enter, TIKR automatically fills in each input using analysts’ consensus estimates, giving you a quick, reliable starting point.
From there, TIKR calculates the potential share price and total returns under Bull, Base, and Bear scenarios so you can quickly see whether a stock looks undervalued or overvalued.
See a stock’s true value in under 60 seconds (Free with TIKR) >>>
Looking for New Opportunities?
- See what stocks billionaire investors are buying so you can follow the smart money.
- Analyze stocks in as little as 5 minutes with TIKR’s all-in-one, easy-to-use platform.
- The more rocks you overturn… the more opportunities you’ll uncover. Search 100K+ global stocks, global top investor holdings, and more with TIKR.
Disclaimer:
Please note that the articles on TIKR are not intended to serve as investment or financial advice from TIKR or our content team, nor are they recommendations to buy or sell any stocks. We create our content based on TIKR Terminal’s investment data and analysts’ estimates. Our analysis might not include recent company news or important updates. TIKR has no position in any stocks mentioned. Thank you for reading, and happy investing!