Key Takeaways:
- Eiffage SA is one of Europe’s leading construction and concessions groups, operating across infrastructure, civil engineering, and energy transition projects.
- FGR stock could reasonably reach €142 per share by December 2029, based on our valuation assumptions.
- This implies a total return of 13.1% from today’s price of €126, with an annualized return of 3.1% over the next 4.0 years.
Eiffage SA (FGR) is strengthening its position as a diversified construction and concessions leader through strategic infrastructure projects and energy transition initiatives across France and international markets while maintaining its integrated business model spanning construction, concessions, and energy services.
The European infrastructure giant operates through five key divisions: Construction, Infrastructure, Energy Systems, Concessions, and Real Estate Development, serving both public and private sector clients with end-to-end solutions across the infrastructure value chain.
Eiffage demonstrates operational resilience through its diversified business model spanning construction activities and long-term concession assets. The company maintains a strong order book across infrastructure segments while expanding its energy transition capabilities and renewable energy projects.
Here’s why Eiffage stock could provide steady returns through 2029 as it executes on its infrastructure backlog and benefits from European infrastructure spending trends while leveraging its integrated concessions portfolio.
What the Model Says for Eiffage Stock
We analyzed the upside potential for Eiffage stock using valuation assumptions based on its diversified infrastructure exposure, recurring concession revenues, and positioning in European energy transition investments.
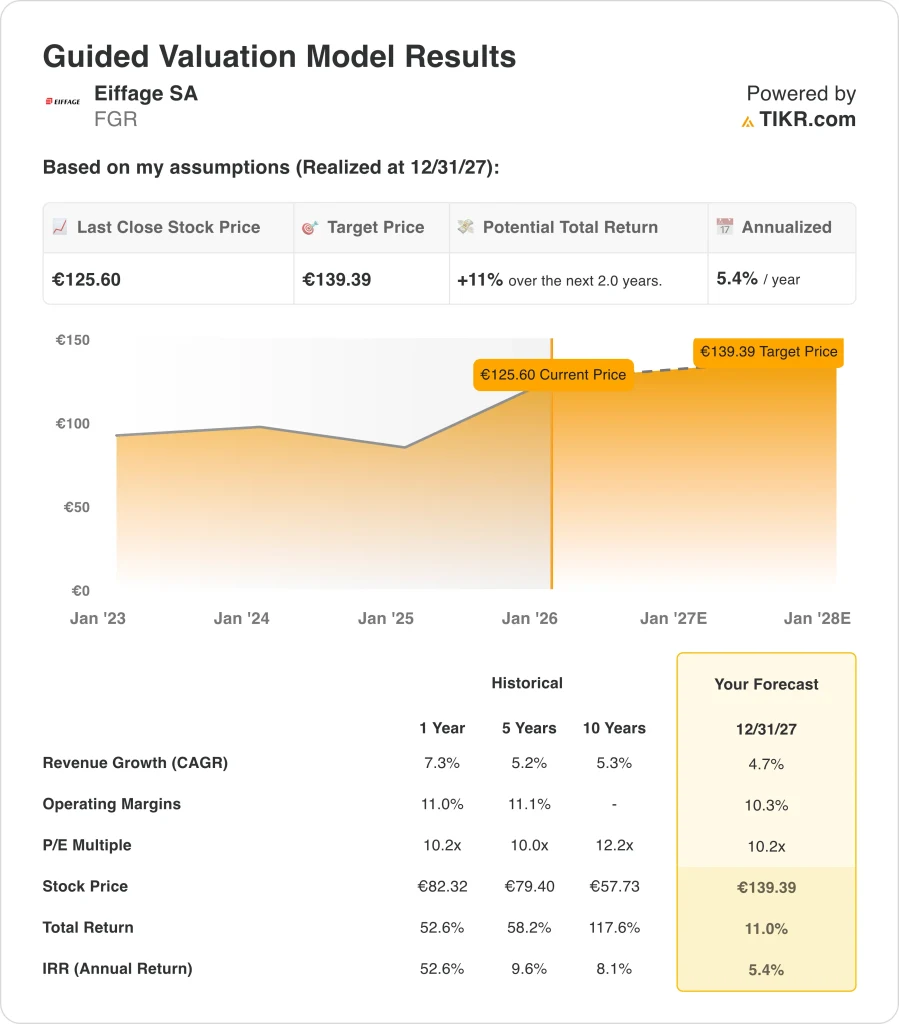
Based on estimates of 4.7% annual revenue growth, 10.3% operating margins, and a normalized P/E multiple of 10.2x, the model projects Eiffage stock could rise from €126 to €139 per share.
That would be a 11% total return, or a 5.4% annualized return over the next 2.0 years.
Keep in mind this doesn’t include the stock’s 4.1% dividend yield.
Our Valuation Assumptions
TIKR’s Valuation Model lets you plug in your own assumptions for a company’s revenue growth, operating margins, and P/E multiple, and calculates the stock’s expected returns.
Here’s what we used for Eiffage stock:
1. Revenue Growth: 4.7%
Eiffage has demonstrated consistent revenue growth over multiple periods, with historical annual revenue growth of 7.3% over the past year, stabilizing toward a 5.2% five-year compound annual growth rate (CAGR) and 5.3% ten-year CAGR. The company’s diversified business segments provide multiple growth vectors across construction, infrastructure, and renewable energy markets.
The Construction segment continues to benefit from France’s urban redevelopment initiatives and European property development demand. The Infrastructure segment capitalizes on European Union funding for transportation and civil engineering projects, particularly in France and neighboring markets.
Importantly, Eiffage’s Concessions segment offers long-term growth potential through renewable energy development, including hydro and solar projects that align with Europe’s decarbonization objectives and energy security priorities. Additionally, the Energy Systems segment generates recurring revenue through the installation and maintenance of energy and telecommunications systems, resulting in stable baseline growth.
Looking forward, the 4.7% revenue growth assumption reflects Eiffage’s ability to sustain moderate growth across these diversified segments while remaining balanced against any near-term economic headwinds in European construction and infrastructure markets.
2. Operating Margins: 10.3%
Eiffage achieved operating margins of 11.0% in the most recent period, representing healthy operational efficiency across its diverse business portfolio. Historically, the company maintained operating margins of 11.1% over five years, demonstrating consistency in profitability management.
The company’s cost structure benefits from its integrated approach to construction and concessions, where project management efficiencies and long-term infrastructure contracts provide stable margin profiles. The Concessions segment, in particular, generates high-visibility, long-term cash flows with predictable margins through public-private partnership arrangements.
Management continues to optimize operations across the Construction and Infrastructure segments through improved project execution, supply chain management, and labor efficiency. The Energy Systems segment contributes reliable margins through its recurring service and maintenance contracts.
The 10.3% operating margin assumption reflects Eiffage’s historical performance while accounting for the competitive dynamics in European construction, labor cost pressures, and the ongoing investments necessary to maintain its position across infrastructure and renewable energy markets.
3. Exit P/E Multiple: 10.2x
Eiffage stock currently trades at a P/E multiple of 10.2x, reflecting its established position in European construction and infrastructure, but lower than some higher-growth industrial peers due to the cyclical nature of construction markets.
Historically, the company has traded at multiples ranging from 10.0x (five-year average) to 12.2x (ten-year average), indicating relatively stable valuation over extended periods. The current 10.2x multiple represents a reasonable reflection of the company’s steady cash generation, diversified business segments, and exposure to long-term European infrastructure development trends.
The maintained 10.2x exit multiple is justified by Eiffage’s durable competitive advantages through its established track record in major infrastructure projects, the visibility provided by long-term concession contracts, and its strategic positioning in renewable energy development. Furthermore, the company’s resilience as a diversified contractor with exposure to multiple end markets and geographies provides stability during economic cycles.
Build your own Valuation Model to value any stock (It’s free!) >>>
What Happens If Things Go Better or Worse?
Different scenarios for FGR stock through 2029 show varied outcomes based on infrastructure spending execution, renewable energy project deployment, and competitive positioning (these are estimates, not guaranteed returns):
- Low Case: Infrastructure spending delays and renewable energy project headwinds intensify → -2.5% annualized returns
- Mid Case: Steady infrastructure modernization and renewable energy concession growth drive consistent execution → 3.1% annualized returns
- High Case: European infrastructure acceleration and renewable energy expansion accelerate investment → 7.1% annualized returns
The variation between scenarios reflects the sensitivity of Eiffage’s valuation to European infrastructure spending levels, the pace of renewable energy project deployment, and competitive market conditions.
Keep in mind the return estimates above don’t include the stock’s 4.1% annual dividend yield.

See what analysts think about FGR stock right now (Free with TIKR) >>>
How Much Upside Does Eiffage SA Stock Have From Here?
With TIKR’s new Valuation Model tool, you can estimate a stock’s potential share price in under a minute.
All it takes are three simple inputs:
- Revenue Growth
- Operating Margins
- Exit P/E Multiple
If you’re not sure what to enter, TIKR automatically fills in each input using analysts’ consensus estimates, giving you a quick, reliable starting point.
From there, TIKR calculates the potential share price and total returns under Bull, Base, and Bear scenarios so you can quickly see whether a stock looks undervalued or overvalued.
See a stock’s true value in under 60 seconds (Free with TIKR) >>>
Looking for New Opportunities?
- See what stocks billionaire investors are buying so you can follow the smart money.
- Analyze stocks in as little as 5 minutes with TIKR’s all-in-one, easy-to-use platform.
- The more rocks you overturn… the more opportunities you’ll uncover. Search 100K+ global stocks, global top investor holdings, and more with TIKR.
Disclaimer:
Please note that the articles on TIKR are not intended to serve as investment or financial advice from TIKR or our content team, nor are they recommendations to buy or sell any stocks. We create our content based on TIKR Terminal’s investment data and analysts’ estimates. Our analysis might not include recent company news or important updates. TIKR has no position in any stocks mentioned. Thank you for reading, and happy investing!