Key Takeaways:
- Price Target: Brembo shares are valued at €11 based on a normalized earnings profile and stable end-market demand, representing measured upside from the current €10 range.
- Upside Potential: The model implies roughly 12% total return from today’s €10 price, driven by earnings growth rather than valuation expansion.
- Return Profile: Annualized returns of about 6% reflect conservative assumptions aligned with Brembo’s mature industrial positioning.
- Earnings Base: Operating margins near 10% support consistent profit generation, reinforcing Brembo’s ability to convert modest growth into shareholder returns.
Brembo N.V. (BRE) develops and produces braking systems for cars, motorbikes, and commercial vehicles, generating about €4 billion in annual revenue, which matters because demand is tied directly to global vehicle production trends.
In 2025, the company earned a double “A” CDP environmental score and committed €1 million to hydrogen startup Hydrospark, signaling targeted innovation while keeping capital allocation disciplined.
Revenue has stayed roughly flat year over year as auto volumes normalize, a pattern that matters because Brembo has historically protected earnings even when industry growth slows.
Operating profit stands near €400 million with margins around 10%, reflecting pricing power, high engineering content per vehicle, and scale benefits across OEM and aftermarket channels.
Even with stable profitability and a market value close to €10 billion, the stock trades near 12× earnings, highlighting ongoing investor caution toward cyclical industrial exposure.
What the Model Says for BRE Stock
We evaluated Brembo’s valuation using its stable operating base, capital-light profile, and positioning within normalized global vehicle production cycles.
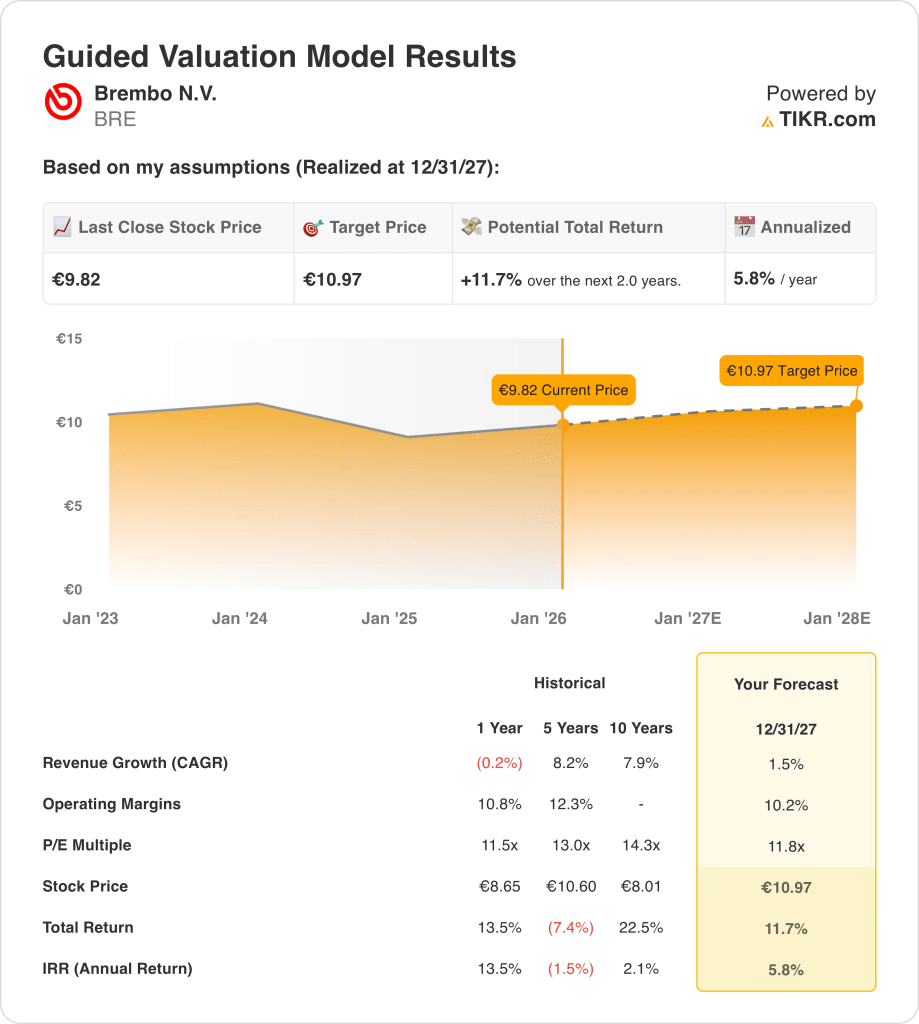
Using assumptions of 1.5% revenue growth, 10.2% operating margins, and an 11.8× exit P/E, the model reflects steady earnings conversion without valuation expansion.
This framework implies a move from €9.82 to €10.97, delivering an 11.7% total return, or 5.8% annualized, over the next two years.
Our Valuation Assumptions
TIKR’s Valuation Model lets you plug in your own assumptions for a company’s revenue growth, operating margins, and P/E multiple, and calculates the stock’s expected returns.
Here’s what we used for BRE stock:
1. Revenue Growth: 1.5%
Brembo’s revenue base has expanded steadily over long cycles, with historical growth averaging mid-single digits during production upswings and flattening as global vehicle volumes normalize.
Recent revenue has been broadly flat as OEM production cooled across Europe and Asia, but aftermarket exposure and premium braking content have cushioned deeper volume pressure.
Forward growth depends on gradual vehicle production recovery, higher electronic braking content per vehicle, and selective motorsport and performance demand, balanced against cyclical sensitivity and OEM pricing discipline.
A 1.5% revenue growth outlook reflects steady replacement demand, resilient aftermarket sales, and modest content expansion per vehicle, without assuming a broad rebound in global auto production.
2. Operating Margins: 10.2%
Brembo has historically sustained operating margins between roughly 10% and 12%, supported by proprietary engineering, premium positioning, and scale advantages across OEM and performance segments.
Margins compressed modestly as volumes normalized and input costs fluctuated, yet pricing power and high value-added braking systems preserved profitability relative to broader auto suppliers.
Margin progression remains tied to mix improvement, automation, and disciplined capital allocation, while competitive pricing pressure and OEM bargaining power limit upside beyond prior cycle peaks.
Operating margins of 10.2% align with Brembo’s long-term profitability profile, supported by pricing discipline, high engineering content, and cost control that remains intact through mid-cycle conditions.
3. Exit P/E Multiple: 11.8x
The company’s valuation has typically ranged between 11× and 14× earnings, reflecting its defensive characteristics within automotive supply and consistent cash generation across cycles.
Current investor sentiment remains cautious toward auto suppliers as electrification investment, volume uncertainty, and slower global production weigh on sector multiples.
Multiple expansion would require sustained volume recovery or structurally higher margins, while downside risk is mitigated by Brembo’s brand strength and aftermarket resilience.
Based on street consensus estimates, an 11.8× exit multiple balances historical trading ranges, normalized earnings quality, and continued investor restraint toward cyclical industrial valuations.
What Happens If Things Go Better or Worse?
Brembo’s outcomes depend on global vehicle production trends, premium braking content adoption, and cost discipline across cycles, setting up a range of possible paths through 2029.
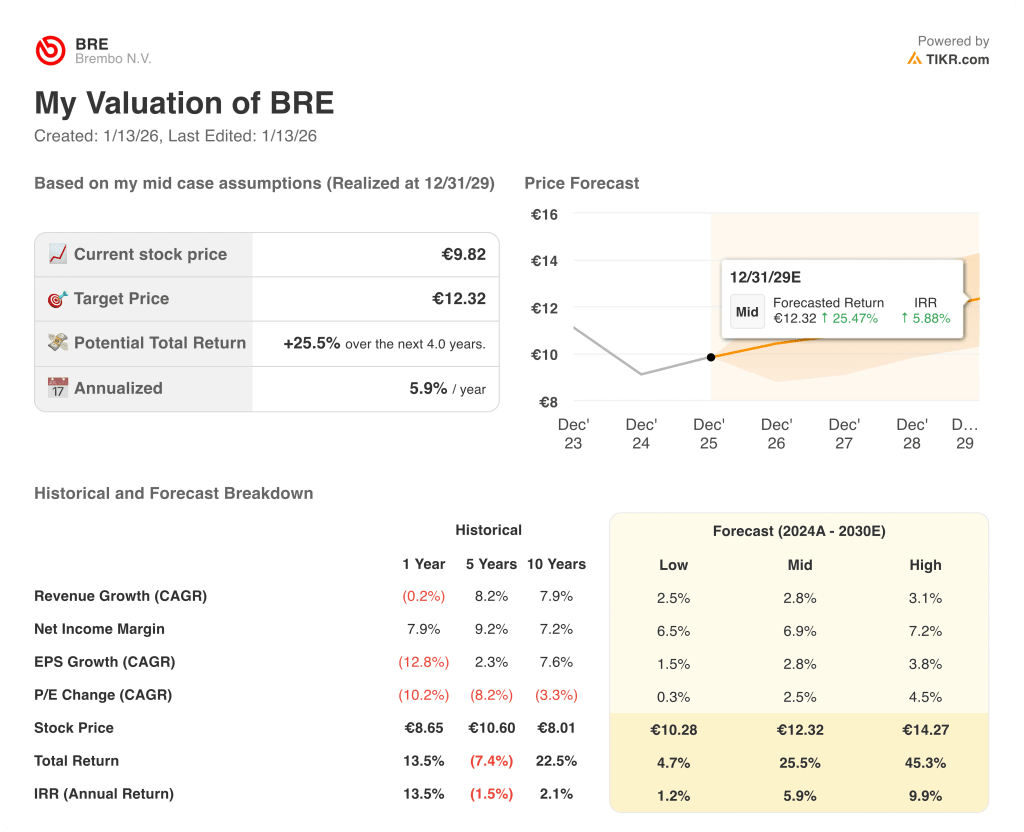
- Low Case: If auto demand stays soft and OEM programs remain cautious, revenue grows around 2.5%, margins hold near 6.5%, and valuation stays restrained, leaving returns tied mainly to gradual earnings progress → 1.2% annualized return.
- Mid Case: With core OEM relationships steady and aftermarket demand intact, revenue growth near 2.8%, margins improving toward 6.9%, and stable valuation support measured appreciation → 5.9% annualized return.
- High Case: If premium content penetration accelerates and cost control remains consistent, revenue reaches about 3.1%, margins approach 7.2%, and valuation pressure eases, allowing stronger share price gains → 9.9% annualized return.
Execution across OEM programs, pricing discipline, and aftermarket stability matters more than macro optimism, as incremental improvements compound steadily over the cycle.
How Much Upside Does Brembo Have From Here?
With TIKR’s new Valuation Model tool, you can estimate a stock’s potential share price in under a minute.
All it takes is three simple inputs:
- Revenue Growth
- Operating Margins
- Exit P/E multiple
If you’re not sure what to enter, TIKR automatically fills in each input using analysts’ consensus estimates, giving you a quick, reliable starting point.
From there, TIKR calculates the potential share price and total returns under Bull, Base, and Bear scenarios so you can quickly see whether a stock looks undervalued or overvalued.
Looking for New Opportunities?
- See what stocks billionaire investors are buying so you can follow the smart money.
- Analyze stocks in as little as 5 minutes with TIKR’s all-in-one, easy-to-use platform.
- The more rocks you overturn… the more opportunities you’ll uncover. Search 100K+ global stocks, global top investor holdings, and more with TIKR.
Disclaimer:
Please note that the articles on TIKR are not intended to serve as investment or financial advice from TIKR or our content team, nor are they recommendations to buy or sell any stocks. We create our content based on TIKR Terminal’s investment data and analysts’ estimates. Our analysis might not include recent company news or important updates. TIKR has no position in any stocks mentioned. Thank you for reading, and happy investing!