
Key Takeaways:
- Licensing Extension: MSCI Inc. extended its core ETF index licensing agreement with BlackRock through 2035, locking in long-duration fee revenue tied to trillions in indexed assets.
- Market Access Expansion: MSCI Inc. agreed to list benchmark index options on the NYSE in 2026, expanding monetization beyond data into derivatives-linked volumes.
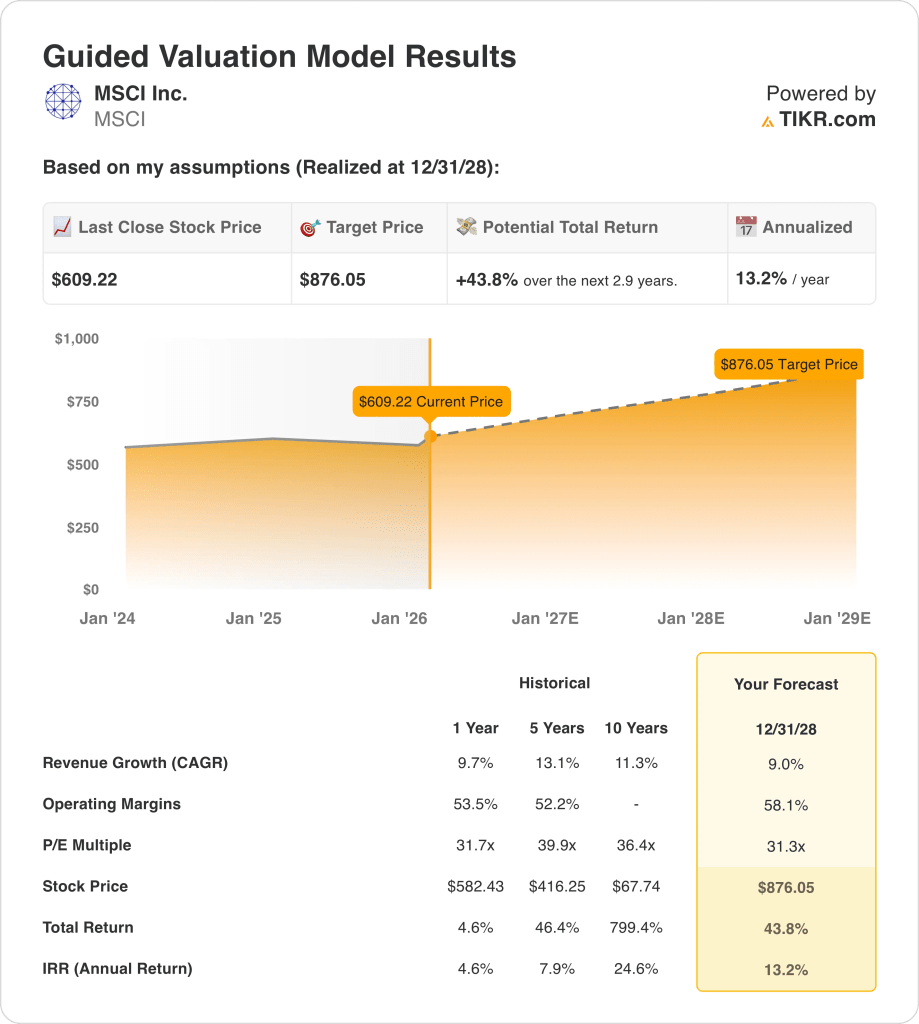
- Valuation Target: Based on 9% revenue growth, 58% operating margins, and a 31x exit multiple, MSCI Inc. stock could reach $876 by December 2028.
- Return Profile: From $609, MSCI implies 44% upside and a 13% annualized return over three years.
MSCI (MSCI) provides index benchmarks, analytics, and ESG data at global scale, influencing portfolio construction across the $139 trillion asset management industry.
In late January 2026, MSCI Inc. extended its BlackRock (BLK) ETF license to 2035 and secured NYSE index options listings, reinforcing distribution power.
MSCI generated $3 billion in revenue and $1 billion in operating profit, reflecting recurring licensing demand and structurally high data margins.
Operating margins near 55% and a $50 billion market capitalization position MSCI Inc. as one of the most efficient information providers in public markets.
Despite consistent execution, MSCI stocktrades near 31x earnings, creating tension between premium fundamentals and restrained valuation assumptions.
What the Model Says for MSCI Stock
MSCI combines recurring index licensing, strong capital returns, and 58 operating margins, supporting durable positioning across global investment workflows.
The model assumes 9% revenue growth, stable margins, and a 31 exit multiple reflecting predictable cash generation.
Under these inputs, MSCI stock reaches $876, implying 44% total upside and 13% annual return.
Our Valuation Assumptions
TIKR’s Valuation Model lets you plug in your own assumptions for a company’s revenue growth, operating margins, and P/E multiple, and calculates the stock’s expected returns.
Here’s what we used for MSCI stock:
1. Revenue Growth: 3%
MSCI generated about $3 billion in recent revenue, rising from roughly $2 billion in 2021 through index and analytics demand.
Growth has slowed from earlier double-digit rates, but recurring index fees and ETF-linked revenue support predictability.
Recent long-dated ETF licensing extensions and options monetization improve revenue visibility, while market cycles limit acceleration.
According to consensus analyst estimates, a 9% revenue growth assumption balances subscription durability with mature scale.
2. Operating Margins:7.6 %
MSCI has sustained operating margins above 50% for several years due to data-driven revenue and strong pricing power.
Margins improved as revenue scaled faster than operating expenses, with data infrastructure costs growing slower than licensing income.
Future margin expansion is limited by continued investment in ESG data, private assets, and regulatory compliance.
In line with analyst consensus projections, a 58.1% operating margin reflects scale efficiency with normalization near peak profitability.
3. Exit P/E Multiple: 7x
MSCI has historically traded at elevated earnings multiples due to recurring revenue, strong margins, and limited competitive substitutes.
Investor caution has risen as revenue growth moderates and valuation sensitivity to asset allocation and ETF flows increases.
Sustaining premium valuation requires stable earnings growth, contract renewals with major asset managers, and relevance in ESG and private assets.
Based on street consensus estimates, a 31.3x exit multiple reflects durable cash generation despite slower growth and premium valuation.
What Happens If Things Go Better or Worse?
MSCI’s outcomes depend on index-linked asset growth, long-term licensing renewals, and margin discipline through 2030.
- Low Case: If asset growth slows and pricing power softens, revenue grows 7.6% and net margins stay near 41.3% → 7.6% annualized return.
- Mid Case: With core index demand holding steady, revenue growth near 8.5% and net margins improve toward 43.4% → 12.3% annualized return.
- High Case: If ETF-linked volumes accelerate and costs scale efficiently, revenue reaches 9.3% and net margins approach 45.0% → 16.7% annualized return.
The $1080 mid-case target price is achievable through steady execution and contract durability, without multiple expansion or market enthusiasm.

How Much Upside Does It Have From Here?
With TIKR’s new Valuation Model tool, you can estimate a stock’s potential share price in under a minute.
All it takes is three simple inputs:
- Revenue Growth
- Operating Margins
- Exit P/E multiple
If you’re not sure what to enter, TIKR automatically fills in each input using analysts’ consensus estimates, giving you a quick, reliable starting point.
From there, TIKR calculates the potential share price and total returns under Bull, Base, and Bear scenarios so you can quickly see whether a stock looks undervalued or overvalued.
Looking for New Opportunities?
- See what stocks billionaire investors are buying so you can follow the smart money.
- Analyze stocks in as little as 5 minutes with TIKR’s all-in-one, easy-to-use platform.
- The more rocks you overturn… the more opportunities you’ll uncover. Search 100K+ global stocks, global top investor holdings, and more with TIKR.
Disclaimer:
Please note that the articles on TIKR are not intended to serve as investment or financial advice from TIKR or our content team, nor are they recommendations to buy or sell any stocks. We create our content based on TIKR Terminal’s investment data and analysts’ estimates. Our analysis might not include recent company news or important updates. TIKR has no position in any stocks mentioned. Thank you for reading, and happy investing!