Earnings growth is the primary driver of long-term stock returns, but not all earnings growth is created equal. Some companies grow earnings through genuine business improvement: expanding revenue, gaining market share, improving efficiency, and reinvesting at high rates of return.
Others generate earnings growth through accounting choices, one-time items, aggressive assumptions, and financial engineering that create the appearance of improvement without substance.
The distinction matters enormously for investors. Real earnings growth compounds over time and eventually shows up in cash flow, dividends, and intrinsic value. Fake earnings growth eventually reverses, often painfully, when the accounting tricks run out or auditors force restatements.
A company that has grown reported earnings 15% annually for five years might be a wonderful compounder or a fraud waiting to unravel. The financial statements provide clues to distinguish between them.
Find out what a stock’s really worth in under 60 seconds with TIKR’s new Valuation Model (It’s free)>>>
The challenge is that management has incentives to present results favorably, as compensation is often tied to earnings targets. Stock prices respond to earnings beats. Analysts reward consistent growth with premium valuations. These pressures push companies toward aggressive accounting choices that inflate current earnings at the expense of future periods. Most of this falls within accepted practice, but that does not make it legitimate.
Evaluating earnings quality requires looking beyond the headline number to how the earnings were generated. Cash flow confirmation, revenue sustainability, margin drivers, and accounting choices all reveal whether growth reflects genuine business improvement or clever presentation. This guide explains how to distinguish real earnings growth from manufactured growth and how to use TIKR to identify companies whose reported results reflect economic reality.
Cash Flow Is the Ultimate Truth Test
The most reliable way to assess earnings quality is to compare reported earnings to cash flow. Accounting earnings involve estimates, assumptions, and timing choices that management can influence. Cash flow is harder to manipulate because cash either exists or it does not. When earnings grow, but cash flow does not, something is wrong.
Over any multi-year period, net income and operating cash flow should track each other reasonably closely. Temporary divergences are normal. A company investing heavily in working capital to support growth might show cash flow lagging earnings for a year or two. But persistent gaps where earnings consistently exceed cash flow indicate that reported profits are not translating into cash in the bank.
Calculate the ratio of operating cash flow to net income over the past five years. A healthy company should show a cumulative cash flow meeting or exceeding cumulative net income over that period. If earnings have grown 50% while cash flow has grown 10%, the earnings growth is suspect. The company is reporting profits it is not collecting.
Free cash flow provides a stricter test because it accounts for capital expenditures required to maintain the business. A company can report growing earnings while free cash flow declines if it is capitalizing expenses, extending asset lives, or underinvesting in maintenance. Comparing free cash flow growth to earnings growth reveals whether the business is generating real economic value or just accounting profits.

TIKR tip: Use TIKR’s Cash Flow Statement to compare operating cash flow and free cash flow to net income over multiple years. A pattern where earnings consistently outpace cash flow is one of the clearest warning signs that reported growth may not be real.
Revenue Quality Drives Everything Else
Earnings growth built on questionable revenue is not sustainable. Revenue recognition offers management significant discretion over when sales are recorded, and aggressive choices can pull future revenue into current periods, creating growth that will reverse.
Watch for revenue growth that outpaces the underlying business metrics. If a software company reports 20% revenue growth, but customer count grew 5%, and pricing increased 3%, the math does not add up. The gap might reflect legitimate factors like upselling or longer contracts, but it might also indicate aggressive recognition of multi-year deals or channel stuffing that will unwind.
Accounts receivable growing faster than revenue is a classic warning sign. When a company books revenue but struggles to collect payment, receivables balloon relative to sales. This pattern can indicate premature revenue recognition, extended payment terms to pull forward sales, or customers who cannot actually pay. Calculate days sales outstanding over time. If DSO is increasing steadily, the company is taking longer to collect, which raises questions about whether the revenue was real in the first place.
Deferred revenue trends matter for subscription and contract-based businesses. Deferred revenue represents cash collected for services not yet delivered. If revenue grows while deferred revenue shrinks, the company may be recognizing revenue faster than customers are paying, which is unsustainable. Healthy subscription businesses show deferred revenue growing alongside or faster than recognized revenue.
Examine the concentration and composition of revenue growth. Growth driven by a few large deals is riskier than growth spread across many customers. Growth from new products or geographies is more sustainable than growth from pulling forward existing demand. Understanding where the revenue comes from helps assess whether it will continue.

TIKR tip: Compare revenue growth to changes in accounts receivable and deferred revenue in TIKR’s Detailed Financials. Divergences among these metrics often reveal revenue recognition issues that call into question earnings quality.
Value any stock in less than 60 seconds with TIKR’s new Valuation Model (It’s free) >>>
Margin Expansion Requires Explanation
Earnings can grow faster than revenue when margins expand, but not all margin expansion is sustainable. Understanding what drives margin improvement helps distinguish genuine operational gains from accounting-driven or temporary factors.
Legitimate margin expansion comes from pricing power, operating leverage, mix shifts toward higher-margin products, or genuine cost reduction. A software company scaling its customer base without proportionally increasing costs will see operating leverage expand margins naturally. A consumer goods company that successfully premiumizes its product line will see gross margins improve as the mix shifts. These gains tend to persist because they reflect structural changes in the business.
Questionable margin expansion comes from cutting necessary investments, capitalizing expenses, or one-time benefits that will not repeat. A company can boost short-term margins by reducing R&D, deferring maintenance, or cutting advertising. These savings flow directly to earnings but often damage long-term competitiveness. The margin expansion is real in accounting terms but illusory in economic terms because it borrows from the future.
Compare margin trends to reinvestment levels. If margins are expanding while R&D as a percentage of revenue is declining, the company may be harvesting rather than building. If capital expenditures have fallen well below depreciation for several years, the company may be underinvesting in its asset base. Sustainable margin expansion should coexist with appropriate reinvestment, not come at its expense.
Examine whether margin expansion matches the competitive environment. If an entire industry is seeing margin compression due to competition or cost pressures, one company showing expansion deserves scrutiny. Either it has genuine advantages that its peers lack, or its accounting is more aggressive than its competitors’.
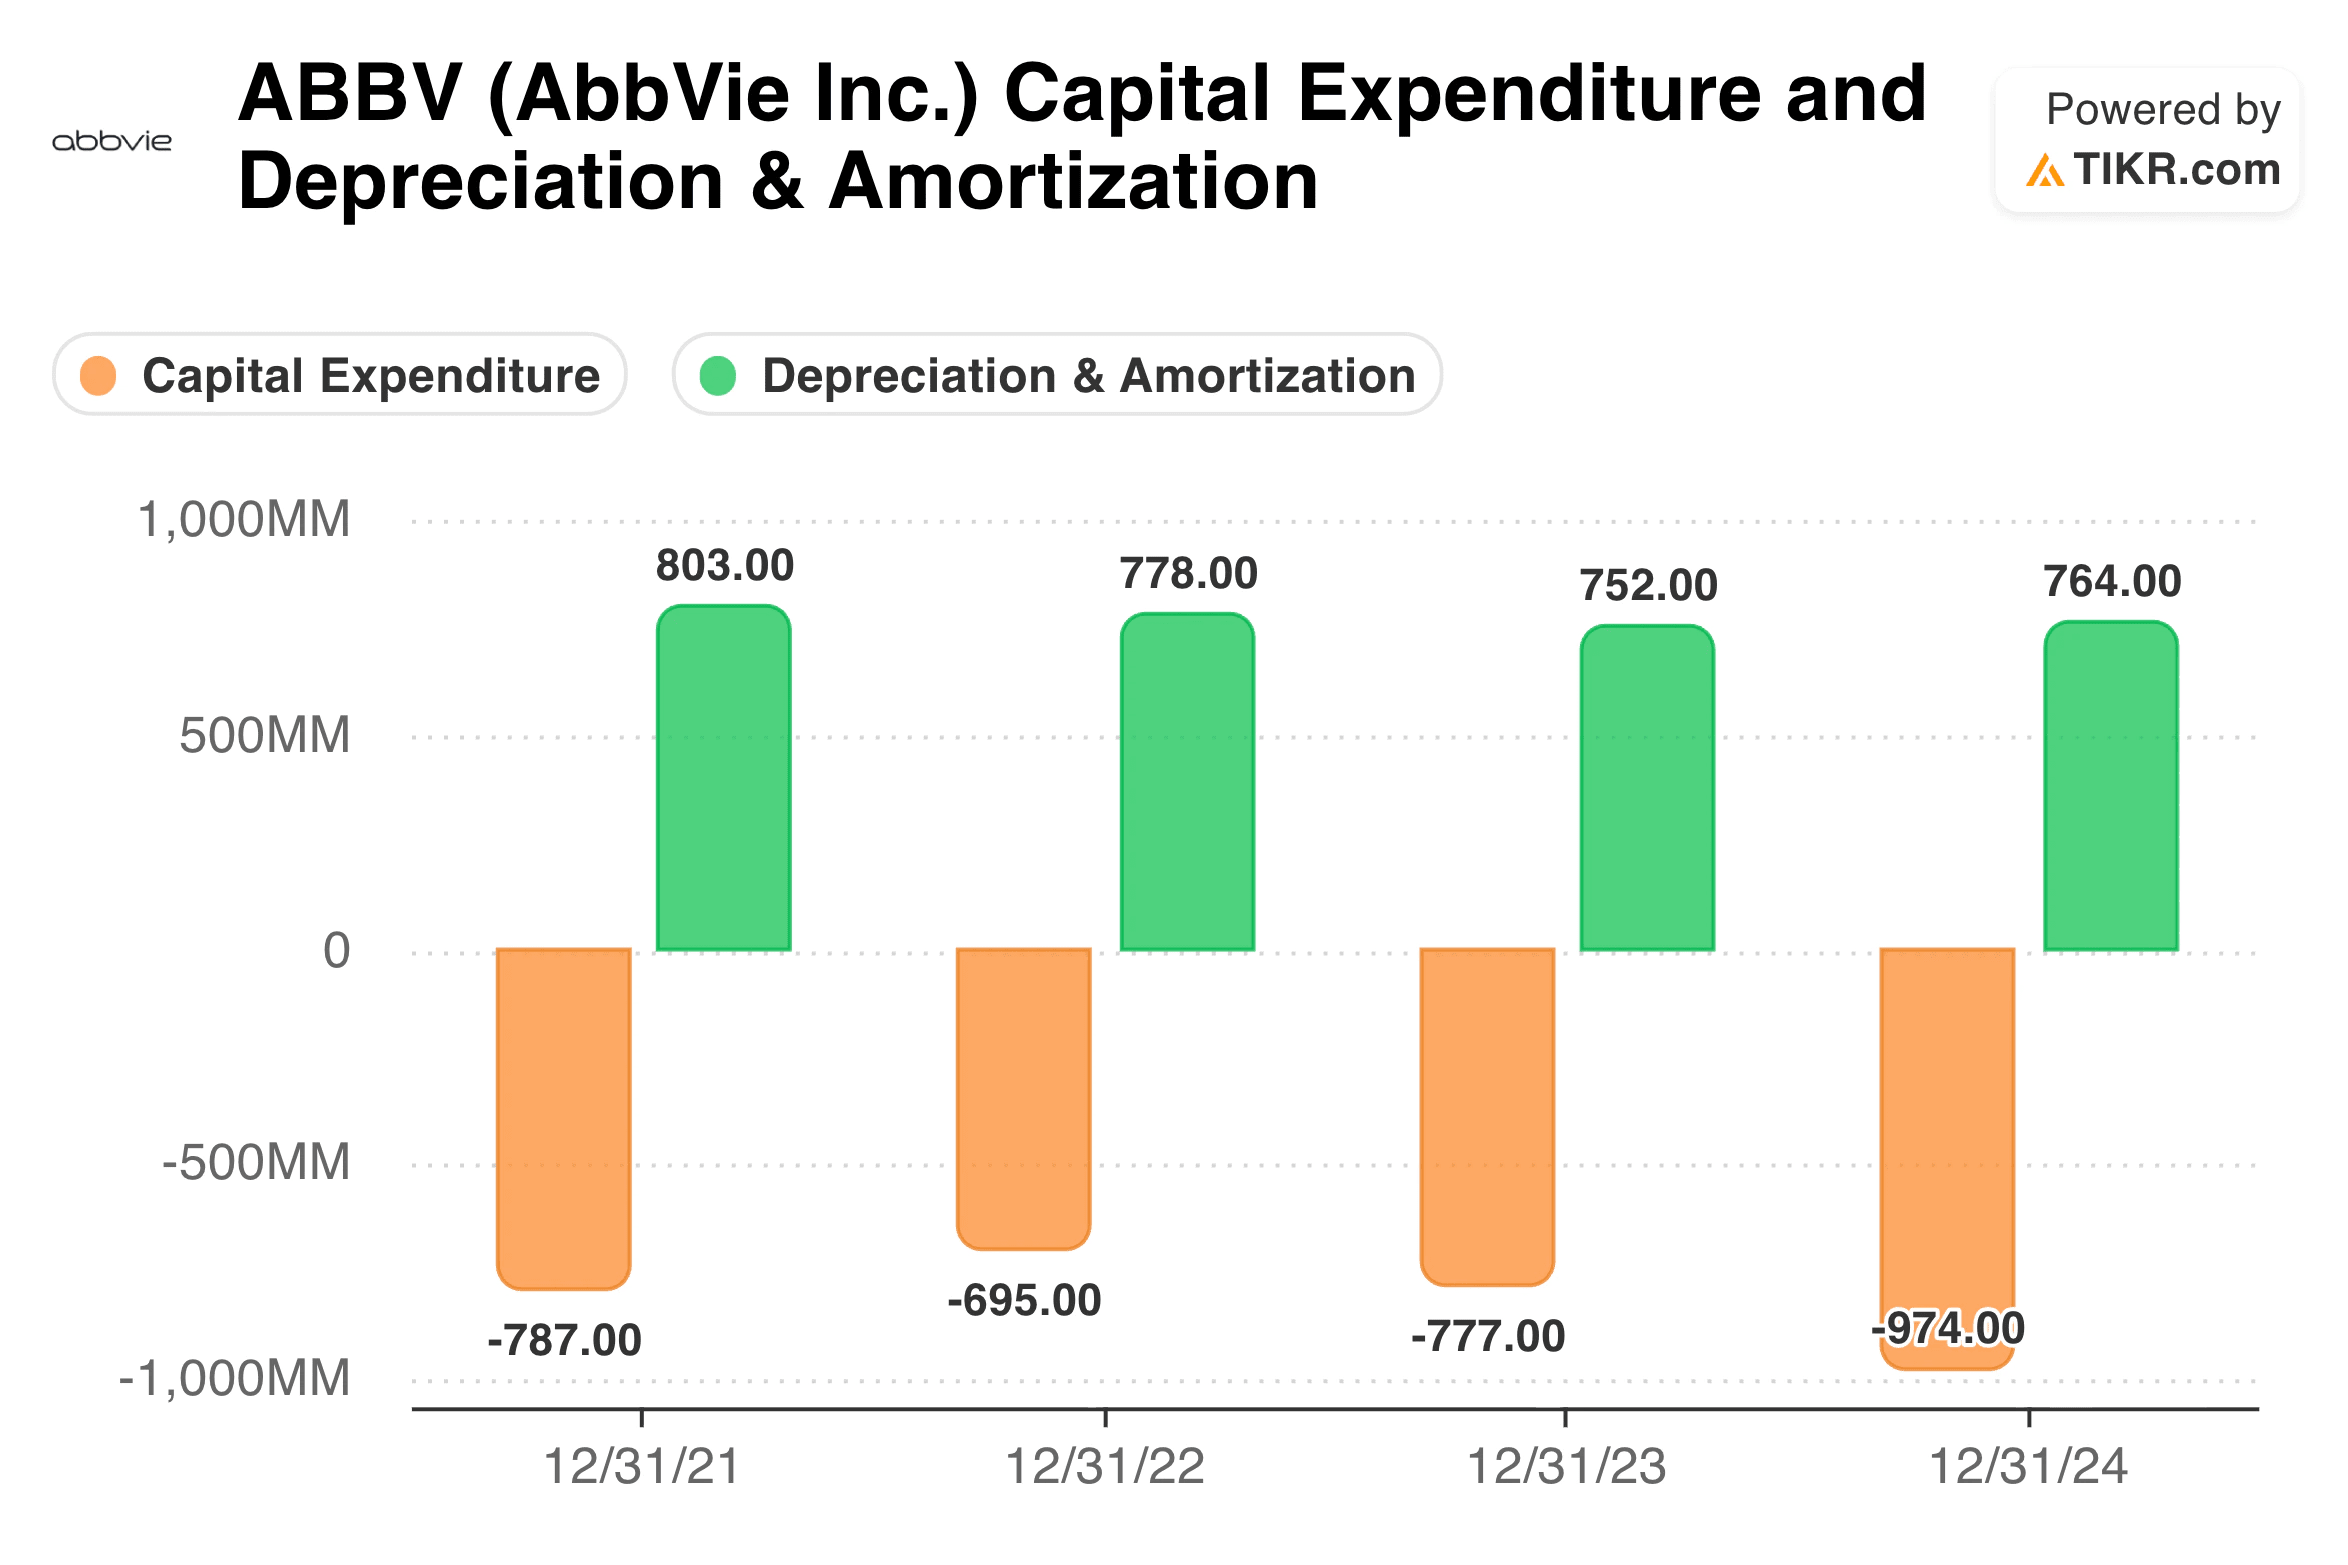
TIKR tip: Review R&D expense, capital expenditures, and depreciation trends in TIKR’s Detailed Financials alongside margin trends. Margin expansion accompanied by declining reinvestment ratios may indicate unsustainable earnings improvement.
Build your own screener to find stocks with solid earnings revenue to buy today (Free with TIKR) >>>
Acquisitions Can Mask Underlying Performance
Companies that grow through acquisition present particular challenges for earnings quality assessment. Purchase accounting offers numerous opportunities to manage reported results, and the complexity of integrating multiple businesses can obscure what is actually happening in the core operations.
Acquisition accounting allows companies to write down acquired assets, create reserves for integration costs, and adjust the timing of expenses recognized in the income statement. These choices affect reported earnings for years after a deal closes. A serial acquirer can maintain a steady stream of accounting benefits that inflate earnings growth beyond what the underlying businesses actually generate.
Separate organic growth from acquired growth when evaluating earnings trends. If a company has grown earnings 12% annually, but half of that came from acquisitions, the core business is growing at 6%. That is a very different picture than the headline number suggests. Many acquisitive companies do not make this breakdown easy, which is itself a warning sign about transparency.
Examine whether acquisitions are actually creating value. Compare the return on capital before and after a series of deals. If ROC has declined as the company has grown through acquisition, the deals are diluting business quality even if they are adding to reported earnings. A company paying high prices for low-return businesses can grow earnings in the short term while destroying long-term value.
Watch for goodwill as a percentage of total assets or equity. When goodwill represents a large portion of the balance sheet, the company has paid significant premiums for acquired businesses. If those businesses underperform expectations, impairment charges will eventually hit earnings. High goodwill indicates that historical earnings growth may have come at a price that future results will have to justify.

TIKR tip: Track goodwill and intangible assets in TIKR’s Balance Sheet over time. A steadily growing goodwill balance indicates acquisition-driven growth that may not reflect organic business improvement.
One-Time Items and Adjusted Earnings
The gap between GAAP earnings and the adjusted figures companies report has widened dramatically in recent years. Management routinely excludes stock compensation, amortization, restructuring charges, and various other items to present results in a more favorable light. Some adjustments are reasonable. Others are attempts to make mediocre performance look acceptable.
Compare GAAP earnings to adjusted earnings over time. If the gap is consistent and modest, the adjustments may reflect legitimate differences between accounting and economic reality. If the gap is large and growing, the company is asking investors to ignore an increasing portion of its costs. A business where adjusted earnings are routinely 50% higher than GAAP earnings is telling you that half its expenses do not count, which should prompt skepticism.
Restructuring charges deserve particular scrutiny. A company that takes restructuring charges every few years may be using them as an earnings management tool rather than reflecting genuine operational changes. The charges get excluded from adjusted earnings, making those years look better. If prior restructuring reserves are later released into income, the pattern becomes even clearer. Repeated restructuring is not a sign of a well-managed business.
Stock-based compensation is a real expense that dilutes shareholders. Excluding it from adjusted earnings makes sense for some analytical purposes but not for assessing total shareholder returns. A company with modest GAAP earnings but generous stock compensation is transferring value from shareholders to employees. The adjusted earnings figure may increase impressively, while the per-share value increases slowly or not at all.
Watch for shifting definitions of adjusted earnings. If a company changes what it excludes from year to year, or if new exclusions appear when results are weak, management may be manipulating the metric to hit targets. Consistent definitions applied over time are more reliable than metrics that adjust to make each period appear acceptable.

TIKR tip: TIKR’s Income Statement presents GAAP figures you can compare with adjusted numbers in earnings releases. Track the gap over time. A widening divergence between reported and adjusted results is a warning sign about earnings quality.
Screen earnings growth for over 75,000 global stocks with TIKR (It’s free) >>>
Red Flags That Demand Investigation
Certain patterns should trigger immediate skepticism about earnings quality, even if you cannot pinpoint exactly what is wrong. These red flags indicate an elevated risk that reported results do not reflect economic reality.
Earnings that consistently beat estimates by small amounts suggest management is managing to targets rather than reporting results. The probability of beating by one or two cents every quarter for years is extremely low if results are genuinely uncertain. This pattern indicates earnings are being smoothed through reserves, timing choices, or other discretionary items.
Fourth-quarter adjustments that differ markedly from the rest of the year can indicate year-end cleanup of aggressive positions taken in earlier quarters. Companies have more discretion in annual audits than quarterly reviews. If Q4 consistently looks different from the pattern established in Q1 through Q3, the earlier quarters may have been reported aggressively.
Auditor changes or qualifications are serious warning signs. If a company switches auditors unexpectedly, ask why. Auditor resignations are particularly concerning because they suggest disagreements over accounting treatment. Any qualified audit opinion or mention of material weaknesses in internal controls warrants investigation before relying on reported earnings.
Heavy insider selling during periods of strong reported earnings growth raises questions. Executives who understand the business best are cashing out despite apparently excellent results. They might simply be diversifying, but they may also recognize that current earnings quality is lower than the reported numbers suggest.

TIKR tip: Use TIKR’s Ownership tab to monitor insider transactions. Compare selling patterns to reported earnings trends. Heavy insider selling during periods of strong earnings growth warrants additional scrutiny.
Run a competitor analysis on TIKR for the top stocks in your portfolio (It’s free) >>>
The TIKR Takeaway
Distinguishing real earnings growth from manufactured growth is one of the most important skills an investor can develop. Companies with genuine earnings improvement make excellent long-term investments because their growth compounds into real value. Companies with artificial earnings growth eventually disappoint when the accounting catches up to reality.
The evidence is in the financial statements. Cash flow that tracks earnings confirms profits are real. Revenue quality and receivables trends reveal whether sales are sustainable. Margin expansion accompanied by appropriate reinvestment indicates genuine improvement. Modest gaps between GAAP and adjusted earnings suggest conservative accounting. The absence of red flags such as constant restructuring, shifting adjustments, and auditor issues provides confidence in the reported results.
TIKR provides the data to conduct this analysis systematically. The Detailed Financials display cash flow alongside earnings over extended periods. The Balance Sheet shows receivables, goodwill, and capitalized costs, which can indicate aggressive accounting. Earnings transcripts offer management commentary that either supports or contradicts the quantitative picture. Together, these tools help you identify companies with real earnings growth and avoid those with none.
Find undervalued stocks in less than 60 seconds with TIKR’s new Valuation Model (It’s free) >>>
Value Any Stock in Under 60 Seconds with TIKR
With TIKR’s new Valuation Model tool, you can estimate a stock’s potential share price in under a minute.
All it takes is three simple inputs:
- Revenue Growth
- Operating Margins
- Exit P/E Multiple
If you’re not sure what to enter, TIKR automatically fills in each input using analysts’ consensus estimates, giving you a quick, reliable starting point.
From there, TIKR calculates the potential share price and total returns under Bull, Base, and Bear scenarios so you can quickly see whether a stock looks undervalued or overvalued.
See a stock’s true value in under 60 seconds (Free with TIKR) >>>
Looking for New Opportunities?
- Discover which stocks billionaire investors are purchasing, so you can follow the smart money.
- Analyze stocks in as little as 5 minutes with TIKR’s all-in-one, easy-to-use platform.
- The more rocks you overturn… the more opportunities you’ll uncover. Search 100K+ global stocks, global top investor holdings, and more with TIKR.
Disclaimer:
Please note that the articles on TIKR are not intended to serve as investment or financial advice from TIKR or our content team, nor are they recommendations to buy or sell any stocks. We create our content based on TIKR Terminal’s investment data and analysts’ estimates. Our analysis might not include recent company news or important updates. TIKR has no position in any stocks mentioned. Thank you for reading, and happy investing!