
Key Takeaways:
- Regulated Growth Momentum: Xcel Energy stock reflects execution focus after announcing a February earnings call and advancing regulated infrastructure investments across 8 U.S. states.
- Rate Case Catalyst: Xcel Energy stock positions for earnings visibility as its Colorado utility seeks a $190 million natural gas rate increase to support capital recovery.
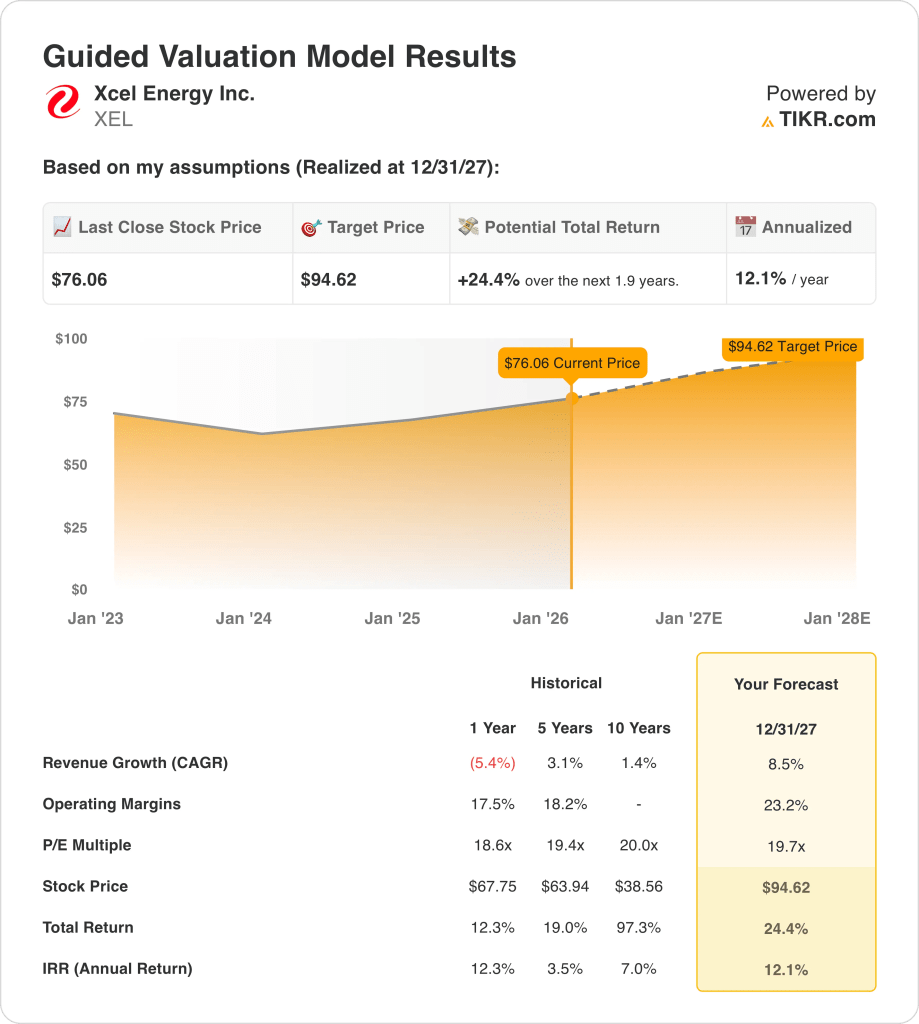
- Price Projection: Based on 9% revenue growth, 23% operating margins, and a 20x exit multiple, Xcel Energy stock could reach $95 by 2027.
- Upside Math: That target implies 24% total upside from the current $76 price, translating into roughly 12% annualized returns.
Xcel Energy (XEL) generates and delivers regulated electricity and natural gas across Colorado, Michigan, Minnesota, New Mexico, North Dakota, South Dakota, Texas, and Wisconsin, positioning it as a leading U.S. utility with scale.
Last week in January, Xcel Energy confirmed a February earnings call as regulators review a $190 million Colorado gas rate request.
Xcel Energy generated about $14 billion in trailing revenue, reflecting stable demand and predictable pricing under regulated utility frameworks.
XEL stock produced roughly $3 billion in operating income with 19% margins, supported by rate-based returns and cost recovery mechanisms.
With a market capitalization near $42 billion, Xcel Energy trades at about 20x earnings, creating tension between steady fundamentals and restrained valuation assumptions.
What the Model Says for XEL Stock
We assessed Xcel Energy stock using regulated utility scale, stable cash flows, and capital returns supporting predictable earnings through 2027.
Based on 8.5% revenue growth, 23.2% operating margins, and a 19.7x exit multiple, the model estimates a $94.62 target.
That implies a 24.4% total return, or a 12.1% annualized return over 1.9 years to $95.
Our Valuation Assumptions
TIKR’s Valuation Model lets you plug in your own assumptions for a company’s revenue growth, operating margins, and P/E multiple, and calculates the stock’s expected returns.
Here’s what we used for XEL stock:
1. Revenue Growth: 8.5%
Xcel Energy generated about $14 billion in LTM revenue, with historical growth averaging 3% across regulated electric and gas operations.
Recent revenue pressure reflects weather normalization and fuel cost pass-throughs, not customer losses or market share erosion across Xcel Energy’s regulated territories.
Meanwhile, its forward growth is supported by rate base expansion, renewable investment, and population growth across Colorado, Texas, and Minnesota.
Consensus estimates assume 8.5% revenue growth from rate-driven expansion and capital deployment, supporting roughly 12% annualized returns.
2. Operating Margins: 23.2%
XEL stock margins averaged 18% historically, supported by regulated returns, fuel pass-throughs, and stable electric and gas cost structures.
Its margins dipped recently as depreciation and maintenance costs rose alongside grid investment and renewable buildout across multiple regulated jurisdictions.
Margin normalization assumes improved rate recovery, steadier operating expenses, and lower volatility from fuel and purchased power costs.
Consensus projections point to 23.2% operating margins, reflecting normalized regulatory returns and disciplined cost recovery across Xcel Energy’s asset base.
3. Exit P/E Multiple: 19.7x
Xcel Energy’s results hinge on regulated rate approvals, capital recovery timing, and disciplined cost control through 2029.
Current valuation reflects cautious sentiment toward utilities amid higher rates, despite improving earnings visibility and constructive regulatory outcomes.
The multiple assumes continued regulatory support, steady capital returns, and no deterioration in allowed returns across core jurisdictions.
Based on street consensus estimates, a 19.7x exit multiple balances defensive earnings stability with measured expectations for regulated utility growth.
What Happens If Things Go Better or Worse?
Xcel Energy’s outcomes depend on regulated rate approvals, capital investment recovery, and cost control discipline, setting up a range of possible paths through 2029.
- Low Case: Slower rate cases and tighter cost recovery limit revenue to 6.8% with 17.9% margins → 5.8% annualized return.
- Mid Case: With regulated investments executing normally, revenue growth near 7.5% and margins holding around 17.7% → 9.9% annualized return.
- High Case: Faster rate approvals and efficiency gains lift revenue to 8.3% and margins to 17.4% → 13.6% annualized return.
The $110 mid-case target is supported by steady execution and rate recovery, without multiple expansion or sentiment shifts.

How Much Upside Does It Have From Here?
With TIKR’s new Valuation Model tool, you can estimate a stock’s potential share price in under a minute.
All it takes is three simple inputs:
- Revenue Growth
- Operating Margins
- Exit P/E multiple
If you’re not sure what to enter, TIKR automatically fills in each input using analysts’ consensus estimates, giving you a quick, reliable starting point.
From there, TIKR calculates the potential share price and total returns under Bull, Base, and Bear scenarios so you can quickly see whether a stock looks undervalued or overvalued.
Looking for New Opportunities?
- See what stocks billionaire investors are buying so you can follow the smart money.
- Analyze stocks in as little as 5 minutes with TIKR’s all-in-one, easy-to-use platform.
- The more rocks you overturn… the more opportunities you’ll uncover. Search 100K+ global stocks, global top investor holdings, and more with TIKR.
Disclaimer:
Please note that the articles on TIKR are not intended to serve as investment or financial advice from TIKR or our content team, nor are they recommendations to buy or sell any stocks. We create our content based on TIKR Terminal’s investment data and analysts’ estimates. Our analysis might not include recent company news or important updates. TIKR has no position in any stocks mentioned. Thank you for reading, and happy investing!