Key Takeaways:
- The Dividend Shield: Management celebrated a massive milestone, marking 50 consecutive years of dividend increases, cementing ADM’s status as a Dividend King even in a “difficult and dynamic” environment.
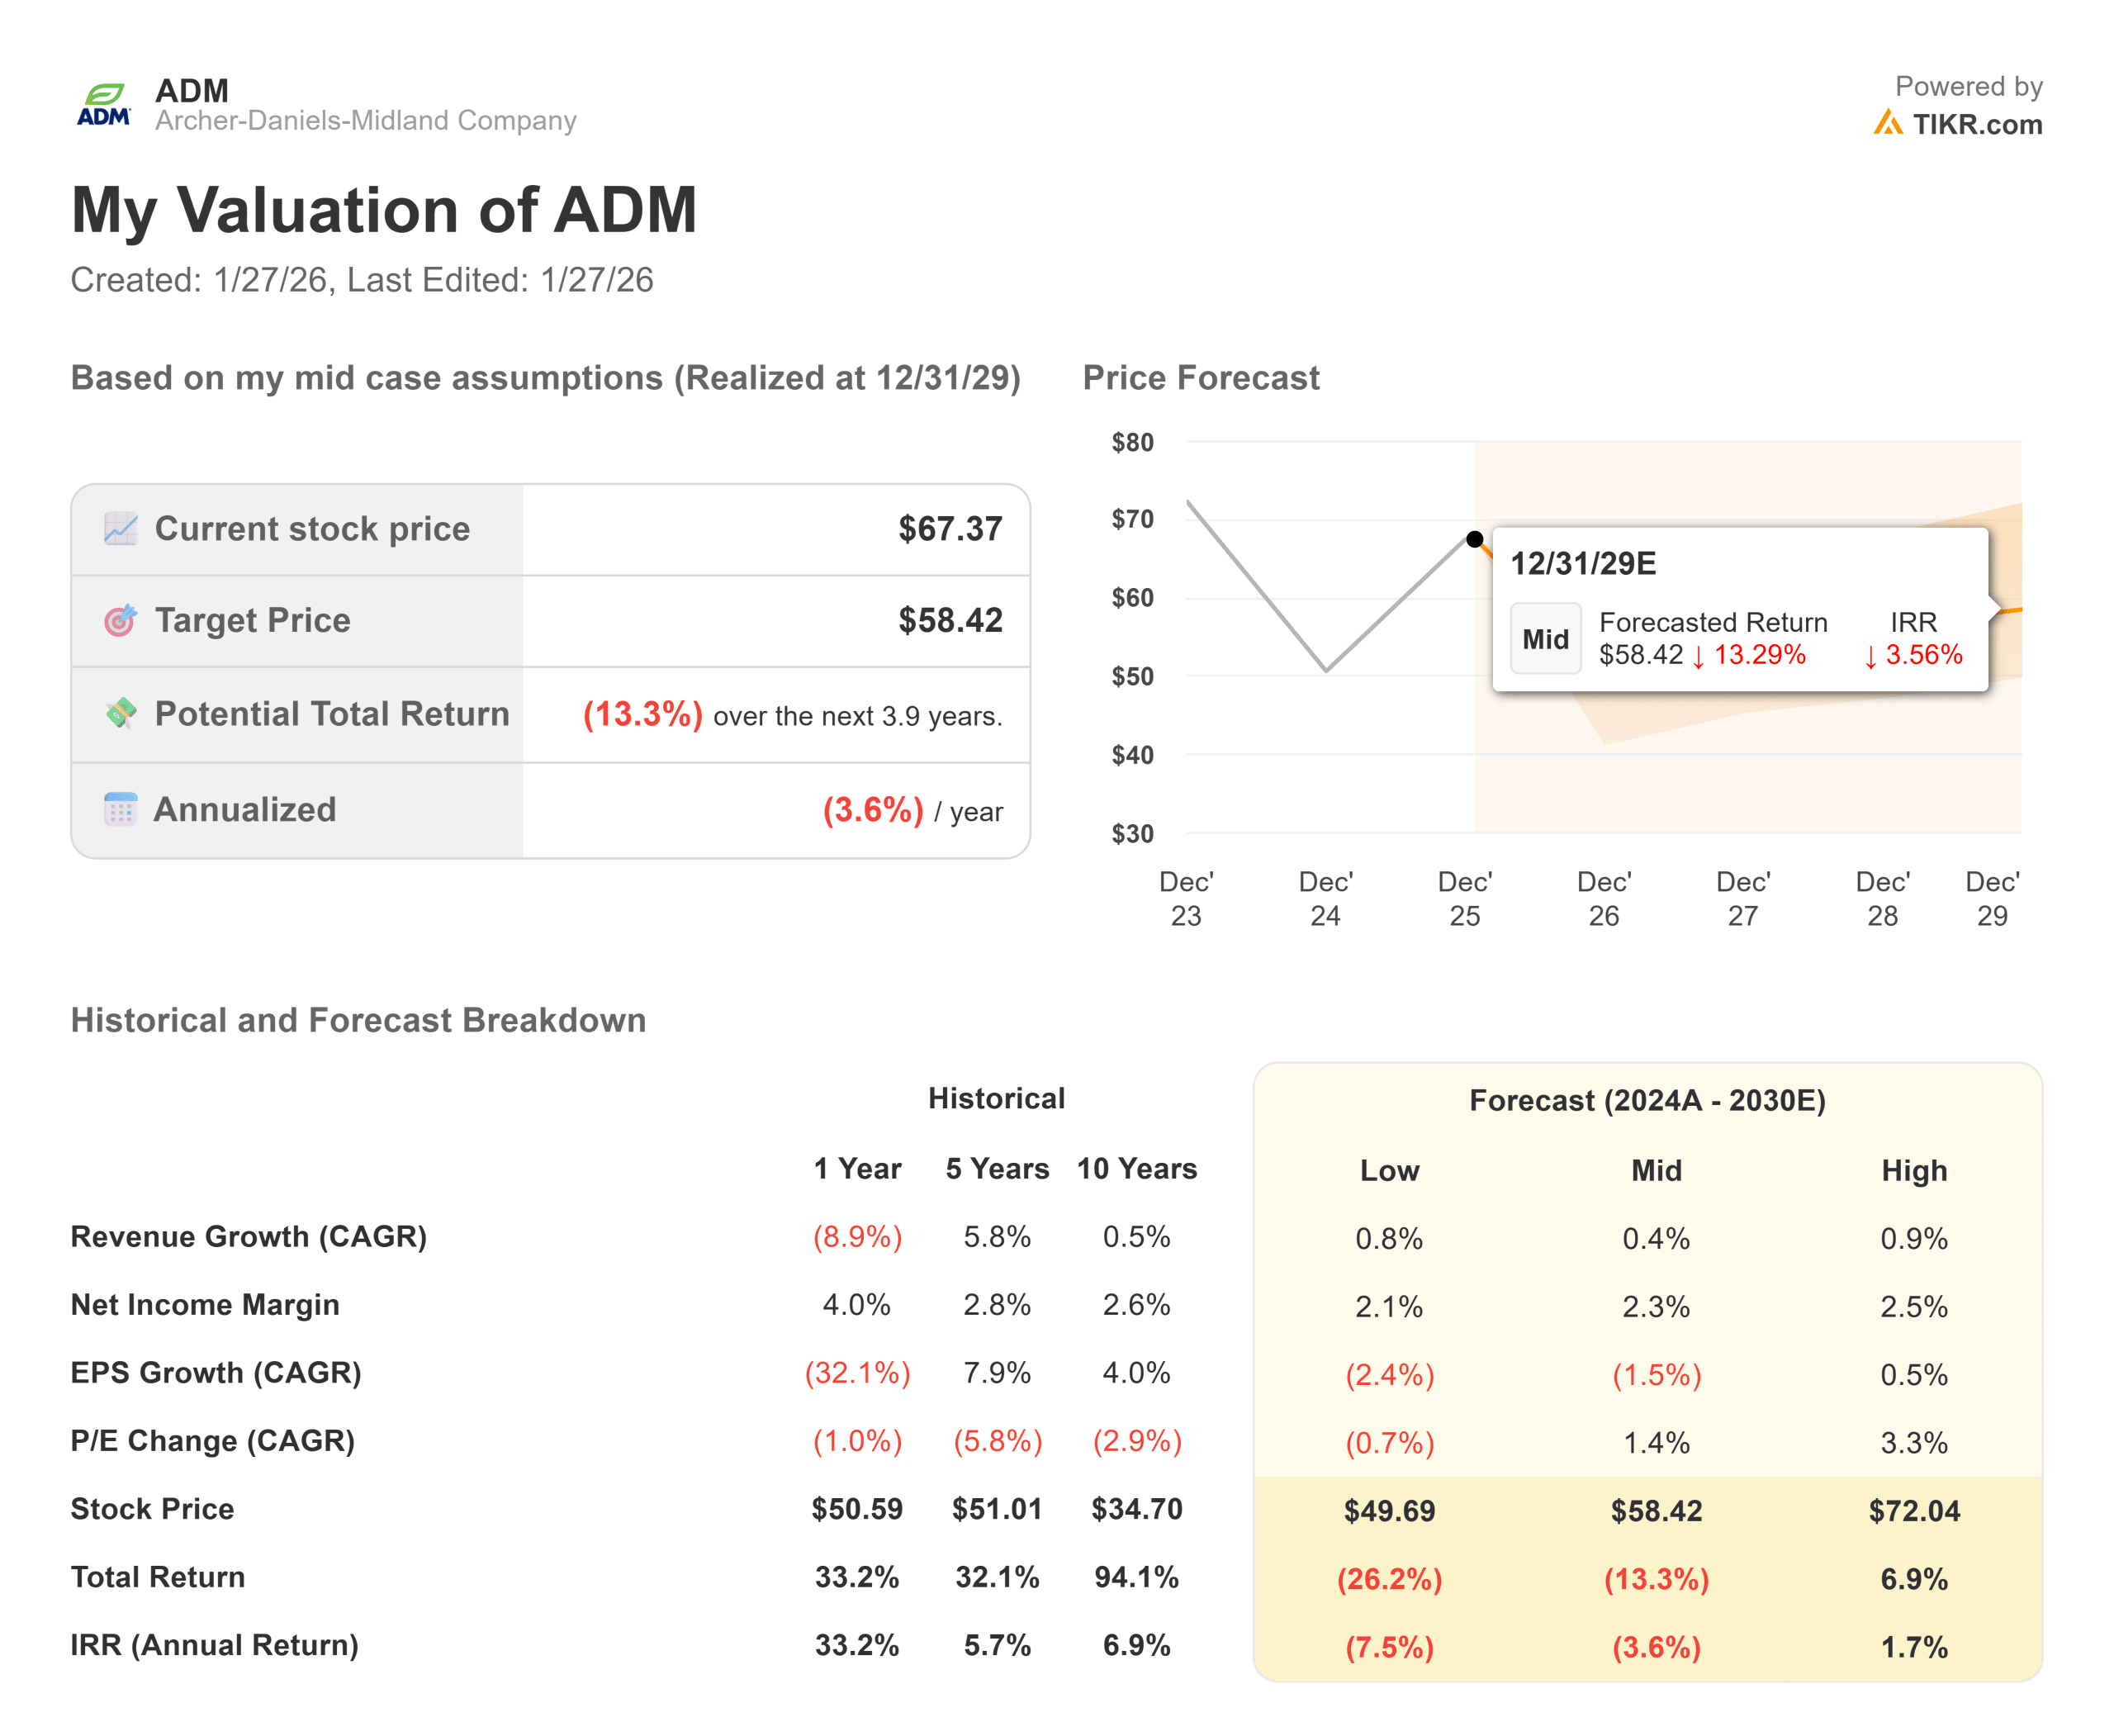
- Valuation Warning: Despite the yield, the valuation model flashes red, pointing to a target of $53 by 2027, suggesting significant downside risk from today’s price.
- Negative Returns: With an implied annualized return of -11.8%, the model signals that the stock is currently overvalued relative to its slowing growth profile.
- Margin Compression: The model assumes Operating Margins will settle at 2.2%, reflecting the continued pressure on crush spreads and commodity deflation.
Archer-Daniels-Midland (ADM) is a titan of global food security, but it is currently navigating a minefield of policy uncertainty and margin compression.
CEO Juan Luciano described the current environment as “very difficult,” citing a lack of clarity on biofuel policies (RVOs) that has weighed on the crushing business.
Despite these headwinds, the company is pulling the “self-help” levers.
Management focused heavily on portfolio optimization and efficiency to navigate the cycle, expressing optimism that “policy will give us clarity” in 2026.
However, the fundamentals tell a cautious story.
While the dividend is safe, the growth engine has stalled. The market is waiting for a turn in the commodity cycle that hasn’t arrived yet.
With the stock trading at $67, investors are paying for a recovery that is not yet visible in the numbers. Is the dividend enough protection, or is there more downside ahead?
What the Model Says for ADM Stock
This analysis evaluates ADM’s potential through 2027, factoring in the slow-growth commodity environment and thin margins.

The model signals “Sell / Value Trap.”
Using a forecast of 0.4% Revenue Growth (CAGR) and 2.2% Operating Margins, the model points to a target price of $53 by December 2027.
This implies a painful annualized return of -11.8% from today’s levels.
The model suggests that even with the dividend, capital depreciation will likely drag the total return deep into negative territory over the next two years.
Wall Street shares this bearish sentiment.
The average “Street Target” is roughly $58, which aligns with the model’s cautious view and implies downside from the current price.
Estimate a company’s fair value instantly (Free with TIKR) >>>
Our Valuation Assumptions
TIKR’s Valuation Model lets you plug in your own assumptions for a company’s revenue growth, operating margins, and P/E multiple, and calculates the stock’s expected returns.
Here’s what we used for ADM stock:
1. Revenue Growth: 0.4%
Growth has stalled.
While the “Nutrition” and “Flavors” segments offer some diversification, the core Ag Services business is fighting against cyclical lows.
The model forecasts a stagnant 0.4% CAGR through 2027, reflecting the difficulty of growing a massive topline in a deflationary crop environment.
2. Operating Margins: 2.2%
Efficiency is key, but margins remain tight.
The model assumes Operating Margins will average 2.2%, reflecting the continued pressure on crush spreads. This is a critical input; if ADM cannot expand margins beyond this thin level, the valuation support is weak.
3. Exit P/E Multiple: 11.7x
ADM currently trades at a premium relative to its earnings potential.
The model assumes the multiple compresses to 11.7x by 2027.
This multiple contraction acts as a major headwind. If the market stops treating ADM as a growth story and prices it strictly as a low-margin commodity trader, the stock price has further to fall.
What Happens If Things Go Better or Worse?
The Guided Model presents a sober “Base Case,” highlighting the risks of investing in a cyclical peak (these are estimates, not guaranteed returns):
- Low Case: If biofuel policies disappoint and margins compress further, the stock could test lows near $45, offering significant negative returns.
- Mid Case: Even with steady execution, the target is $53, delivering a -11.8% annual return.
- High Case: For the stock to work, ADM needs a massive rebound in commodity prices to drive margins above 3%. Without that, the upside is capped by the valuation ceiling.
See what analysts forecast for the next 5 years for DM stock (Free with TIKR) >>>
How Much Upside Does ADM Stock Have From Here?
With TIKR’s new Valuation Model tool, you can estimate a stock’s potential share price in under a minute.
All it takes is three simple inputs:
- Revenue Growth
- Operating Margins
- Exit P/E Multiple
If you’re not sure what to enter, TIKR automatically fills in each input using analysts’ consensus estimates, giving you a quick, reliable starting point.
From there, TIKR calculates the potential share price and total returns under Bull, Base, and Bear scenarios so you can quickly see whether a stock looks undervalued or overvalued.
See a stock’s true value in under 60 seconds (Free with TIKR) >>>
Looking for New Opportunities?
- See what stocks billionaire investors are buying so you can follow the smart money.
- Analyze stocks in as little as 5 minutes with TIKR’s all-in-one, easy-to-use platform.
- The more rocks you overturn… the more opportunities you’ll uncover. Search 100K+ global stocks, global top investor holdings, and more with TIKR.
Disclaimer:
Please note that the articles on TIKR are not intended to serve as investment or financial advice from TIKR or our content team, nor are they recommendations to buy or sell any stocks. We create our content based on TIKR Terminal’s investment data and analysts’ estimates. Our analysis might not include recent company news or important updates. TIKR has no position in any stocks mentioned. Thank you for reading, and happy investing!