Key Takeaways:
- Brand Visibility Shift: Fastenal re-centered its RFK Racing partnership around the Body Guard safety brand on February 9, 2026, aiming to expand awareness in a $8 billion industrial distribution platform.
- Leadership Transition: Fastenal confirmed Daniel Florness steps down in 2026 with Jeff Watts taking over as CEO in July 2026, setting a clear timeline for continuity after a 9% sales recovery in 2025.
- Price Projection: Fastenal Company stock could reach $58 by 2028 based on an 8% revenue CAGR, a 21% operating margin, and a 36x P/E multiple that aligns with a premium, high-consistency distributor profile.
- Potential Gains: Fastenal Company’s $58 target implies 24% total upside from the $47 current price, translating to about 8% annualized returns over roughly 3 years based on valuation math.
Breaking Down the Case for Fastenal Co.
Fastenal Company (FAST) shifted its 2026 visibility strategy on February 9, 2026 by making the Body Guard safety brand the primary focus of its RFK Racing partnership while preparing for a CEO change scheduled for July 2026.
Last year, Fastenal’s revenue reached $8 billion with $4 billion of gross profit, $2 billion of operating expenses, and $2 billion of operating income, supporting a roughly 20% operating margin despite a mixed industrial backdrop.
Fourth-quarter sales totaled $2 billion with daily sales up 11% and net income at $294 million, while gross margin fell 50 basis points and SG&A improved to 25% of sales from 26% year over year.
Key-account execution drove the mix shift in 2025 as contract customers increased by 241, $50,000-plus sites rose 14%, and $10,000-plus sites reached about 11,700, even as under-$5,000 sites declined.
Technology integration remained central in 2025 as the firm signed about 26,000 FMI devices to lift the installed base to roughly 137,000 units, pushing 46% of quarterly sales through FMI and 62% through the broader digital footprint.
Capital intensity stayed controlled with $230 million of 2025 net capex and over $1 billion of dividends, while 2026 investment plans step up toward about 4% of sales to expand hub capacity, FMI hardware, and IT throughput.
Last month in an earnings call, management articulated a vision of scaling toward a $15 billion organization, while the $58 valuation scenario for 2028 assumes the market sustains a 36x multiple relative to the current $47 share price.
What the Model Says for FAST Stock
Fastenal stock pairs 8.7% recent revenue growth with 20% operating margins and disciplined 3% capital spending, reinforcing premium market assumptions despite mixed industrial conditions and leadership transition into July 2026.
The market assumption embeds 8.0% revenue growth, 20.8% operating margins, and a 36.1x exit multiple, producing a $58.07 target price by 2028 from $47.02 today.
That outcome implies 23.5% total upside and a 7.6% annualized return over 2.9 years, below a typical 10% equity hurdle rate for cyclical distributors.
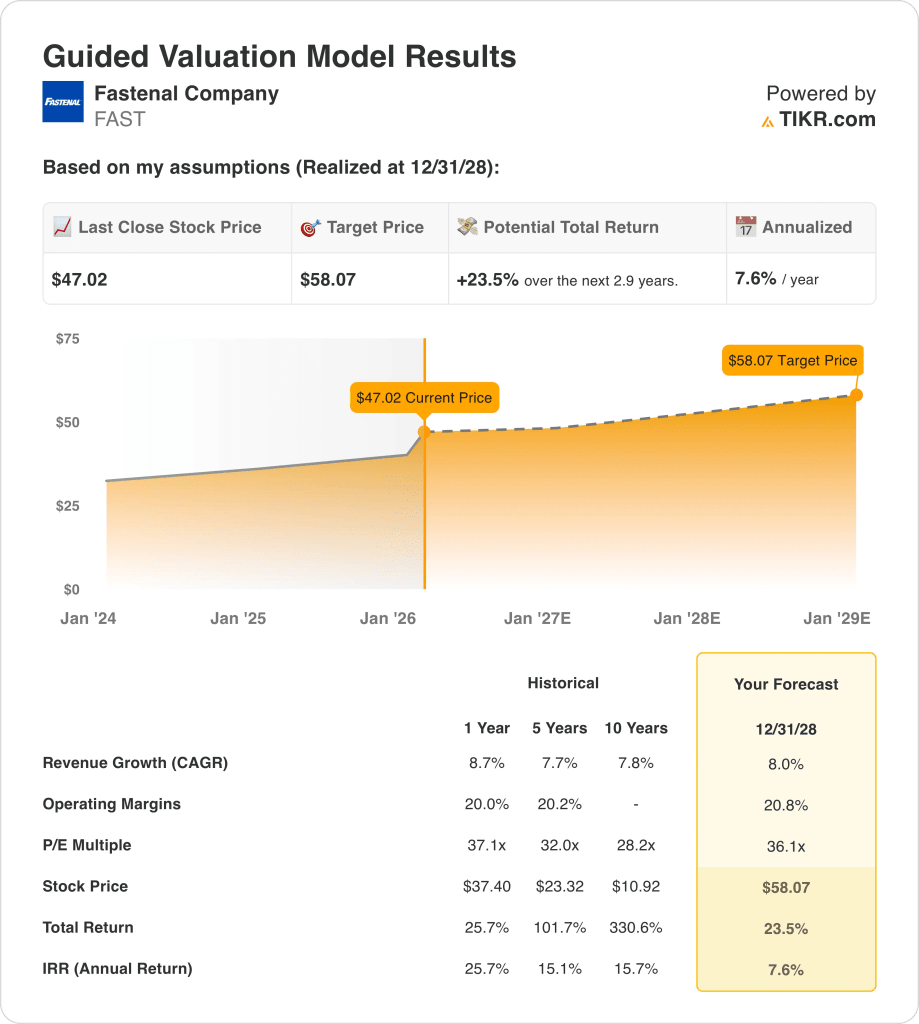
Therefore, the model signals a Sell, as a 7.6% annualized return at 36.1x earnings does not compensate for industrial cyclicality or execution risk.
A 7.6% annualized return falls below a 10% equity hurdle rate, offering limited capital appreciation at a 36.1x multiple and insufficient compensation for macro volatility, pricing execution risk, and leadership transition into July 2026.
Our Valuation Assumptions
TIKR’s Valuation Model lets you plug in your own assumptions for a company’s revenue growth, operating margins, and P/E multiple, and calculates the stock’s expected returns.
Here’s what we used for Fastenal stock:
1. Revenue Growth: 8%
Fastenal stock delivered 8.7% revenue growth in 2025 after 2.7% in 2024 and 5.2% in 2023, placing the business back near its 7.7% five-year CAGR and demonstrating resilience across mixed industrial cycles.
Growth in 2025 was supported by 241 net contract customer additions, 14% growth in $50,000-plus sites, and double-digit Q4 daily sales growth of 11%, while digital channels reached 62.1% of sales.
Sustaining 8% revenue growth requires continued key account penetration and stable industrial demand, while weaker PMI readings in the high 40s or pricing pushback could quickly pressure volume expansion.
This is slightly below the 1-year revenue growth of 8.7%, as pricing normalization and large-account mix shift moderate acceleration, and revenue sensitivity compounds quickly if industrial production stalls.
2. Operating Margins: 20.8%
Fastenal stock’s operating margins averaged 20.2% in 2025 and ranged between 20.0% and 20.8% over the past four years, which shows that Fastenal maintained cost discipline across different revenue cycles.
SG&A was 25.4% of sales in Q4 and operating income reached $1.66 billion on $8.20 billion of revenue, and fastener sourcing initiatives plus incentive compensation reset supported margin stability.
The 20.8% margin assumption requires sustained volume leverage and firm pricing execution, while supplier rebate volatility and non-fastener mix pressure can reduce incremental operating income.
This is modestly above the 1-year operating margin of 20.2%, as the model assumes incremental scale leverage, and any shortfall reduces earnings faster than revenue because fixed costs remain.
3. Exit P/E Multiple: 36.1x
The 36.1× exit multiple capitalizes normalized earnings that align with 8.0% revenue growth and 20.8% operating margins, and it places valuation near the upper range of established industrial distributors.
The Market assumption for NTM Price / Normalized Earnings is 38.52× as of 2/11/26, and the model selects a lower 36.1× multiple to avoid reliance on further valuation expansion.
The multiple assumes stable earnings durability with 62.1% digital sales penetration and large customer retention, while slower key account growth or pricing resets would compress the multiple.
This is below the current market 38.52× and near the 1-year P/E of 37.1×, as the model assumes valuation normalization and limits reliance on multiple expansion for returns.
What Happens If Things Go Better or Worse?
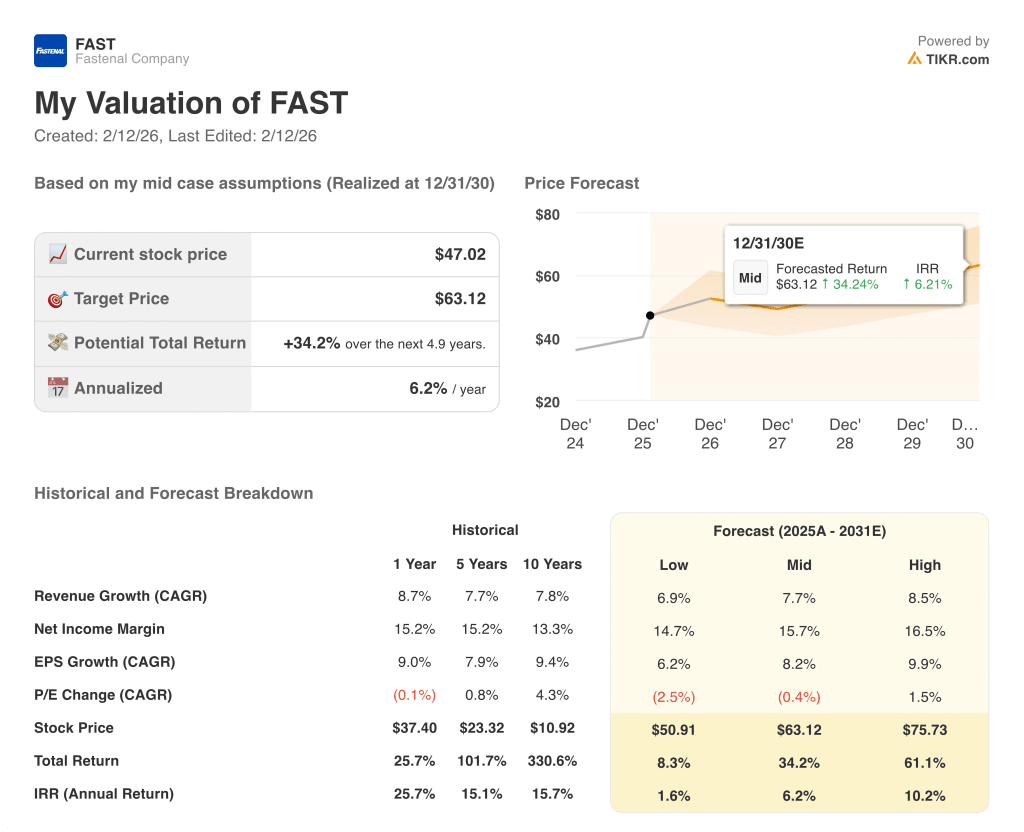
Fastenal stock results hinge on industrial demand stability, key account penetration, digital adoption, and cost discipline through 2030.
- Low Case: If industrial demand softens and pricing power weakens, revenue grows 6.9% and net margin holds near 14.7% → 1.6% annualized return.
- Mid Case: With steady key account expansion and disciplined cost control, revenue grows 7.7% and net margin reaches 15.7% → 6.2% annualized return.
- High Case: If large-customer wins accelerate and digital mix scales efficiently, revenue grows 8.5% and net margin approaches 16.5% → 10.2% annualized return.
How Much Upside Does Fastenal Stock Have From Here?
With TIKR’s new Valuation Model tool, you can estimate a stock’s potential share price in under a minute.
All it takes is three simple inputs:
- Revenue Growth
- Operating Margins
- Exit P/E multiple
If you’re not sure what to enter, TIKR automatically fills in each input using analysts’ consensus estimates, giving you a quick, reliable starting point.
From there, TIKR calculates the potential share price and total returns under Bull, Base, and Bear scenarios so you can quickly see whether a stock looks undervalued or overvalued.
Looking for New Opportunities?
- See what stocks billionaire investors are buying so you can follow the smart money.
- Analyze stocks in as little as 5 minutes with TIKR’s all-in-one, easy-to-use platform.
- The more rocks you overturn… the more opportunities you’ll uncover. Search 100K+ global stocks, global top investor holdings, and more with TIKR.
Disclaimer:
Please note that the articles on TIKR are not intended to serve as investment or financial advice from TIKR or our content team, nor are they recommendations to buy or sell any stocks. We create our content based on TIKR Terminal’s investment data and analysts’ estimates. Our analysis might not include recent company news or important updates. TIKR has no position in any stocks mentioned. Thank you for reading, and happy investing!