
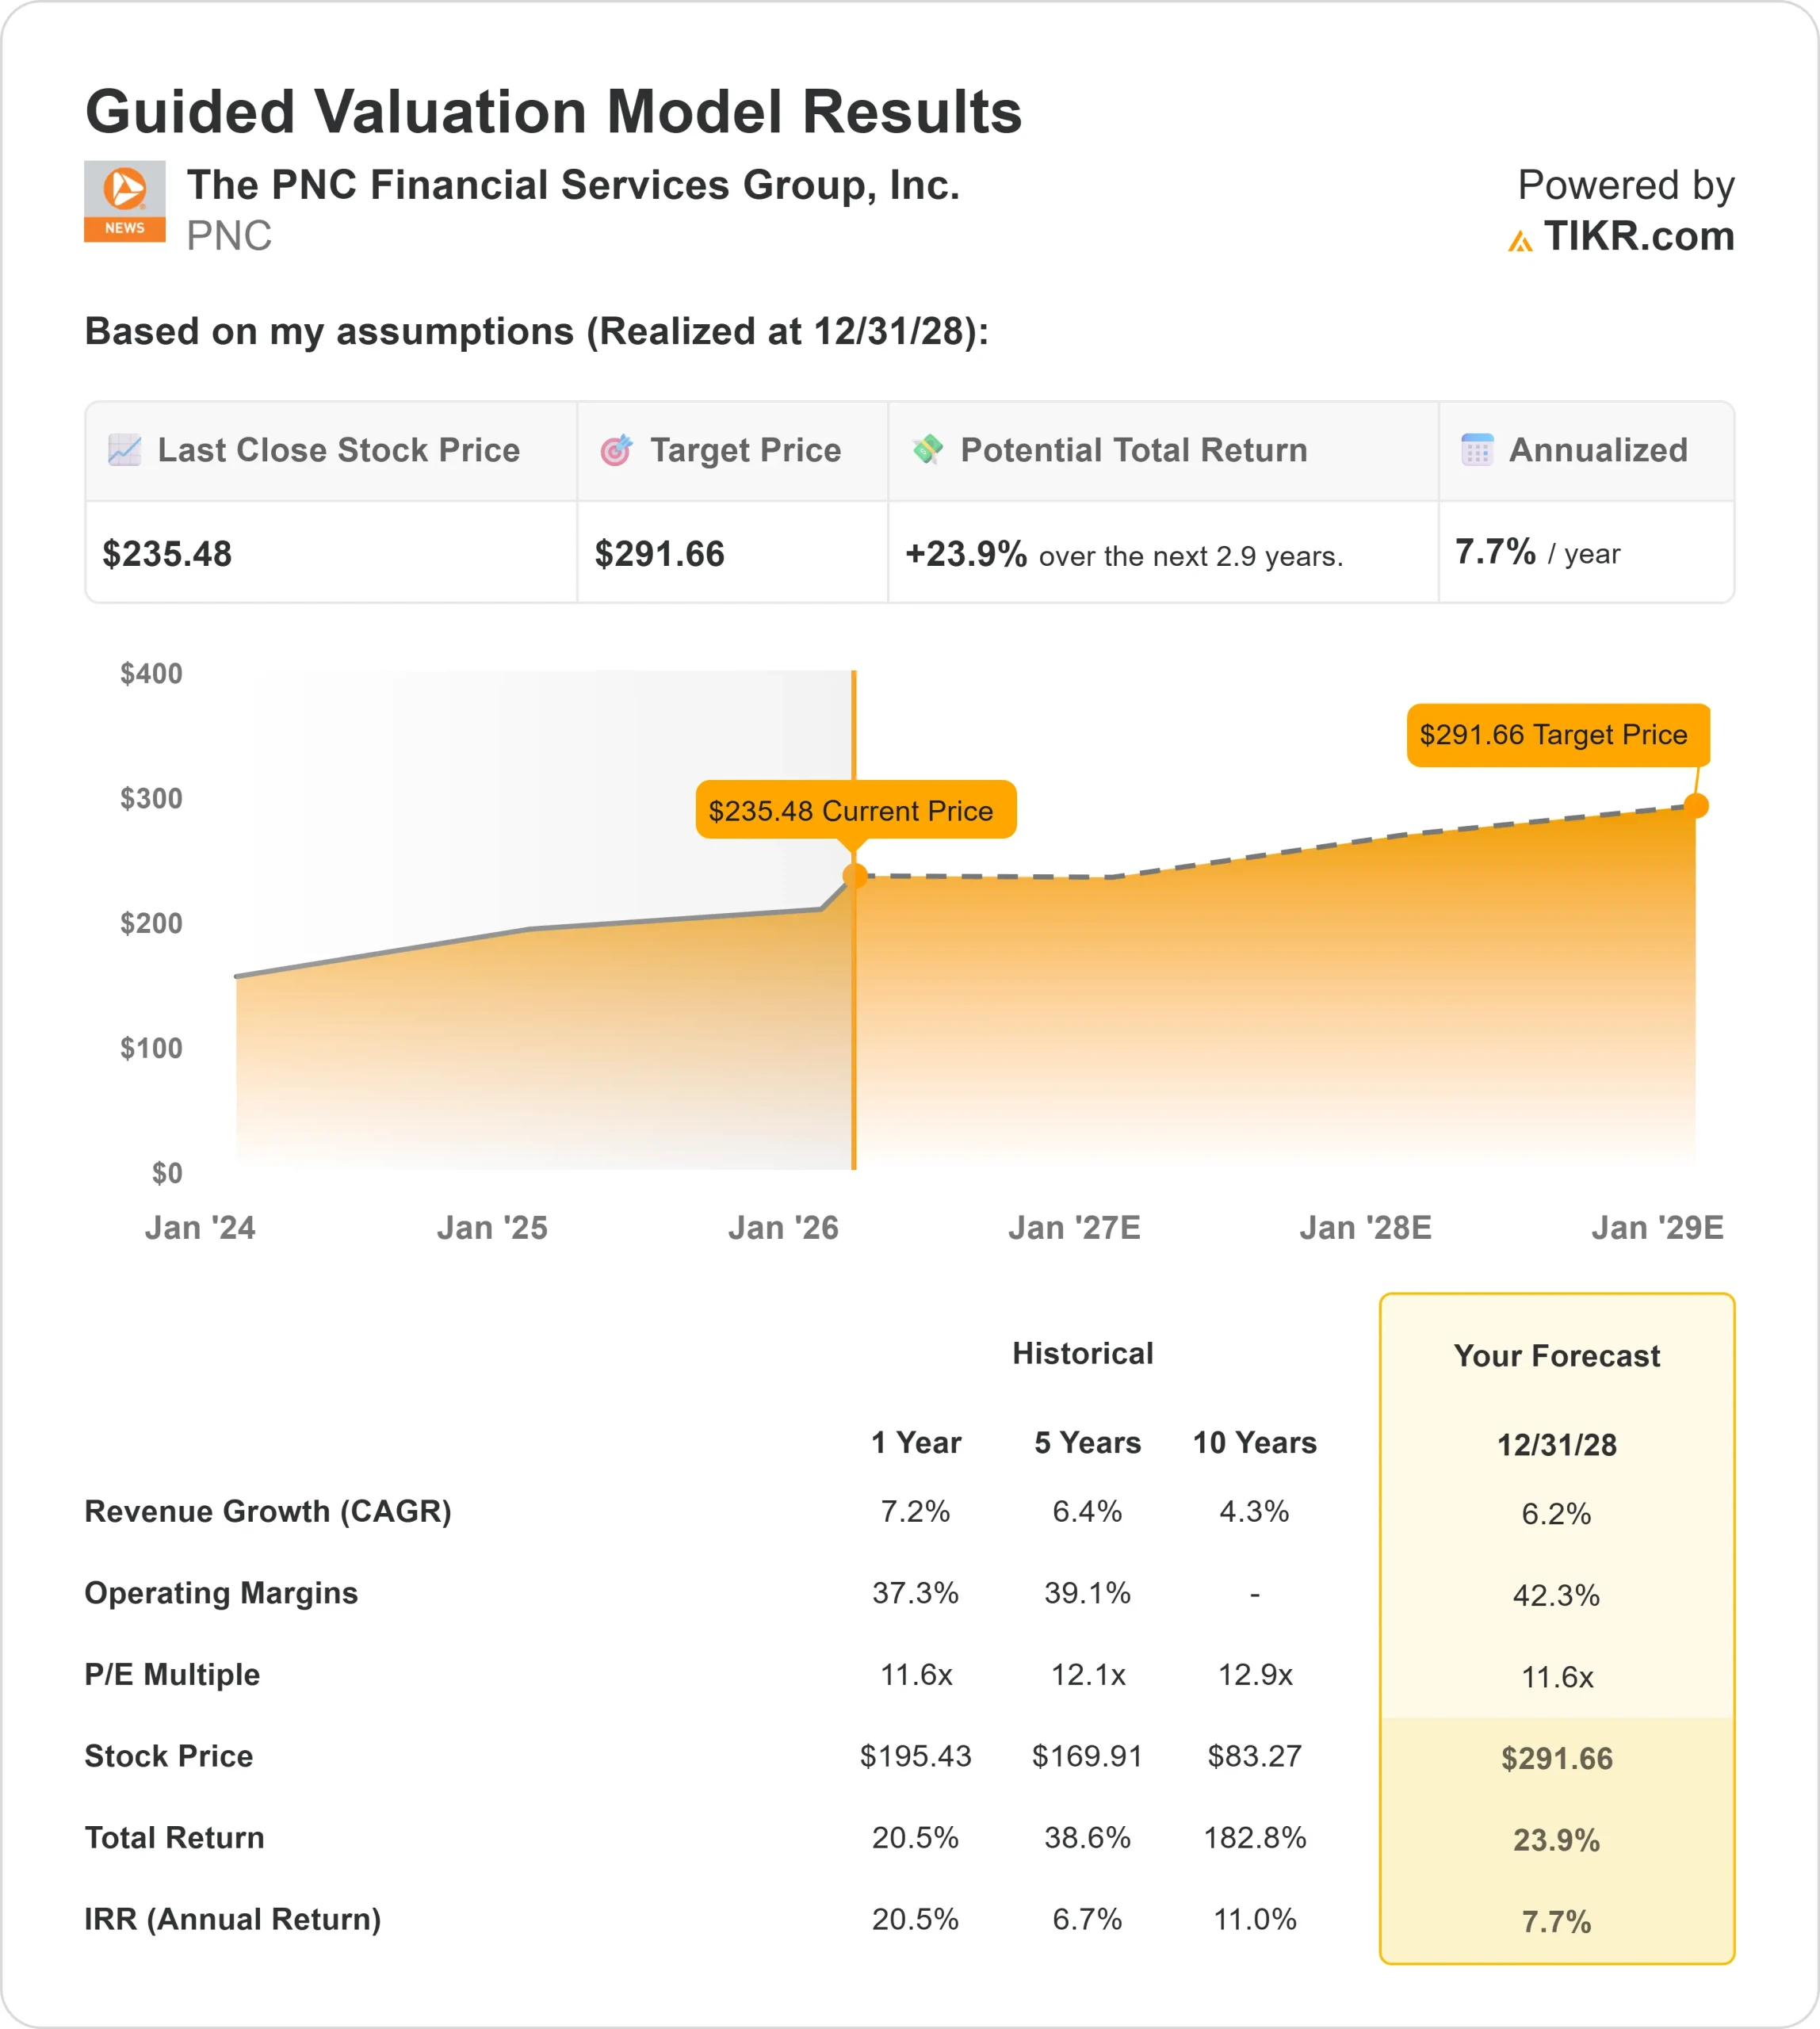
Key Stats for PNC Stock
- Past-Month Performance: 8%
- 52-Week Range: $145 to $244
- Valuation Model Target Price: $292
- Implied Upside: 24%
Value your favorite stocks like PNC Financial Services Group with 5 years of analysts’ forecasts using TIKR’s new Valuation Model (It’s free) >>>
What Happened?
PNC Financial Services Group stock rose about 8% this month, finishing near $235 per share, as investors reacted to stronger 2026 earnings guidance and constructive commentary from management. The move reflected steady accumulation rather than a one-day spike, suggesting investors are positioning around improving earnings visibility.
The stock moved higher after management reaffirmed accelerating net interest income growth at the Bank of America Financial Services Conference this month.
CFO Robert Reilly said the bank “remain[s] constructive” heading into 2026, guiding to 14% net interest income growth including FirstBank and 8% stand-alone, supported by $50 billion of fixed-rate assets repricing this year.
He also said net interest margin is expected to move above 3% in the back half of 2026, reinforcing visibility into earnings expansion.
Analyst and institutional activity added to the advance. JPMorgan raised its price target to $251 with an Overweight rating.
BI Asset Management increased its stake by 159.8%, Envestnet Asset Management added 22,325 shares, and Candriam raised its holdings by 8%, while ProShare Advisors and Thrivent trimmed positions.
Institutional ownership stands at roughly 83.5%, reflecting continued strong sponsorship despite selective repositioning.
Together, reaffirmed growth guidance, margin expansion expectations, and active institutional positioning helped support shares this month as investors priced in improved earnings momentum into 2026.
See analysts’ growth forecasts and price targets for PNC Financial Services Group (It’s free) >>>
Is PNC Financial Services Group Undervalued?
Under valuation assumptions, the stock is modeled using:
- Revenue Growth (CAGR): 6.2%
- Operating Margins: 42.3%
- Exit P/E Multiple: 11.6x
Revenue growth reflects steady commercial and consumer loan expansion supported by strong pipelines and improving commercial real estate trends.
Management noted fourth-quarter loan generation was the strongest in some time, and unfunded loan commitments have been rising, signaling future borrowing demand.
Growth markets such as Texas and Florida continue expanding faster than legacy markets, providing a multiyear runway for organic expansion.
Earnings expansion is increasingly driven by net interest income repricing rather than aggressive loan growth.
Roughly $50 billion of fixed-rate assets are repricing into higher yields, and net interest margin is expected to move above 3% in the back half of 2026. That structural repricing tailwind supports earnings even if broader rate conditions remain stable.
Fee businesses add durability. Capital markets fees rose 18% in 2025, Harris Williams delivered a record fourth quarter, and asset management continues expanding in high-growth markets.
With roughly 40% of revenue coming from noninterest income, PNC benefits from a diversified earnings base that supports return on tangible common equity at the high end of peers.
Operating discipline also strengthens the outlook. Management continues delivering positive operating leverage and sees approximately $1.5 billion of addressable expenses where AI initiatives could reduce costs over time, particularly in retail operations and compliance workflows.
Based on these inputs, the model estimates a target price of $292, implying about 23.9% total upside over roughly 2.9 years, indicating the stock appears undervalued at current prices.
At current levels near $235, PNC appears undervalued, with future performance driven by net interest income growth, diversified fee expansion, and disciplined execution rather than multiple expansion alone.
Estimate a company’s fair value instantly (Free with TIKR) >>>
Value Any Stock in Under 60 Seconds (It’s Free)
With TIKR’s new Valuation Model tool, you can estimate a stock’s potential share price in under a minute.
All it takes is three simple inputs:
- Revenue Growth
- Operating Margins
- Exit P/E Multiple
From there, TIKR calculates the potential share price and total returns under Bull, Base, and Bear scenarios so you can quickly see whether a stock looks undervalued or overvalued.
If you’re not sure what to enter, TIKR automatically fills in each input using analysts’ consensus estimates, giving you a quick, reliable starting point.
See a stock’s true value in under 60 seconds (Free with TIKR) >>>