Key Stats for AT&T Stock
- Current Price: $24.03
- Target Price (Mid): ~$41
- Street Target: ~$30
- Potential Total Return: ~69%
- Annualized IRR: ~12% / year
- Earnings Reaction: +2.42% (4/22/26)
- Max Drawdown: -22.35% (1/27/26)
Now Live: Discover how much upside your favorite stocks could have using TIKR’s new Valuation Model (It’s free) >>>
What Happened?
AT&T Inc. (T) just had the most eventful week of strategic news it has produced in years. The FCC approved its $23 billion EchoStar spectrum acquisition. AT&T, T-Mobile, and Verizon announced a joint venture to eliminate wireless dead zones. And at the May 15 annual stockholders meeting, CEO John Stankey reaffirmed the company’s plan to return more than $45 billion to shareholders between 2026 and 2028. The stock fell 4.5% on the week, closing Friday at $24.03.
That reaction is the central question. Either investors are looking past the headlines and pricing in risks the strategic narrative obscures, or the selloff is creating a window into a stock the TIKR model values at around $41, roughly 69% above current levels.
Stankey captured the bull case at the annual meeting: “After years of investing in best-in-class connectivity, we now have a structural advantage that others won’t catch.” What investors are actually debating is whether the capital intensity required to build that advantage is consuming the very returns it is supposed to generate. That tension is what drove the stock down even as the strategic headlines pointed the other direction.
The Week That Should Have Lifted the Stock
The FCC approved AT&T’s EchoStar acquisition on May 12. AT&T picks up approximately 50 megahertz of nationwide spectrum for $23 billion: 30 MHz of mid-band 3.45 GHz capacity and 20 MHz of low-band 600 MHz spectrum. The FCC noted AT&T had already deployed the 3.45 GHz spectrum across 23,000 sites under special temporary authority, boosting download speeds by up to 80% nationwide before the deal formally closed.
The following day, the three largest U.S. carriers announced a joint venture using satellite-based direct-to-device technology to close coverage gaps in rural and underserved areas. Stankey had signaled this direction at the annual meeting the previous morning, describing the initiative as a way to “foster a robust wholesale satellite ecosystem that seamlessly integrates these capabilities at an attractive price into the services that we already offer.”
Yet the stock fell harder on May 15 than the broader market. AT&T dropped 2.52% to $24.03, while the S&P 500 declined 1.24% and Verizon slipped 1.47%.
See historical and forward estimates for AT&T stock (It’s free!) >>>
What Is Actually Driving the Selloff
The selloff is not about the spectrum deal or the JV. It is about the balance sheet and the free cash flow trajectory that fund both.
Stankey disclosed at the annual meeting that leverage will temporarily move to 3.2x net debt to adjusted EBITDA following the EchoStar close, up from 2.71x at the end of Q1 2026 and 2.53x at year-end 2025. The path back to the 2.5x target takes approximately three years. AT&T currently carries $147.8 billion in net debt at 2.93x net debt/EBITDA per TIKR data, and EchoStar pushes that higher before it comes down.
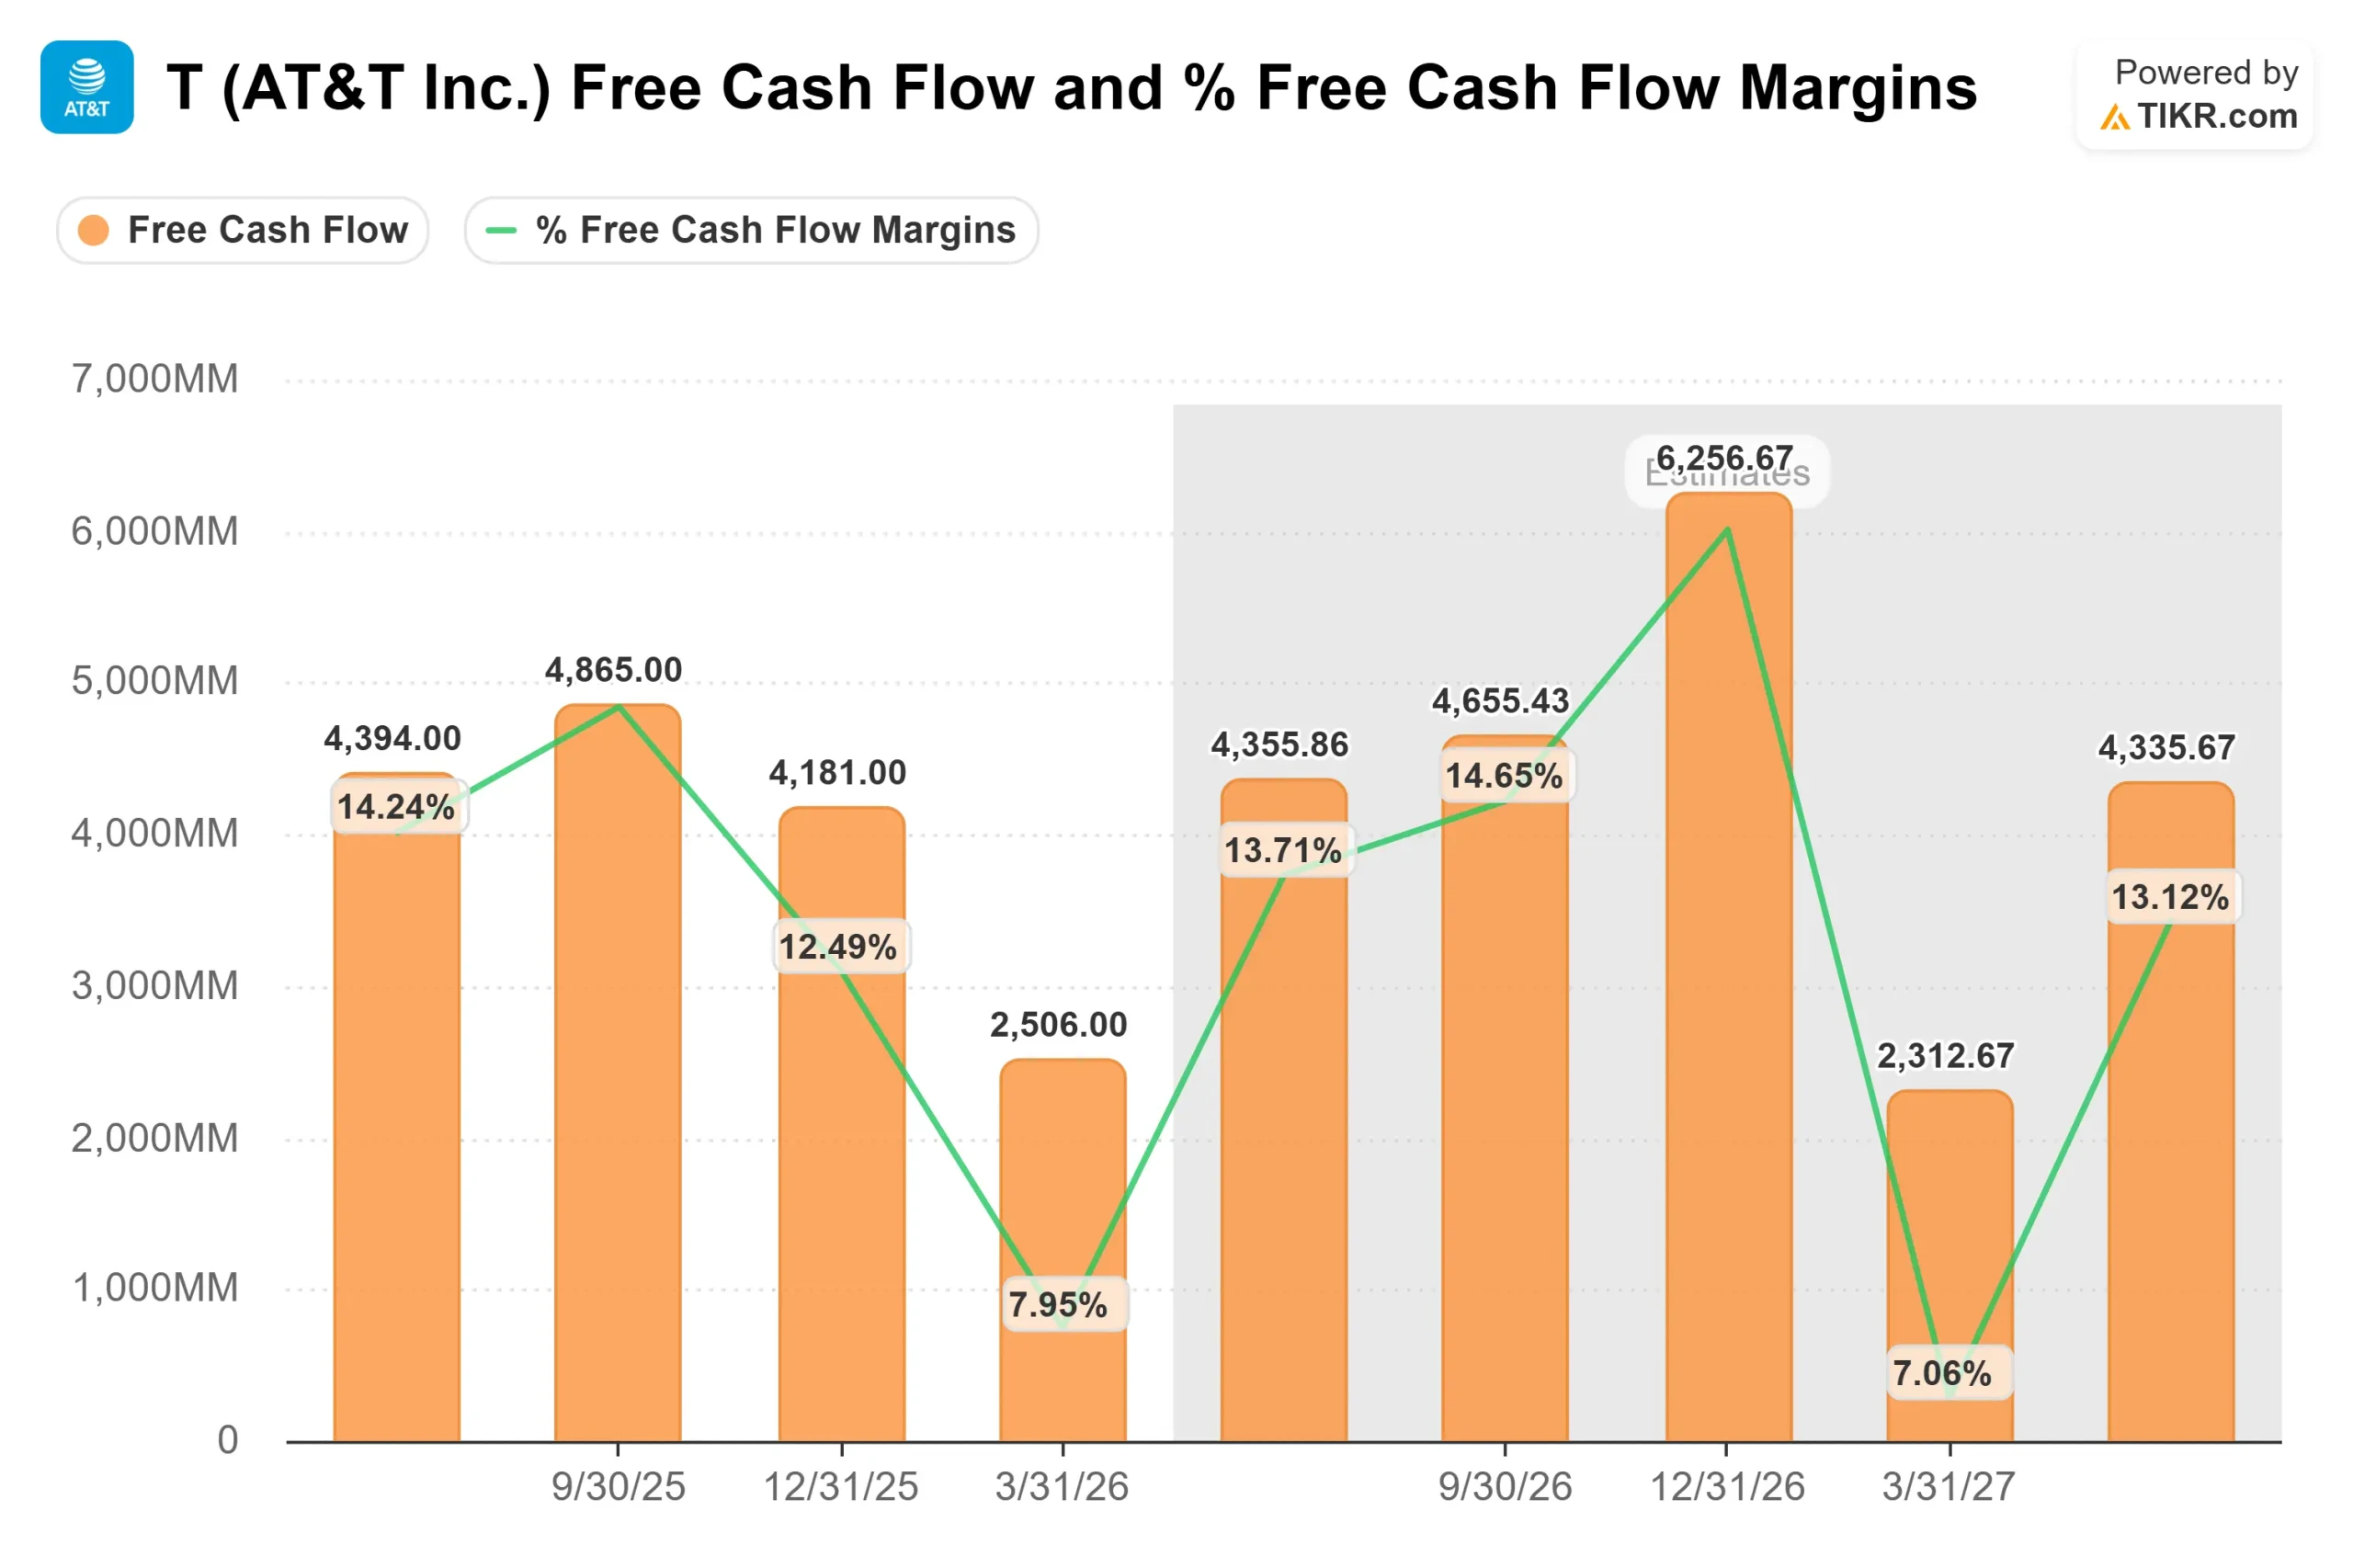
Free cash flow adds to the concern. Q1 2026 FCF came in at $2,506 million, down around 20% from $3,146 million in Q1 2025. Management’s full-year FCF target is at least $18 billion, with Q2 guided to $4.0 to $4.5 billion per management’s own Q1 earnings commentary. Q1 capital expenditure was $4,877 million, and management’s full-year capex guidance sits at $23 billion to $24 billion. That spending level will not ease until the Lumen integration and EchoStar buildout both move through their peak phases.
Why the Bull Case Is Stronger Than the Price Suggests
The bear argument is almost entirely a timing argument: too much spending now, too much debt for too long. The bull argument rests on a convergence flywheel that is already producing measurable results.
Stankey put it directly: “More people are choosing AT&T for all of their connectivity needs than ever before.” The key metric behind that statement is that 42% of AT&T’s advanced home internet customers now also take AT&T wireless. Bundled customers churn less, spend more, and cost less to retain. That dynamic improves profit margins structurally, not just cyclically.
The financials support this trajectory. Full-year 2025 revenue was $125,648 million, up 2.7% year-over-year, with EBITDA of $46,361 million at a 36.9% margin. Consensus estimates on the TIKR project that EBITDA grows to around $48 billion in 2026 and roughly $50 billion in 2027, with margins expanding to 37.1% and 37.7%, respectively. The path is steady rather than dramatic, which suits a business carrying this level of debt.
The EchoStar spectrum addresses something beyond the balance sheet. Stankey described the demand shift at the annual meeting: “AI is going to fundamentally transform network requirements beyond download speeds to the ability to support more symmetrical traffic upstream just as much as downstream and ultra-low latency capabilities.” The 3.45 GHz mid-band is precisely the capacity that supports those requirements, and AT&T deployed it at scale before the deal formally closed.
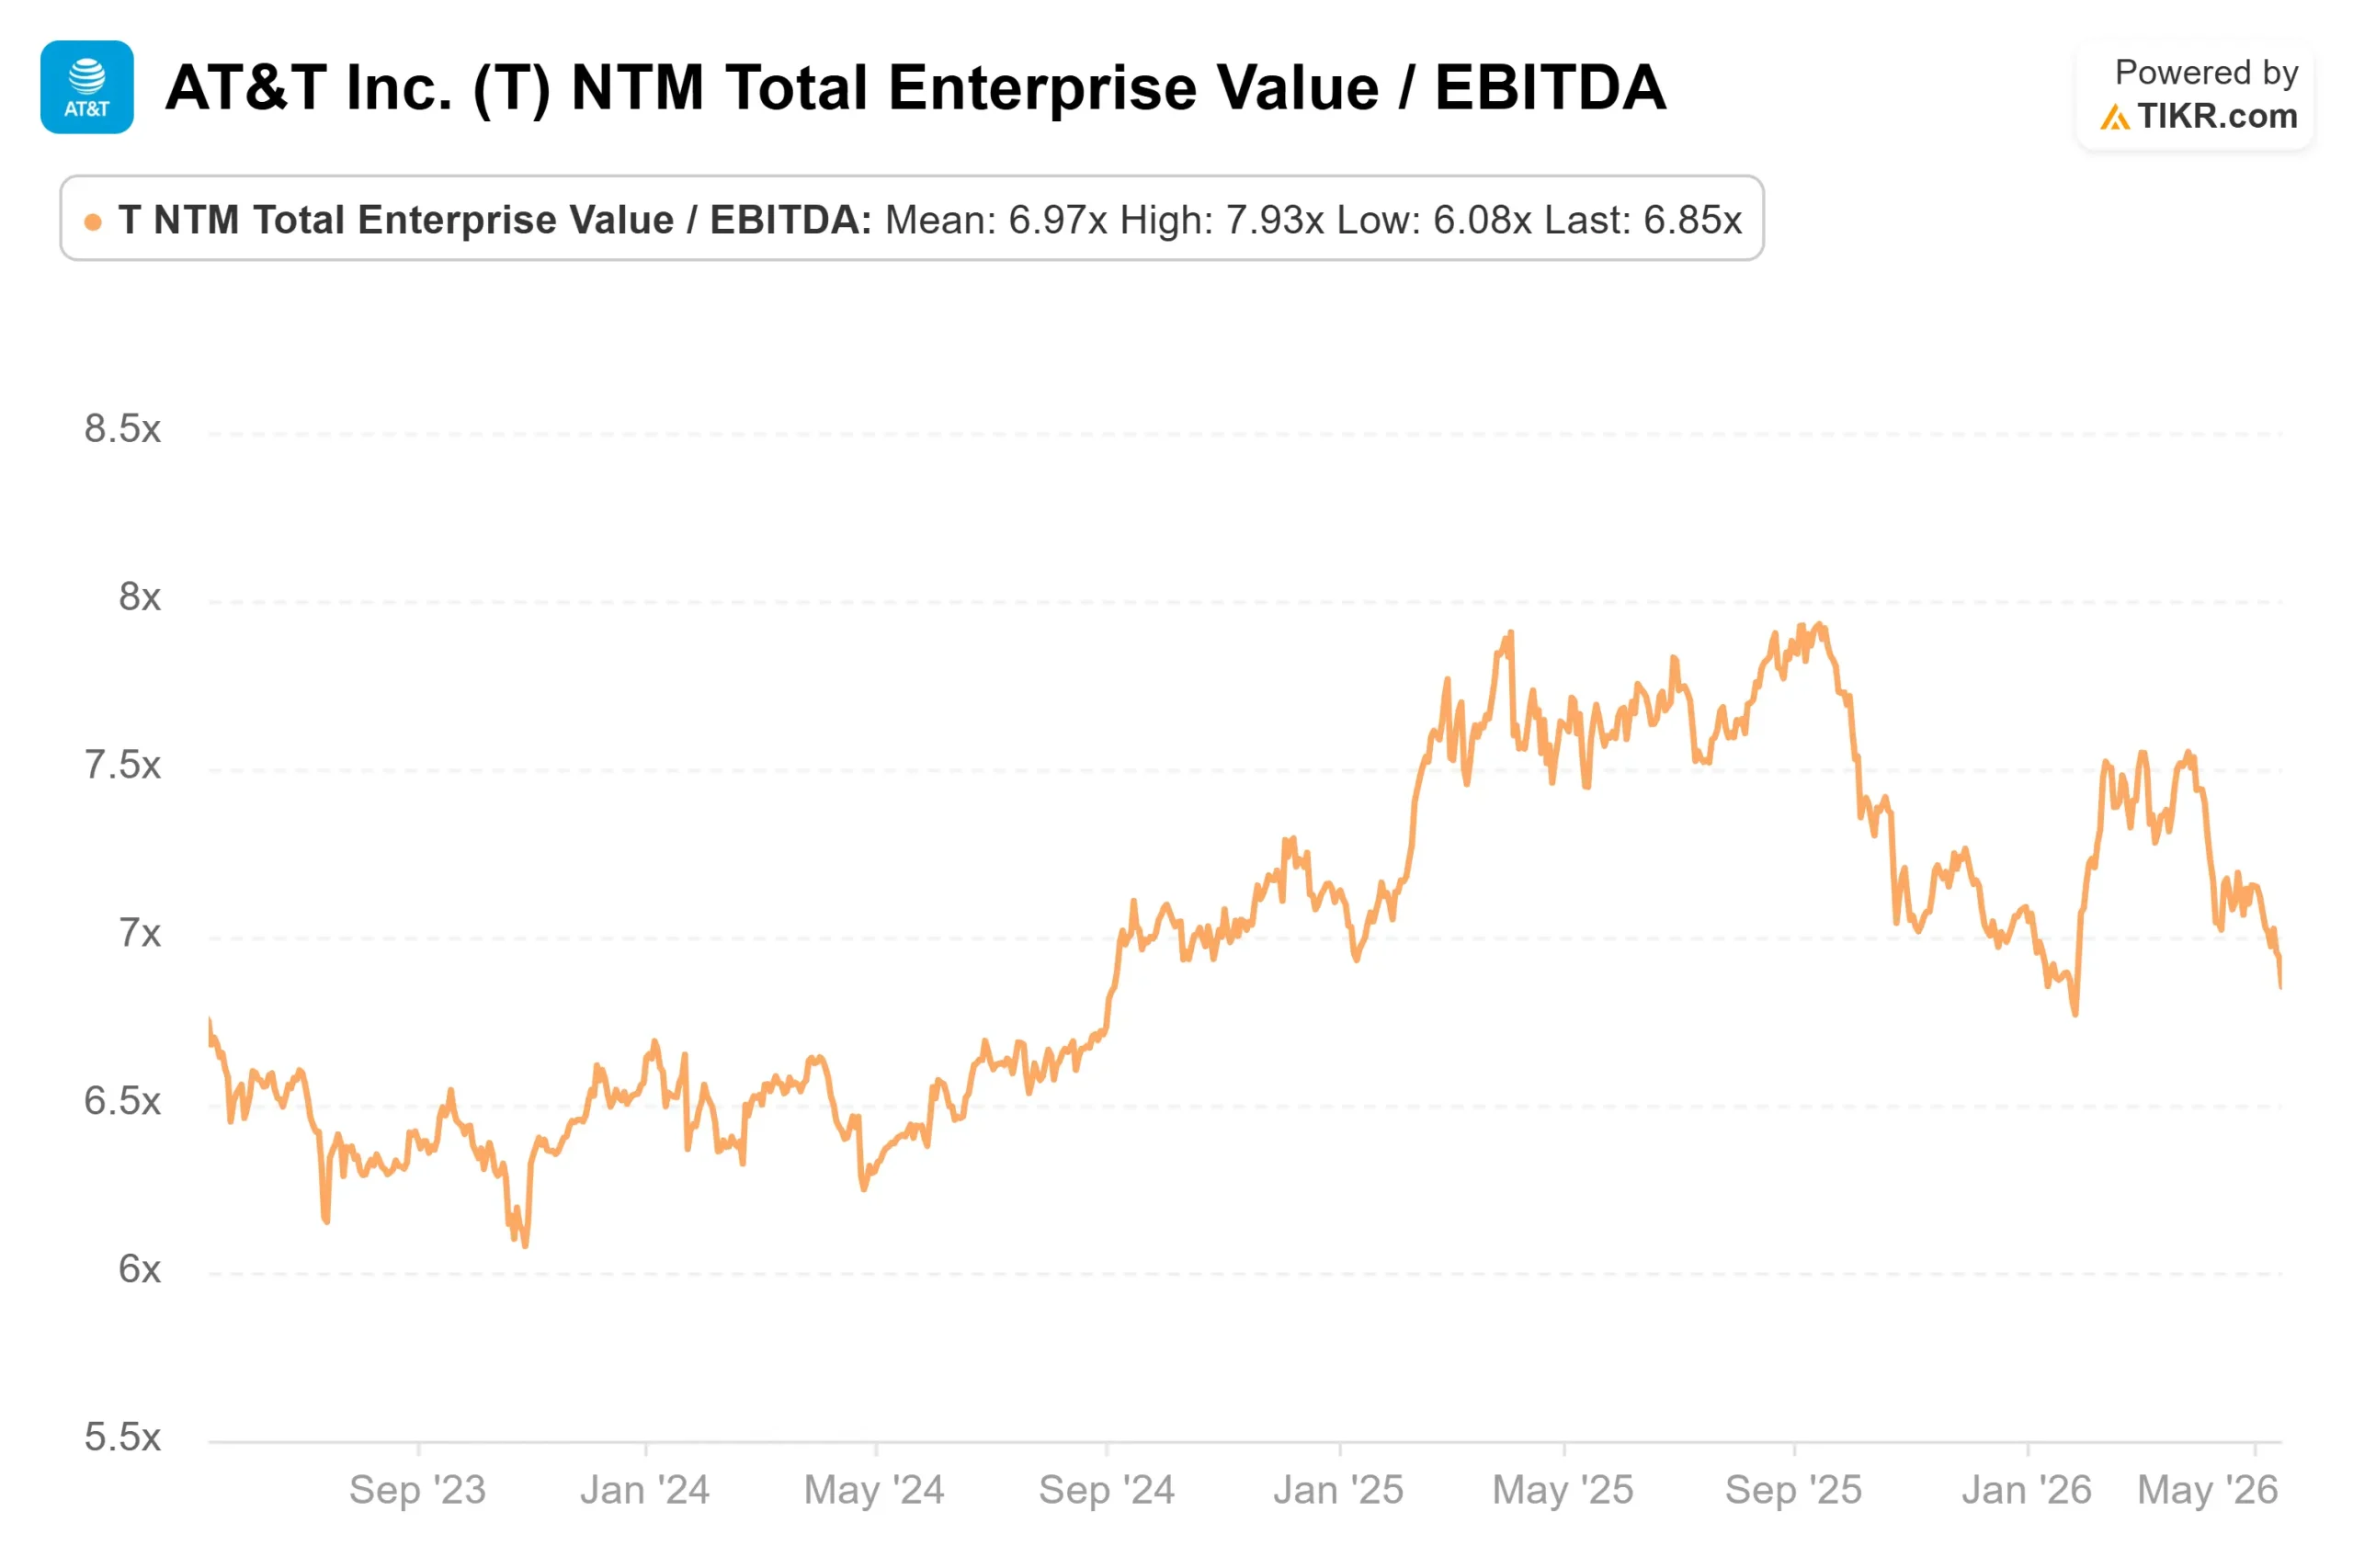
On valuation multiples, AT&T trades at 6.85x NTM EV/EBITDA. Verizon trades at 7.16x and Comcast at 5.20x, per TIKR’s Competitors page, with the peer group median at 6.15x. AT&T’s modest premium to the median is defensible given its larger fiber footprint, higher convergence rate, and committed capital return program. At 10.19x NTM P/E with a 4.7% dividend yield, it does not screen as expensive relative to its peers or its own history.
See how AT&T performs against its peers in TIKR (It’s free!) >>>
TIKR Advanced Model Analysis
- Current Price: $24.03
- Target Price (Mid): ~$41
- Potential Total Return: ~69%
- Annualized IRR: ~12% / year

See analysts’ growth forecasts and price targets for AT&T stock (It’s free!) >>>
The TIKR mid-case model values AT&T at approximately $41 by December 31, 2030, implying around 69% total return and a 12% annualized IRR from the current $24.03 price. The mid-case reflects consensus growth and margin assumptions visible in TIKR’s forward estimates, without requiring either a sharp valuation re-rating or a fundamental turnaround.
The two primary revenue CAGR drivers are fiber penetration growth and wireless service revenue stability. The model assumes around 3% annual revenue growth through 2030. The key margin driver is operating leverage across a largely fixed network cost structure, with EBITDA margins projected to expand from 36.9% in 2025 toward approximately 38.7% by 2029.
The primary risk is balance sheet pressure. If net debt/EBITDA stays elevated beyond the three-year timeline Stankey outlined, capital allocation flexibility narrows, and the FCF target becomes harder to defend. If fiber penetration accelerates and convergence rates push above 42%, free cash flow recovers ahead of schedule, and the ~$41 mid-case target may prove conservative.
At around 12% annualized IRR, reaching the mid-case does not require a dramatic transformation. It requires AT&T to keep executing what it has been building for three years.
Conclusion
The number to watch is Q2 2026 free cash flow, reported in late July. Management guided Q2 FCF to $4.0 to $4.5 billion. If it lands in that range, the Q1 trough reads as seasonal, and the full-year $18 billion target stays intact. If it misses again, the question of whether that target is achievable becomes unavoidable.
The spectrum, the JV, and the convergence story are all real. So is the debt. Late July is when investors find out whether AT&T’s most consequential strategic week in years is starting to pay for itself.
See what stocks billionaire investors are buying so you can follow the smart money with TIKR.
Should You Invest in AT&T?
The only way to really know is to look at the numbers yourself. TIKR gives you free access to the same institutional-quality financial data that professional analysts use to answer exactly that question.
Pull up AT&T, and you’ll see years of historical financials, what Wall Street analysts expect for revenue and earnings in the quarters ahead, how valuation multiples have moved over time, and whether price targets are trending up or down.
You can build a free watchlist to track AT&T alongside every other stock on your radar. No credit card required. Just the data you need to decide for yourself.
Looking for New Opportunities?
- See what stocks billionaire investors are buying so you can follow the smart money.
- Analyze stocks in as little as 5 minutes with TIKR’s all-in-one, easy-to-use platform.
- The more rocks you overturn… the more opportunities you’ll uncover. Search 100K+ global stocks, global top investor holdings, and more with TIKR.
Disclaimer:
Please note that the articles on TIKR are not intended to serve as investment or financial advice from TIKR or our content team, nor are they recommendations to buy or sell any stocks. We create our content based on TIKR Terminal’s investment data and analysts’ estimates. Our analysis might not include recent company news or important updates. TIKR has no position in any stocks mentioned. Thank you for reading, and happy investing!