Key Takeaways:
- Governance Reset: ONEOK added 2 independent directors in January 2026, and the Audit and Compensation committee placements sharpen oversight as ONEOK integrates recent deals and targets steadier cash flows.
- Capital Return Signal: ONEOK raised its quarterly dividend 4% to $1 per share, and the payout step-up reinforces ONEOK’s stance that cash flow stability matters as volume growth moderates.
- Price Projection: With ONEOK’s model assuming 17% revenue growth, 18% operating margins, and a 14x P/E, ONEOK stock could reach $100 by December 2027.
- Return Math: The ONEOK target implies 18% upside from the $85 current price, and the model translates that spread into a 9% annualized return over 2 years.
Breaking Down the Case for ONEOK, Inc.
ONEOK (ONEOK) enters 2026 with a governance refresh and a dividend reset, as the company added 2 independent directors in January 2026 and raised its quarterly dividend 4% to $1 per share.
The board elected Mark McCollum and Precious Owodunni last month, and placed them on the Audit, Compensation, and Governance committees to tighten oversight as integration risk rises.
ONEOK’s scale expanded quickly, as revenue reached $22 billion in 2024 and the revenue line points to $33 billion in 2025E, and that step-up sets a higher bar for integration discipline.
Profitability also moved, as ONEOK posted $8 billion of gross profit in 2024 and $5 billion of operating income on $3 billion of operating expenses, while the 23% operating margin put execution leverage into the base.
The near-term margin profile looks less forgiving, as LTM revenue reached $32 billion and LTM gross profit reached $10 billion, while operating expenses rose to $4 billion and operating income reached $6 billion with a 19% operating margin.
Management frames the strategy around connectivity and throughput, and CEO Pierce Norton in a special call last December, “We want to touch as many molecules as we can for basically as many times as we can for as long as we can.”
That lens explains ONEOK’s mix shift since 2021 and the focus on demand-pull assets, as the company widened refined-products exposure and deepened Permian and Mid-Continent connectivity through recent acquisitions.
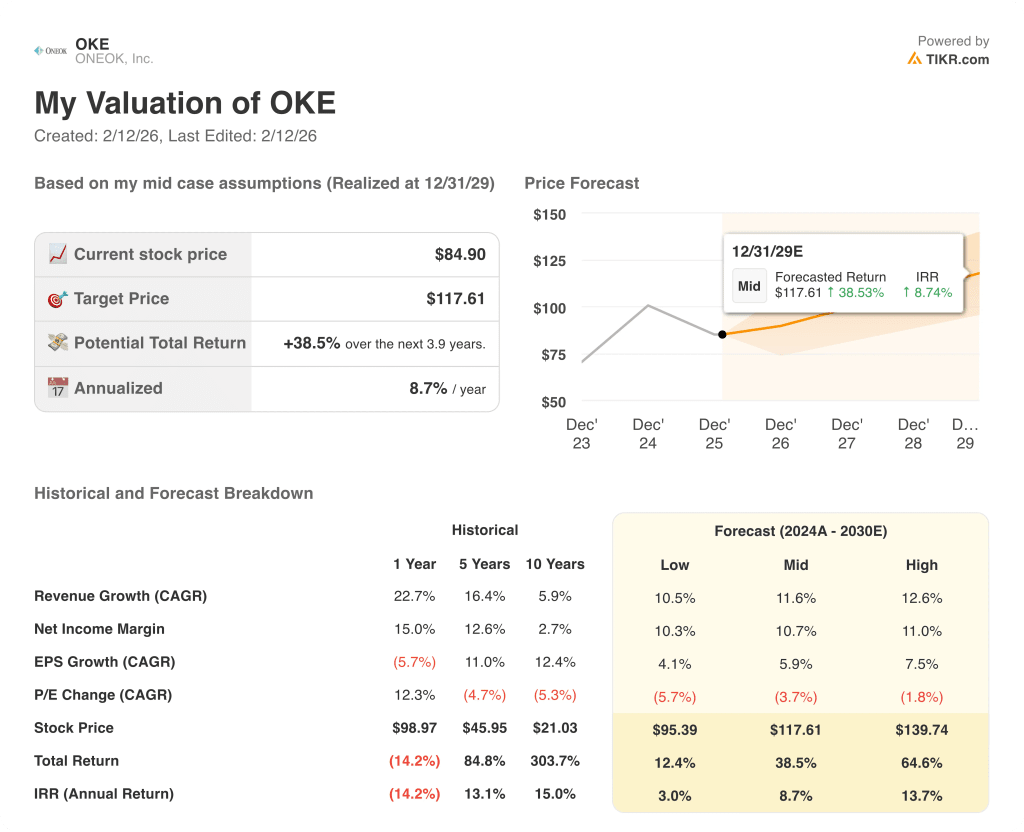
With the stock at $85 and the model pointing to $100 by 2027 on a 14x P/E, investors weigh 18% upside against integration delivery and a margin base that sits below 23%.
What the Model Says for OKE Stock
ONEOK stock combines 16.5% revenue growth with 17.7% operating margins, and this integration supports earnings stability across NGL, refined products, and natural gas assets after recent acquisitions.
The model applies 16.5% revenue growth, 17.7% margins, and a 13.7x exit multiple to derive a $100.37 target price by 2027.
That equates to 18.2% total upside from $84.90 and a 9.3% annualized return over 1.9 years, modest relative to midstream risk.

The model signals conservative a Sell, as a 9.3% annualized return fails to exceed typical 10% equity hurdle rates despite 13.7x valuation support.
A 9.3% annualized return trails a 10% equity hurdle rate, offering limited capital appreciation and insufficient compensation for commodity exposure, integration execution, and volume variability embedded in ONEOK’s 13.7x exit multiple.
Our Valuation Assumptions
TIKR’s Valuation Model lets you plug in your own assumptions for a company’s revenue growth, operating margins, and P/E multiple, and calculates the stock’s expected returns.
Here’s what we used for ONEOK stock:
1. Revenue Growth: 3%
ONEOK stock delivered 22.7% revenue growth over 1 year and 16.4% over 5 years, while LTM revenue of $32 billion shows that scale now depends more on basin throughput than acquisition step-ups.
Market assumption places revenue at $33 billion in 2026E after $33 billion in 2025E, yet the model applies a 16.5% CAGR that assumes volume density rises across Permian, Bakken, and Mid-Continent systems.
That 16.5% path requires steady NGL and gas flows and sustained refined-products demand, while producer capital discipline or lower commodity activity cuts volumes and constrains fee-based expansion.
This sits above the 1-year historical revenue growth of 22.7%, as growth moderates from acquisition spikes and shifts toward organic throughput, which implies less margin for execution error within ONEOK stock.
2. Operating Margins: 7.6%
ONEOK stock carries 23.0% operating margins over 1 year and 18.7% on an LTM basis, and that spread shows how quickly fee mix and costs move with commodity-linked volumes.
The model uses 17.7% operating margins, and LTM gross profit of $10 billion and LTM operating income of $6 billion show a base that supports efficiency as synergy capture continues.
Margins hold near 17.7% only if project start-ups add fee volumes and costs stay in check, while weaker spreads or higher operating expenses cut EBIT even if revenue holds.
This sits below the Market assumption of 18.2% EBIT margins for 2026E, and a small miss on revenue or costs can erase the margin cushion that the model needs.
3. Exit P/E Multiple: 7x
ONEOK stock trades at 13.7x on a 1-year view, while the 5-year P/E of 15.1x and 10-year P/E of 18.4x show that the market reduces valuation during heavier capital cycles.
The model sets a 13.7x exit P/E multiple, and that aligns with a midstream profile where net income of $3 billion must convert into durable cash flow after large integration phases.
The multiple holds near 13.7x only if leverage trends stabilize and earnings remain near projected levels, while margin slippage or lower volume guidance reduces confidence in terminal earnings power.
This is below the 5-year historical P/E of 15.1x, as acquisition scale increases balance sheet complexity and limits re-rating potential, and that constrains valuation expansion within ONEOK stock.
What Happens If Things Go Better or Worse?
ONEOK stock results hinge on basin throughput, integration discipline, capital allocation priorities, and fee-based cash flow durability through 2029.
- Low Case: If volume growth slows and integration benefits fade, revenue grows 10.5% and net margins hold 10.3% → 3.0% annualized return.
- Mid Case: With steady throughput gains and cost control, revenue grows 11.6% and net margins reach 10.7% → 8.7% annualized return.
- High Case: If connectivity strategy captures incremental volumes and costs stabilize, revenue grows 12.6% and net margins approach 11.0% → 13.7% annualized return.
How Much Upside Does ONEOK Stock Have From Here?
With TIKR’s new Valuation Model tool, you can estimate a stock’s potential share price in under a minute.
All it takes is three simple inputs:
- Revenue Growth
- Operating Margins
- Exit P/E multiple
If you’re not sure what to enter, TIKR automatically fills in each input using analysts’ consensus estimates, giving you a quick, reliable starting point.
From there, TIKR calculates the potential share price and total returns under Bull, Base, and Bear scenarios so you can quickly see whether a stock looks undervalued or overvalued.
Looking for New Opportunities?
- See what stocks billionaire investors are buying so you can follow the smart money.
- Analyze stocks in as little as 5 minutes with TIKR’s all-in-one, easy-to-use platform.
- The more rocks you overturn… the more opportunities you’ll uncover. Search 100K+ global stocks, global top investor holdings, and more with TIKR.
Disclaimer:
Please note that the articles on TIKR are not intended to serve as investment or financial advice from TIKR or our content team, nor are they recommendations to buy or sell any stocks. We create our content based on TIKR Terminal’s investment data and analysts’ estimates. Our analysis might not include recent company news or important updates. TIKR has no position in any stocks mentioned. Thank you for reading, and happy investing!