Market share is one of the clearest indicators of competitive health. A company gaining share is winning customers from competitors, demonstrating that its products, pricing, or distribution are superior. A company losing share is falling behind, watching competitors take business that used to be theirs. Over time, these trends compound. Winners get stronger as scale advantages reinforce their positions. Losers get weaker as they spread fixed costs over a shrinking revenue base.
Yet most investors pay surprisingly little attention to market share. They focus on revenue growth without asking whether the company is growing faster or slower than its market. A business growing 8% annually sounds healthy until you learn the industry is growing 15%. That company is losing share despite growing sales, and eventually the competitive weakness will show up in margins, returns on capital, and earnings.
The challenge is that market share data is not printed on the income statement. You have to piece it together from competitor filings, management commentary, and industry data. Understanding market share dynamics often reveals a business’s trajectory before it becomes apparent in reported financials.
Why Market Share Trends Matter
Market share trends reveal competitive dynamics that financial statements alone cannot capture. A company can report solid revenue growth while losing ground to competitors who are growing faster. By the time these losses show up clearly in the financials, the damage is often severe and difficult to reverse.
Gaining share typically indicates that customers prefer your product or value proposition over alternatives. Whatever the source, sustained share gains suggest competitive advantages that are working. These advantages tend to compound because scale brings lower costs, greater investment capacity, and stronger bargaining power. Losing share signals the opposite, and sustained losses indicate competitive weaknesses that tend to worsen over time.
The rate of change matters as much as direction. A company losing one point of share over five years faces a different situation than one losing one point annually. Gradual shifts allow time for response. Rapid losses suggest fundamental problems that may be difficult to address.
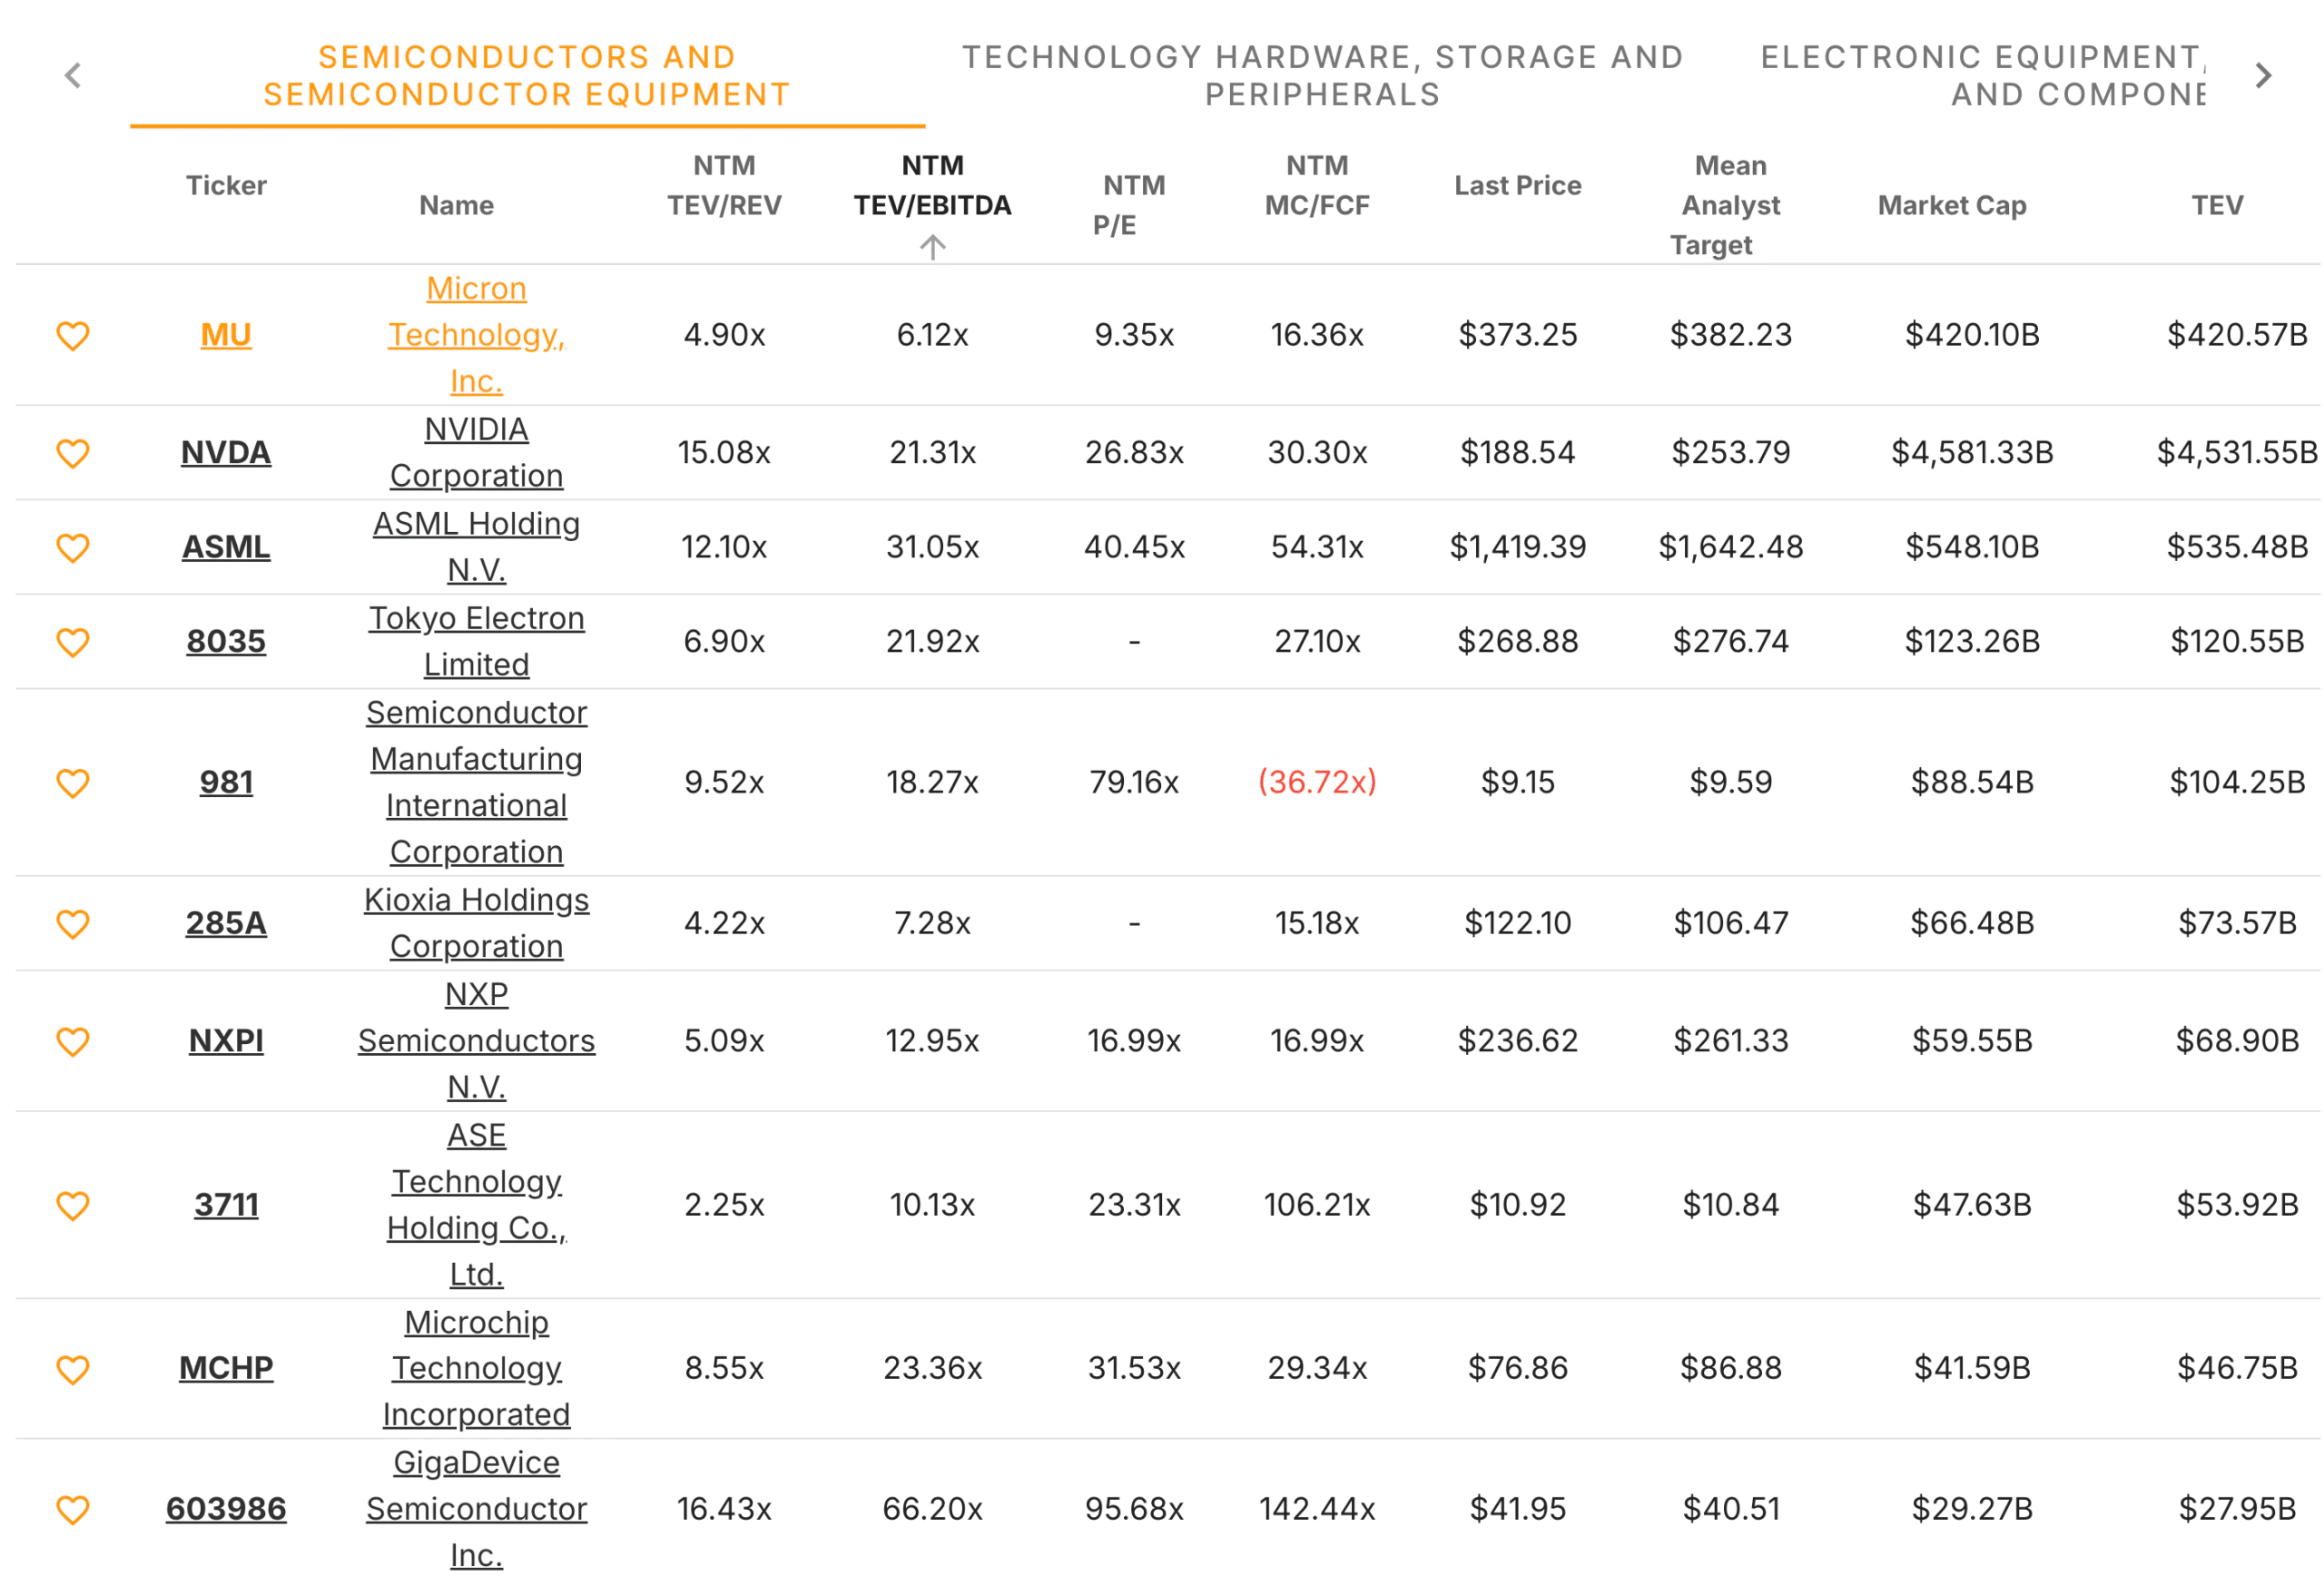
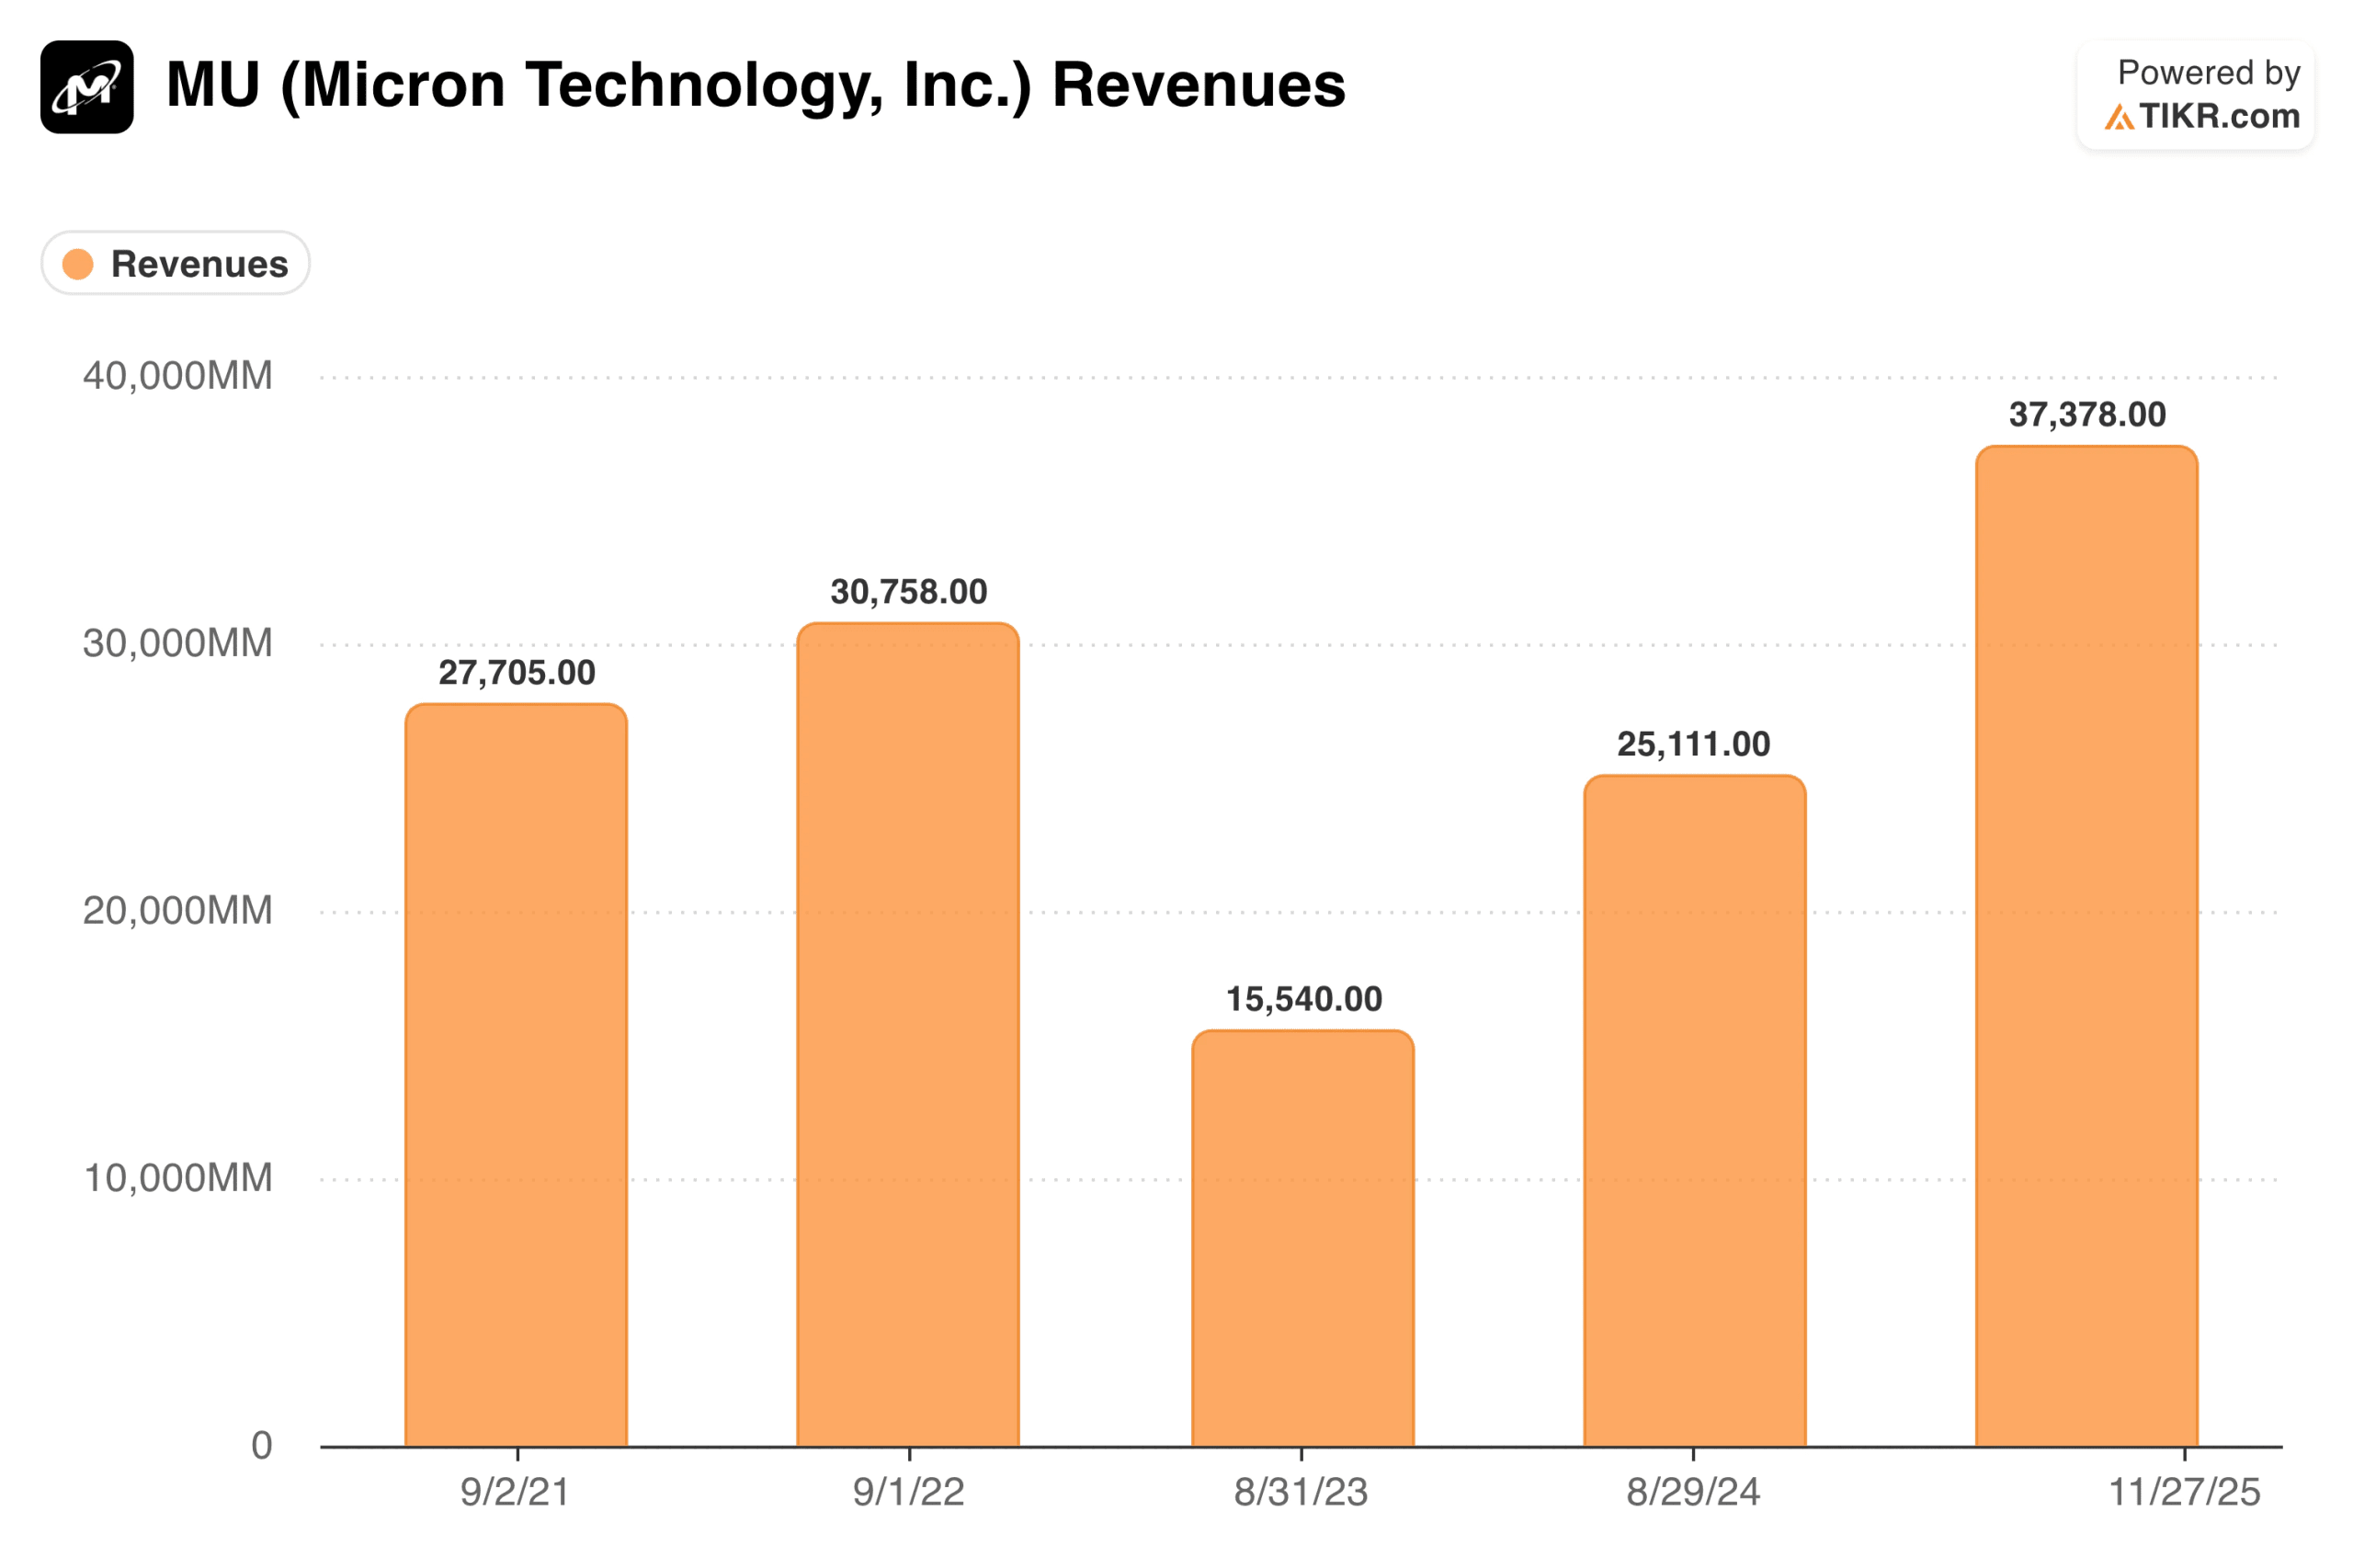
TIKR tip: Compare a company’s revenue growth to competitors like Micron (MU) in TIKR’s Competitors tab. If peers are consistently growing faster, the company is likely losing market share, even if its own growth appears acceptable in isolation.
Review competitor information for thousands of stocks in under 60 seconds (Free with TIKR) >>>
How to Find and Calculate Market Share
The most reliable method for tracking market share is to use audited financial data from competitors. If you know the revenue for all major players in an industry, you can calculate each company’s share of the total. This approach requires identifying the relevant competitors and ensuring you compare similar business segments, but it produces consistent, verifiable results.
The definition of the market matters enormously. A company might be gaining share in a narrowly defined niche while losing share in the broader category. Define the market in a way that captures the competitive dynamics most relevant to the company’s business.
Industry growth rates interact with share trends in important ways. Gaining share in a growing market is the best outcome because revenue growth compounds with market expansion. Losing share in a declining market is the worst outcome, combining competitive weakness with structural headwinds.
TIKR tip: Use TIKR to pull revenue figures for a company and its key competitors over multiple years. Calculating each company’s percentage of combined revenue reveals share trends that management may not highlight.
Start With Investor Presentations and Industry Reports
Often, you’ll find that the fastest way to find market share data is the company’s own investor presentation. Management teams frequently cite their market position when it supports the investment thesis, and they often reference third-party research from firms like Gartner, IDC, or IBISWorld. A quick search for the company’s latest investor day or earnings presentation often yields market share figures with no calculation required.
Value any stock in less than 60 seconds with TIKR’s new Valuation Model (It’s free) >>>
Connecting Market Share to Financial Performance
Share gains typically precede margin expansion because scale improves cost position. A company gaining share spreads fixed costs over more units, gains bargaining power with suppliers, and can invest more than smaller competitors. These advantages accumulate gradually, so margin expansion may lag share gains by several years.
Share losses work in reverse, often with a delay before margins compress. A company can maintain margins for a while by cutting costs or reducing investment. Eventually, these approaches exhaust themselves, and the margin collapse that follows is often steeper than the gradual share erosion that preceded it.
Returns on capital often track market position over time. Industry leaders with dominant share typically earn higher returns than marginal players because their scale advantages translate to better economics.
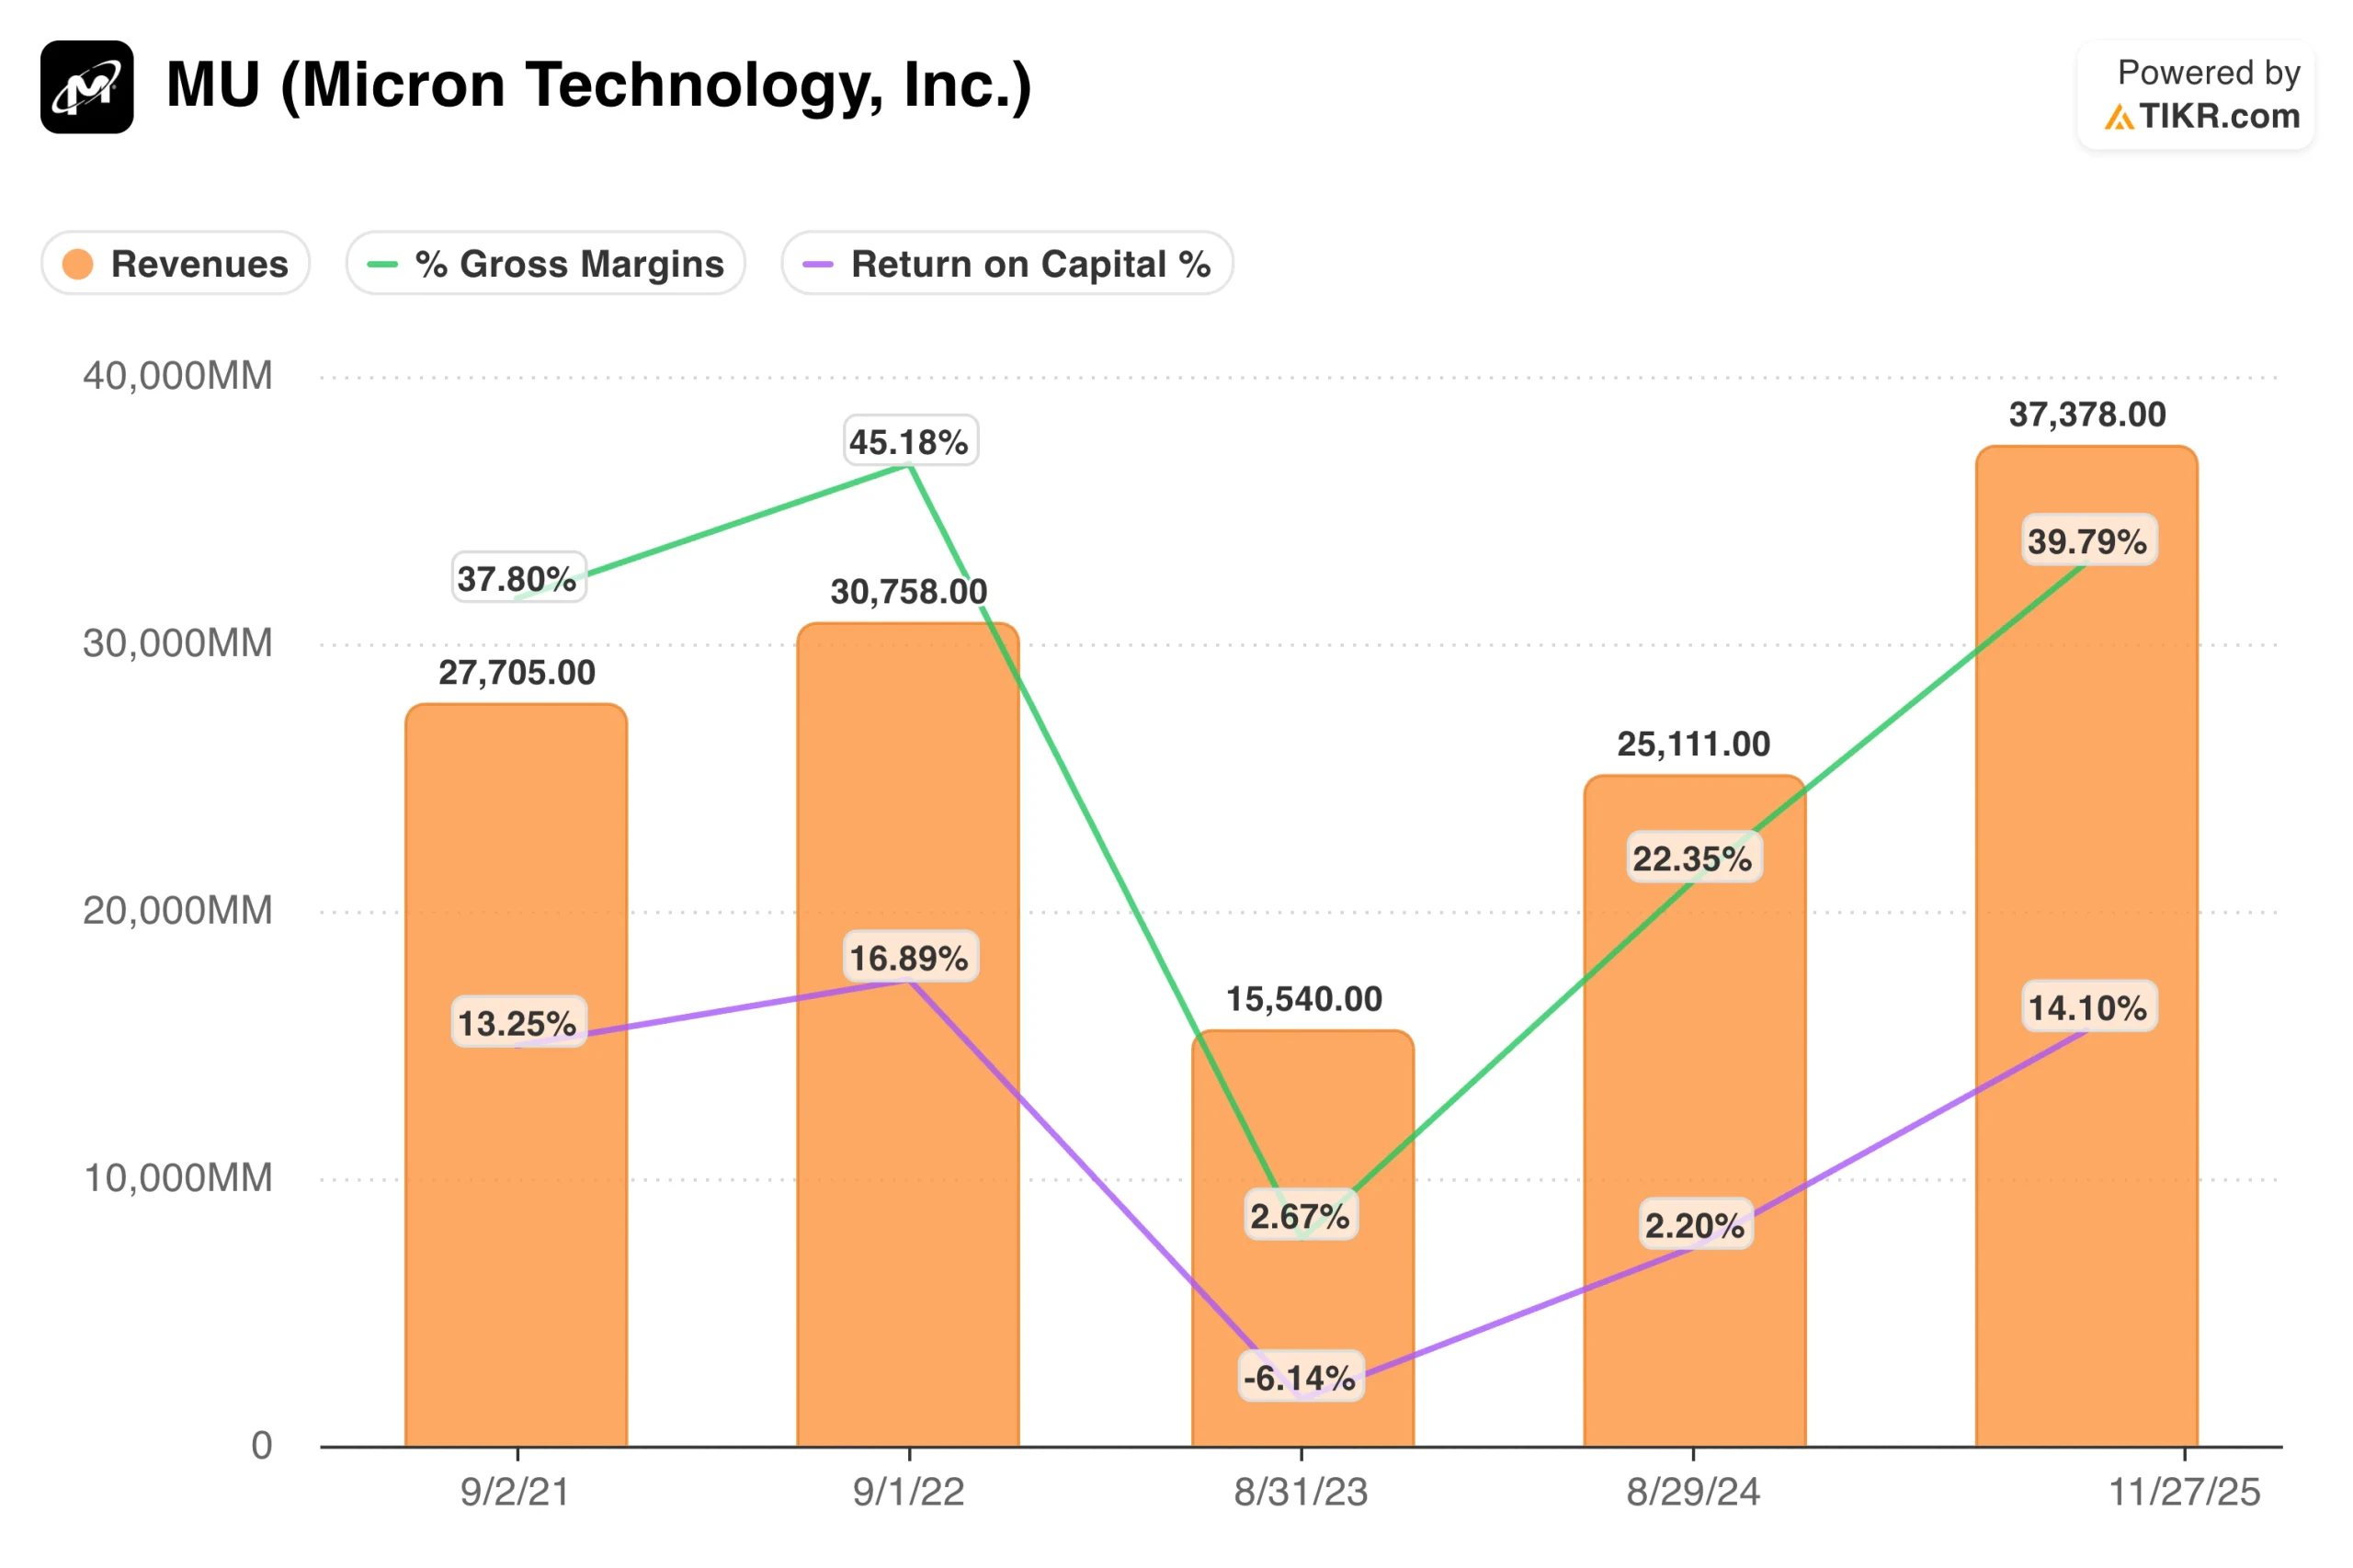
TIKR tip: Use TIKR’s Detailed Financials to track revenue growth, margins, and ROC alongside your market share analysis. Connecting share trends to financial trends reveals whether competitive dynamics are improving or deteriorating.
Build your own screener to find stocks with solid revenue and profitability (Free with TIKR) >>>
When Market Share Losses Are Acceptable
Not all market share losses indicate problems. Exiting unprofitable segments often involves deliberate share loss. A company might abandon low-margin product lines or price-sensitive customers to focus on more attractive opportunities. Look for whether revenue declines are offset by improved margins and returns in the remaining business.
Disciplined pricing sometimes costs share but improves economics. A company that refuses to match irrational competitor pricing will lose volume but preserve margins. Temporary share loss from pricing discipline differs fundamentally from share loss due to competitive inferiority.
The quality of the remaining shares matters more than the quantity. A company that has lost commodity business while retaining premium customers may have a stronger competitive position despite a lower reported share.
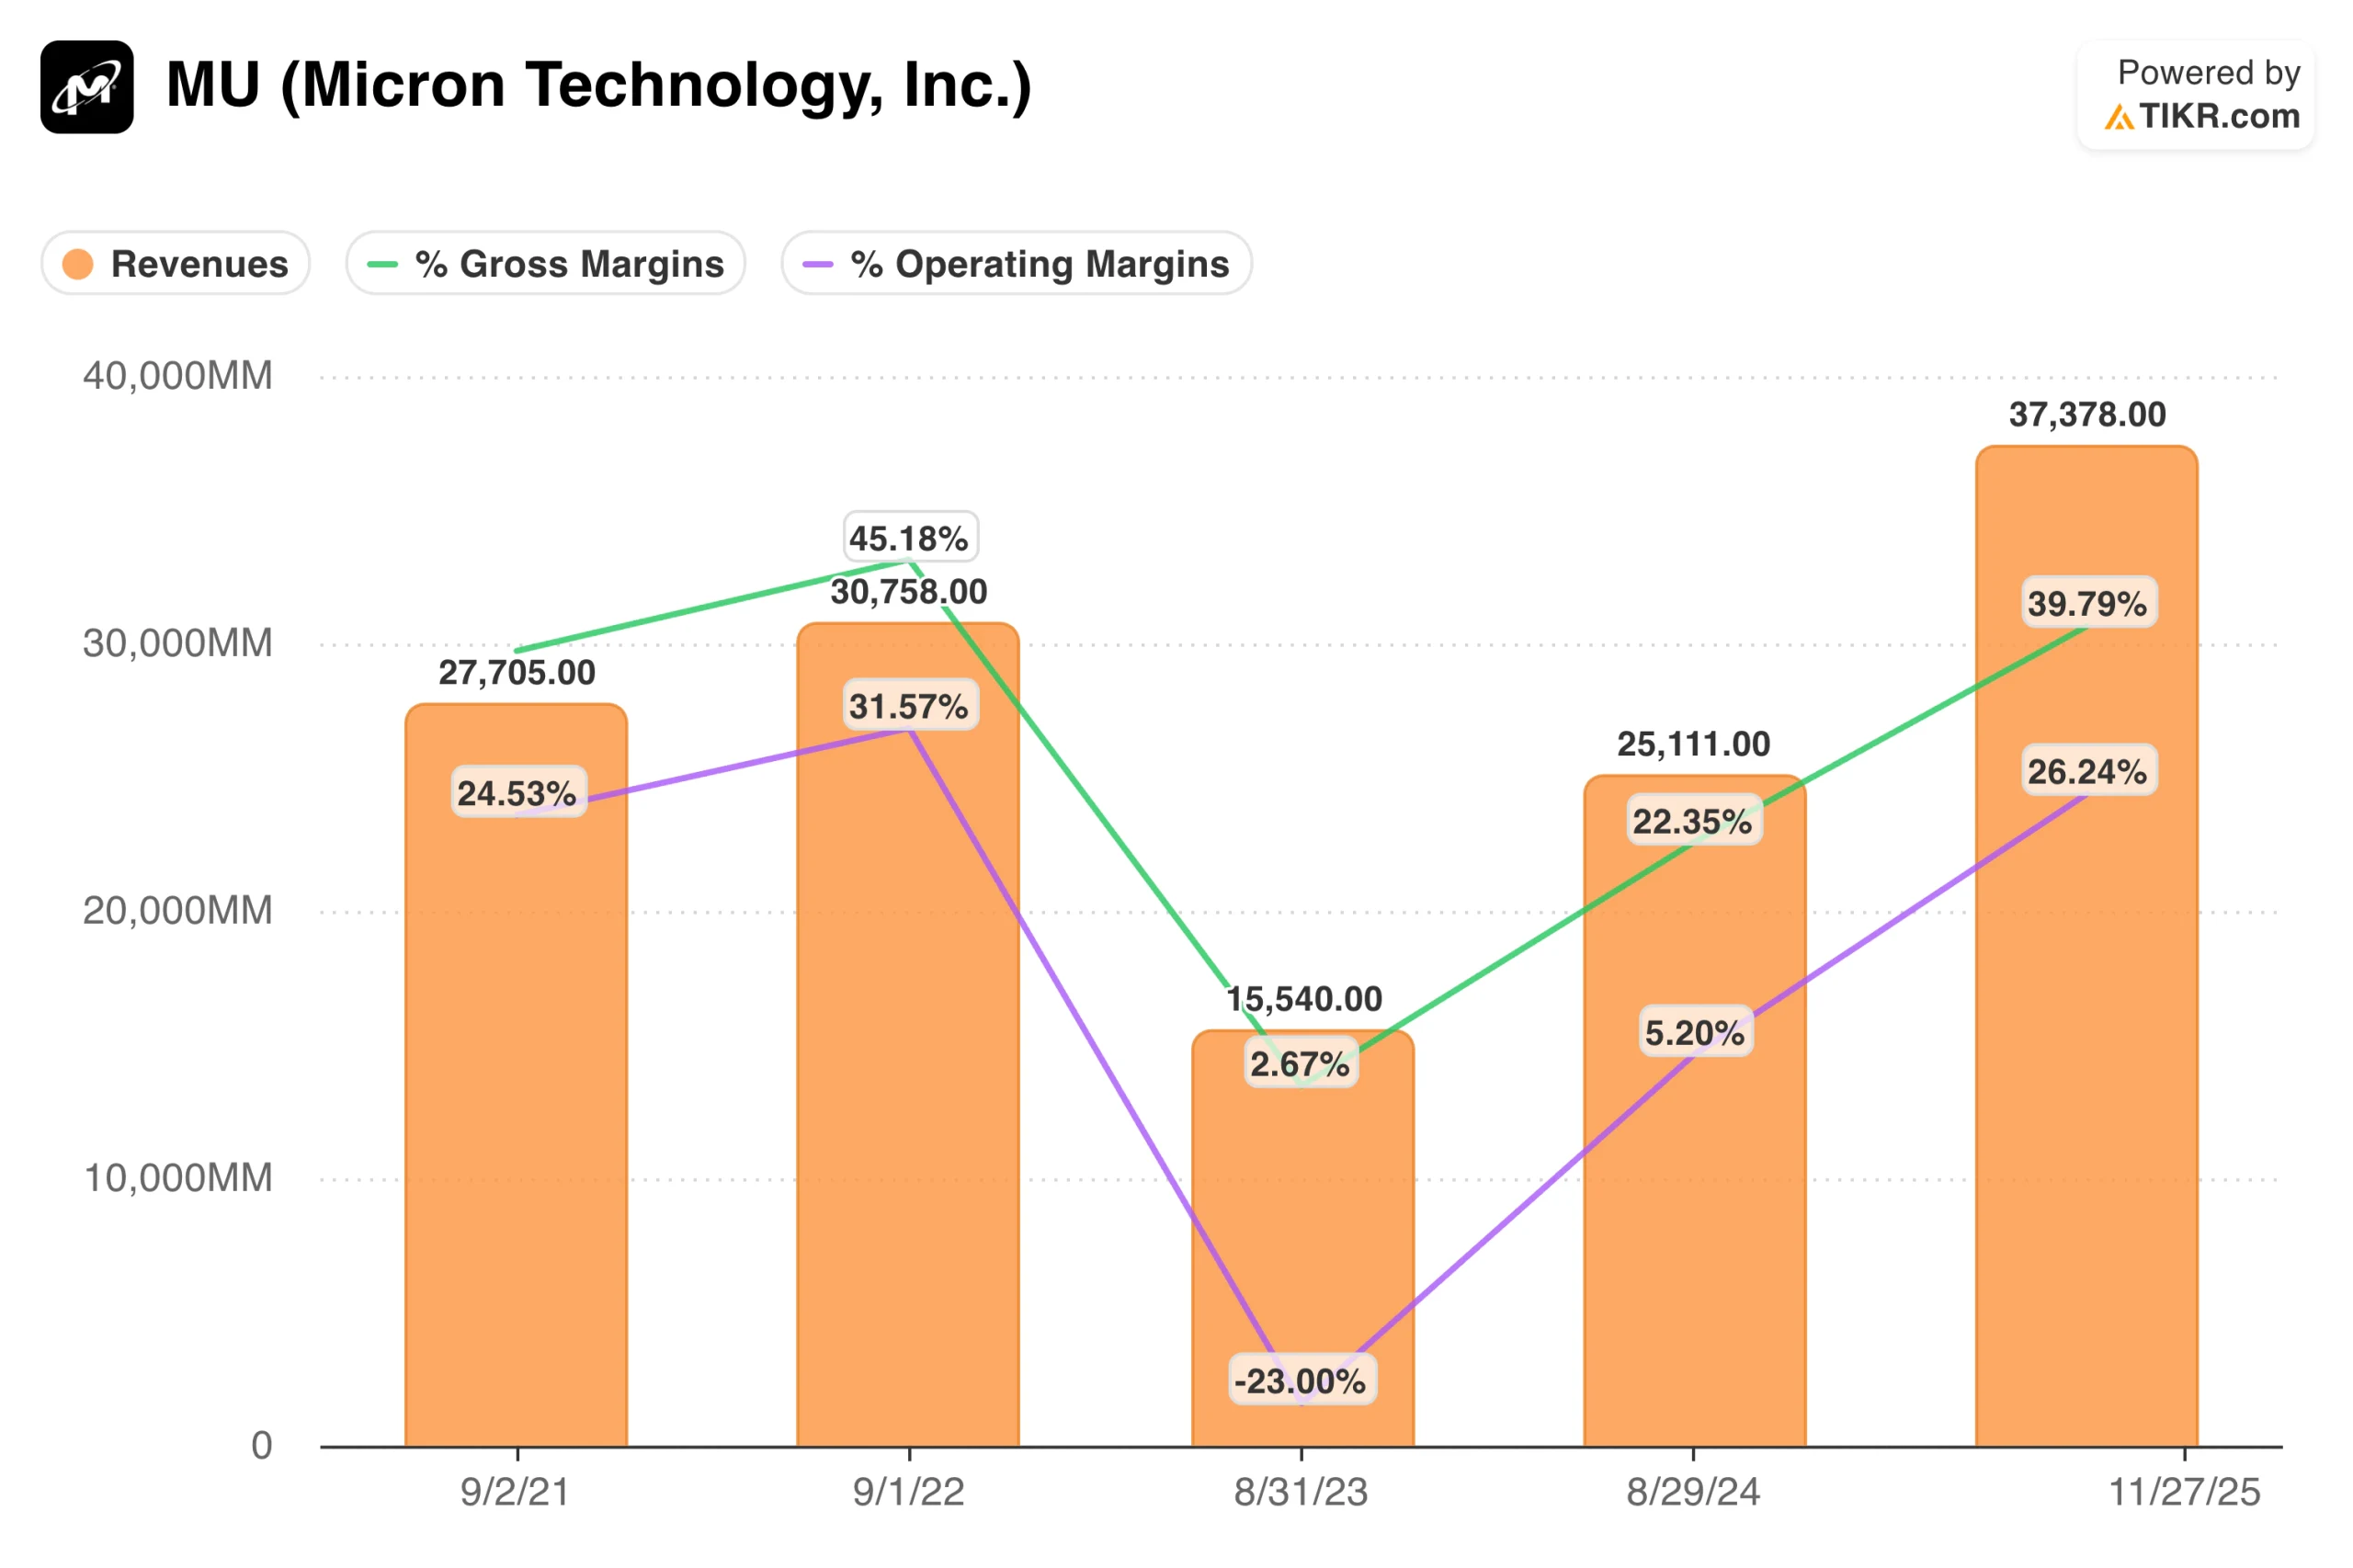
TIKR tip: When a company shows declining revenue but improving margins and ROC in TIKR’s Detailed Financials, examine whether management is deliberately exiting low-quality business rather than losing ground competitively.
Look for improving margins on TIKR for the top stocks in your portfolio (It’s free) >>>
The TIKR Takeaway
Market share analysis reveals competitive dynamics that financial statements alone cannot capture. A company gaining market share demonstrates that customers prefer its offering, a strength that typically improves financial performance. One losing share is falling behind in ways that eventually show up as margin pressure and weakening returns.
TIKR makes this analysis practical by consolidating competitor financials on a single platform. You can track revenue across an industry, identify which players are gaining or losing ground, and connect share trends to the financial metrics that drive long-term stock performance.
Find undervalued stocks in less than 60 seconds with TIKR’s new Valuation Model (It’s free) >>>
Value Any Stock in Under 60 Seconds with TIKR
With TIKR’s new Valuation Model tool, you can estimate a stock’s potential share price in under a minute.
All it takes is three simple inputs:
- Revenue Growth
- Operating Margins
- Exit P/E Multiple
If you’re not sure what to enter, TIKR automatically fills in each input using analysts’ consensus estimates, giving you a quick, reliable starting point.
From there, TIKR calculates the potential share price and total returns under Bull, Base, and Bear scenarios so you can quickly see whether a stock looks undervalued or overvalued.
See a stock’s true value in under 60 seconds (Free with TIKR) >>>
Looking for New Opportunities?
- Discover which stocks billionaire investors are purchasing, so you can follow the smart money.
- Analyze stocks in as little as 5 minutes with TIKR’s all-in-one, easy-to-use platform.
- The more rocks you overturn… the more opportunities you’ll uncover. Search 100K+ global stocks, global top investor holdings, and more with TIKR.
Disclaimer:
Please note that the articles on TIKR are not intended to serve as investment or financial advice from TIKR or our content team, nor are they recommendations to buy or sell any stocks. We create our content based on TIKR Terminal’s investment data and analysts’ estimates. Our analysis might not include recent company news or important updates. TIKR has no position in any stocks mentioned. Thank you for reading, and happy investing!