Key Fundamental Metrics for MA Stock
- 52-Week Range: $480.50 to $601.77
- Current Stock Price: $493.98
- Street Consensus Target Price: ~$647
- LTM EBIT Margin: 59.5%
- LTM Net Debt / EBITDA: 0.50x
- LTM ROE: 232.1%
- Fwd 2-Year EPS CAGR: ~16%
- Mid-Case 10-Year Forward Stock Price Target: ~$895
Now Live: Discover how much upside your favorite stocks could have using TIKR’s new Valuation Model (It’s free) >>>
A World-Class Business Trading Near Its Lows for Reasons That Have Little to Do With the Business
Mastercard (MA) operates one of the most structurally advantaged businesses in global finance, collecting fees on every transaction that crosses its network in 220 countries without taking on credit risk, holding deposits, or owning a single physical asset that could depreciate.
That model produces a 59% operating margin, a 232% return on equity, and five consecutive years of 16% or better annual revenue growth. Against that backdrop, the stock is sitting near a 52-week low.
Overall, Q1 2026 net revenue came in at $8.4 billion, up 16% year over year, with adjusted EPS of $4.60, up 21% from the same quarter in 2025. Value-added services and solutions, the higher-margin segment covering cybersecurity, fraud detection, and data analytics, grew 22% year over year and now account for roughly 40% of total revenue.
The stock’s weakness reflects broader consumer spending anxiety, cross-border travel concerns in certain geographies, and multiple compressions across the payments sector. None of those concerns has shown up in the actual results.
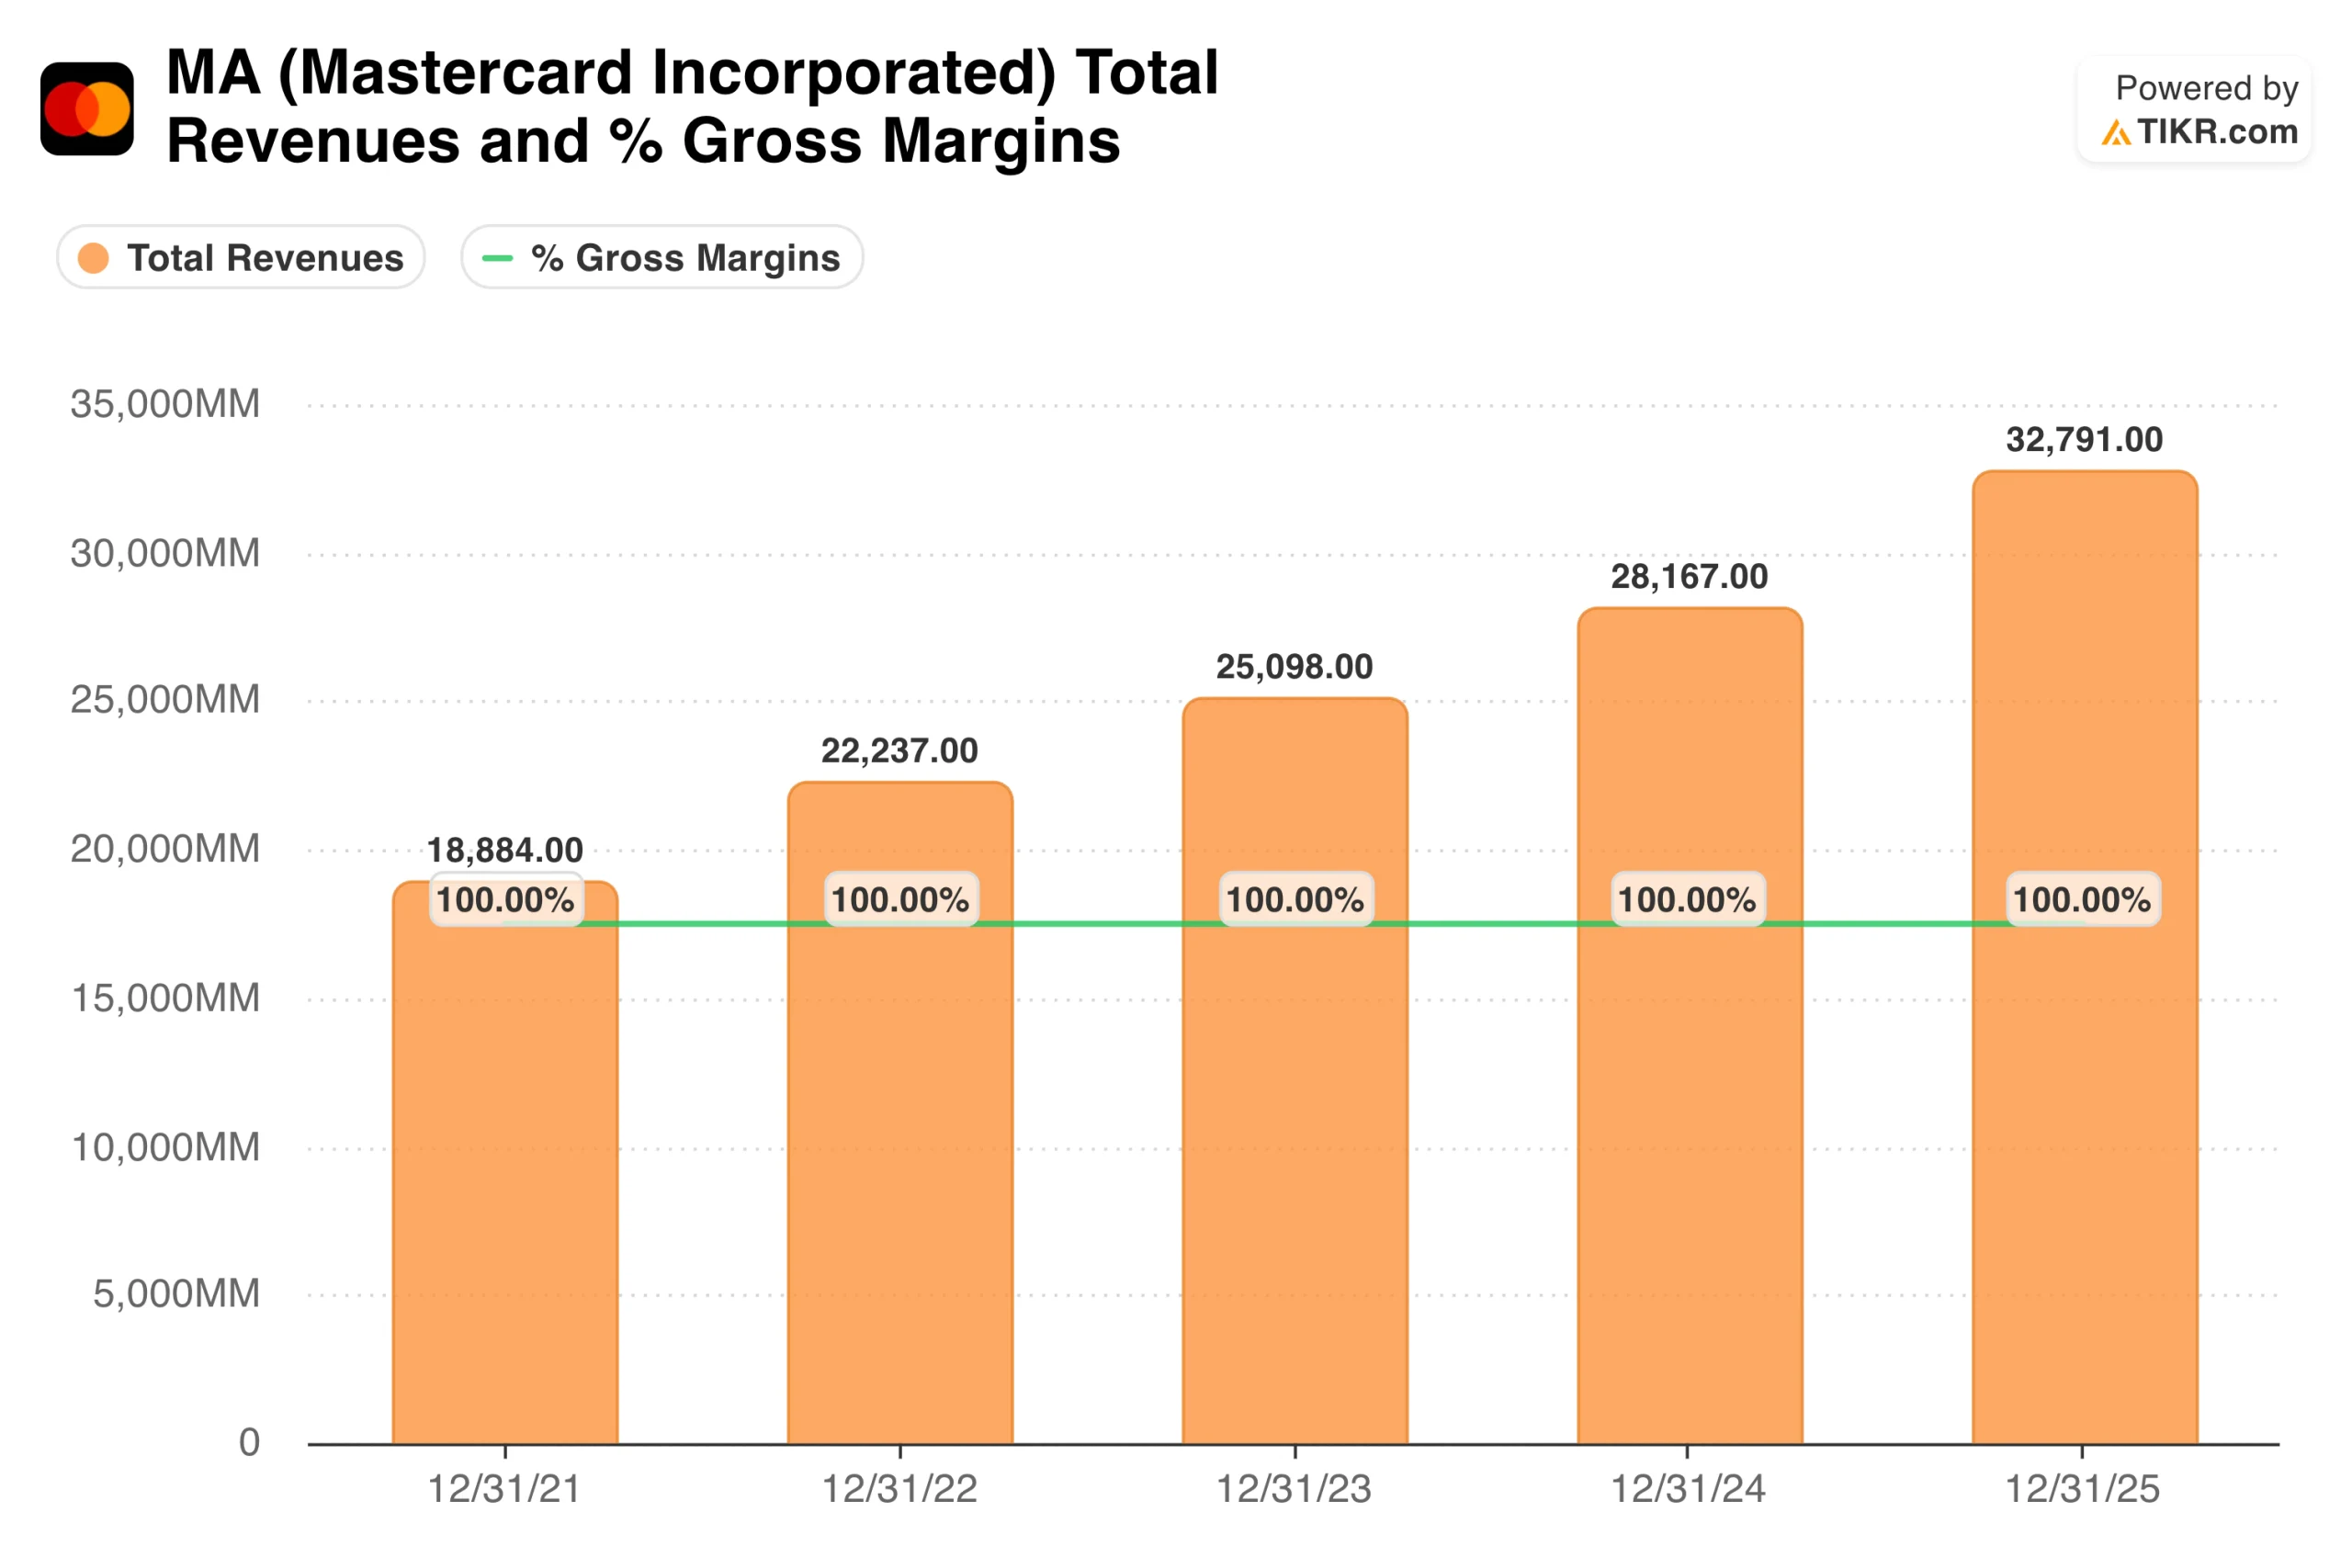
Company revenue has compounded from $18.9 billion in 2021 to $32.8 billion in 2025 in a remarkably straight line, with no down years, no cyclical disruptions, and no meaningful deceleration.
That kind of consistency across a period that included inflation, rate shocks, and geopolitical disruption is the clearest evidence available of the network’s structural durability. The Q1 2026 annualized run rate of $33.6 billion suggests 2026 will extend that streak.
See historical and forward estimates for Mastercard stock (It’s free!) >>>
The Network Nobody Can Replicate: How Mastercard Earns a 59% Operating Margin
It’s worth remembering that Mastercard does not lend money, hold deposits, or take on credit risk. Instead, it operates a global switching network connecting 3.4 billion cardholders to over 100 million merchant locations in more than 220 countries and territories, collecting a small fee on every transaction that crosses its rails.
The marginal cost of processing one more transaction is essentially zero, which is why operating margins are 59.5% and return on equity exceeds 230%.
That network is extraordinarily difficult to replicate. Building the merchant acceptance infrastructure, issuer relationships, fraud detection capabilities, and regulatory approvals across 220 countries took decades and hundreds of billions of dollars in investment.
New entrants face those barriers simultaneously, which is why Mastercard and Visa have maintained their duopoly through every attempt at disruption, including PayPal, Apple Pay, and the current wave of real-time payment rails.
The value-added services layer is how Mastercard is widening that moat. Security and fraud solutions, identity verification, open banking, and data analytics are all growing faster than the core transaction business and carry higher margins.
CEO Michael Miebach has described agentic commerce and stablecoins as the next growth vectors, with Mastercard positioned as the trust and security layer sitting beneath both.
The company recently signed a stablecoin partnership with SoFi and became a Charter-level member of the Blockchain Security Standards Council, signaling early-stage positioning rather than speculative bets.
From $8 to $33 Per Share: The EPS Compounding Record That Anchors the Valuation Case
The EPS chart is one of the most consistently upward-sloping in large-cap financials. Normalized EPS grew from $8.40 in 2021 to $17.01 in 2025, compounding at around 17% annually across a period of genuine macroeconomic stress.

The consensus now projects around $19.65 for 2026, climbing toward $22.75 in 2027 and reaching $33 by 2030. Management guided a mid-teens EPS CAGR over the next three years at its most recent investor day, which aligns closely with the Chartis projection.
The mechanism behind that compounding is worth understanding. Mastercard grows revenue by expanding the volume of electronic transactions running across its network, improving the mix toward higher-fee cross-border and commercial payments, and layering on services revenue.
Buybacks then amplify the per-share earnings growth, with shares outstanding declining steadily from 912 million in Q1 2025 to 893 million in Q1 2026. The combination of operating leverage, a shift in the services mix, and capital returns produces 17% EPS growth for a business that is growing revenue at 16%.
Analyze how Mastercard performs against its peers in TIKR (It’s free!) >>>
What the TIKR Valuation Model Says About MA at $494
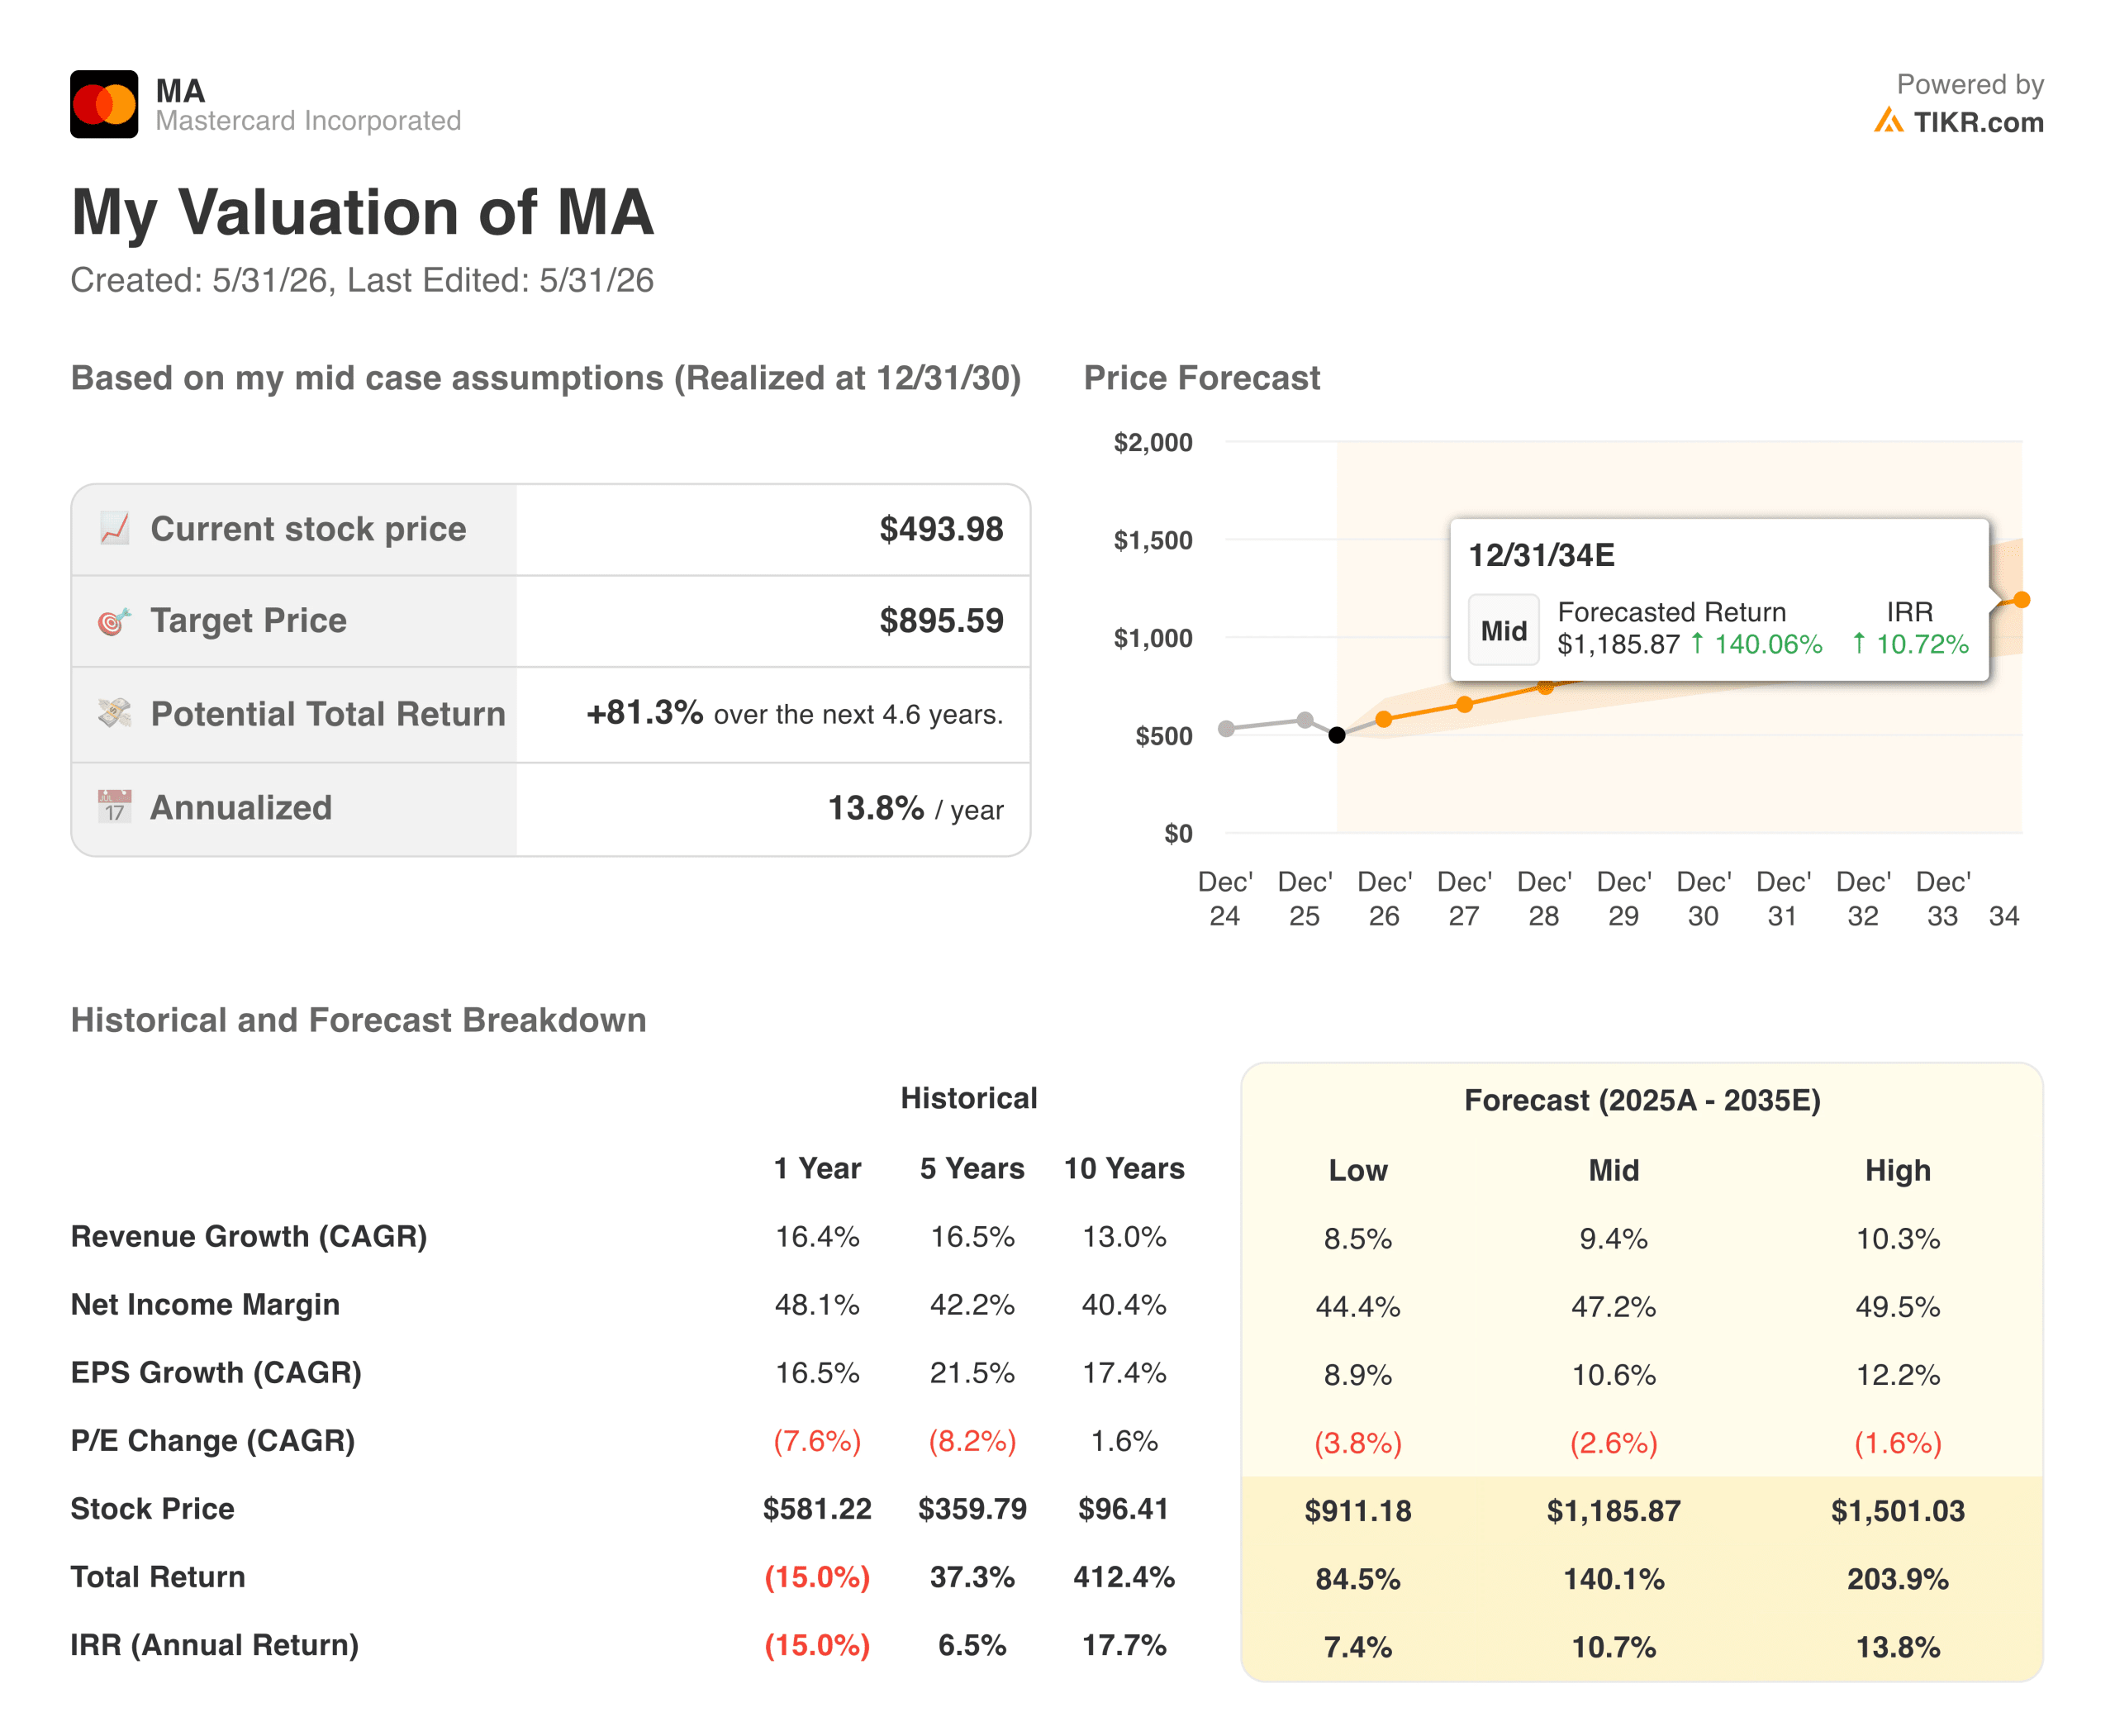
TIKR’s mid-case valuation model targets around $895 for MA, implying a total return of around 81% from the current price, or roughly 14% annualized over the next 4.6 years. The model assumes around 9% annual revenue growth and net income margins expanding to around 47%, with EPS growing at around 11% per year on a compounded basis.
Those assumptions are actually conservative relative to Mastercard’s recent track record. Revenue has grown at 16.5% annually over the past five years, and net income margins have expanded from around 40% to 48% over the same period.
The model is essentially asking whether Mastercard can sustain roughly half its recent growth rate while holding margins steady, which is a straightforward ask for a business with this competitive position.
The low case lands at around $910, marginally above the current price in the long run, and the high case reaches around $1,500. The wide scenario range reflects genuine uncertainty around regulatory outcomes, real-time payment rail adoption, and geopolitical impacts on cross-border volume.
The 0.7% dividend yield is modest, but the 18% payout ratio leaves enormous room for buybacks and dividend growth, and management has consistently used both levers to return capital.
Is MA Worth Buying at Today’s Levels?
At $494, Mastercard trades at around 24x forward earnings and sits about 18% below the Street’s consensus target of around $647. The stock is near its 52-week low despite a business delivering 16% revenue growth, 59% operating margins, and one of the most durable compounding records in any industry.
The primary risk is regulatory. Real-time payment rails in Europe, potential changes to debit routing in the United States, and antitrust scrutiny across multiple geographies are structural overhangs that the market periodically reprices. None of these are new concerns, and Mastercard has navigated regulatory pressure effectively for decades.
For investors with a multi-year horizon, the combination of a discounted entry price relative to both the Street target and the TIKR model’s mid-case, paired with a 14% annualized return projection, makes the current pullback one of the more compelling entry points the stock has offered in several years.
Review analysts’ growth forecasts and price targets for Mastercard stock (It’s free!) >>>
Looking for New Opportunities?
- See what stocks billionaire investors are buying so you can follow the smart money.
- Analyze stocks in as little as 5 minutes with TIKR’s all-in-one, easy-to-use platform.
- The more rocks you overturn… the more opportunities you’ll uncover. Search 100K+ global stocks, global top investor holdings, and more with TIKR.
Disclaimer:
Please note that the articles on TIKR are not intended to serve as investment or financial advice from TIKR or our content team, nor are they recommendations to buy or sell any stocks. We create our content based on TIKR Terminal’s investment data and analysts’ estimates. Our analysis might not include recent company news or important updates. TIKR has no position in any stocks mentioned. Thank you for reading, and happy investing!