Key Fundamental Metrics for CME Stock
- 52-Week Range: $257.17 to $329.16
- Current Stock Price: $277.42
- Street Consensus Target Price: ~$306
- LTM Gross Margin: 100%
- LTM EBIT Margin: 66.1%
- LTM Net Debt / EBITDA: 0.25x
- Dividend Yield: 4.4%
- Mid-Case 10-Year Forward Stock Price Target: ~$410
Find out what a stock’s really worth in under 60 seconds with TIKR’s new Valuation Model (It’s free) >>>
A Toll Road on Global Uncertainty: Why CME Earns More When Markets Get Nervous
CME Group (CME) operates the world’s largest derivatives marketplace, running exchanges where institutions, corporations, and governments trade futures and options on interest rates, equity indexes, energy, metals, agriculture, and foreign exchange. Every time a pension fund hedges its bond portfolio, an airline locks in fuel costs, or a bank manages its rate exposure, there is a high probability that trade flows through CME’s pipes.
That business model produced record Q1 2026 results, with revenue reaching $1.88 billion, up 14% year over year. Adjusted EPS came in at $3.36, beating consensus estimates. Average daily volume hit an all-time record of 36.2 million contracts, up 22%, with non-US volume growing 30%. The stock dropped 3% on the day anyway, a reaction driven more by profit-taking after a strong run than any fundamental concern with the results.
At $277, CME sits about 16% below its 52-week high and near the bottom of its trading range, despite a business compounding earnings in the double digits and carrying a nearly pristine balance sheet.
Estimate a company’s fair value instantly (Free with TIKR) >>>
9 Product Lines, 1 Common Thread: Volatility Pays
The segment table above reveals something important about how CME actually makes money. Interest rates are the dominant product line at $1.7 billion in annual revenue, reflecting the outsized demand for rate hedging in an environment where central bank policy has been the defining variable for global markets. Equity indexes contributed $1.2 billion, energy $813 million, and agricultural commodities $658 million, with metals growing quickly from $199 million in 2021 to $355 million in 2025.
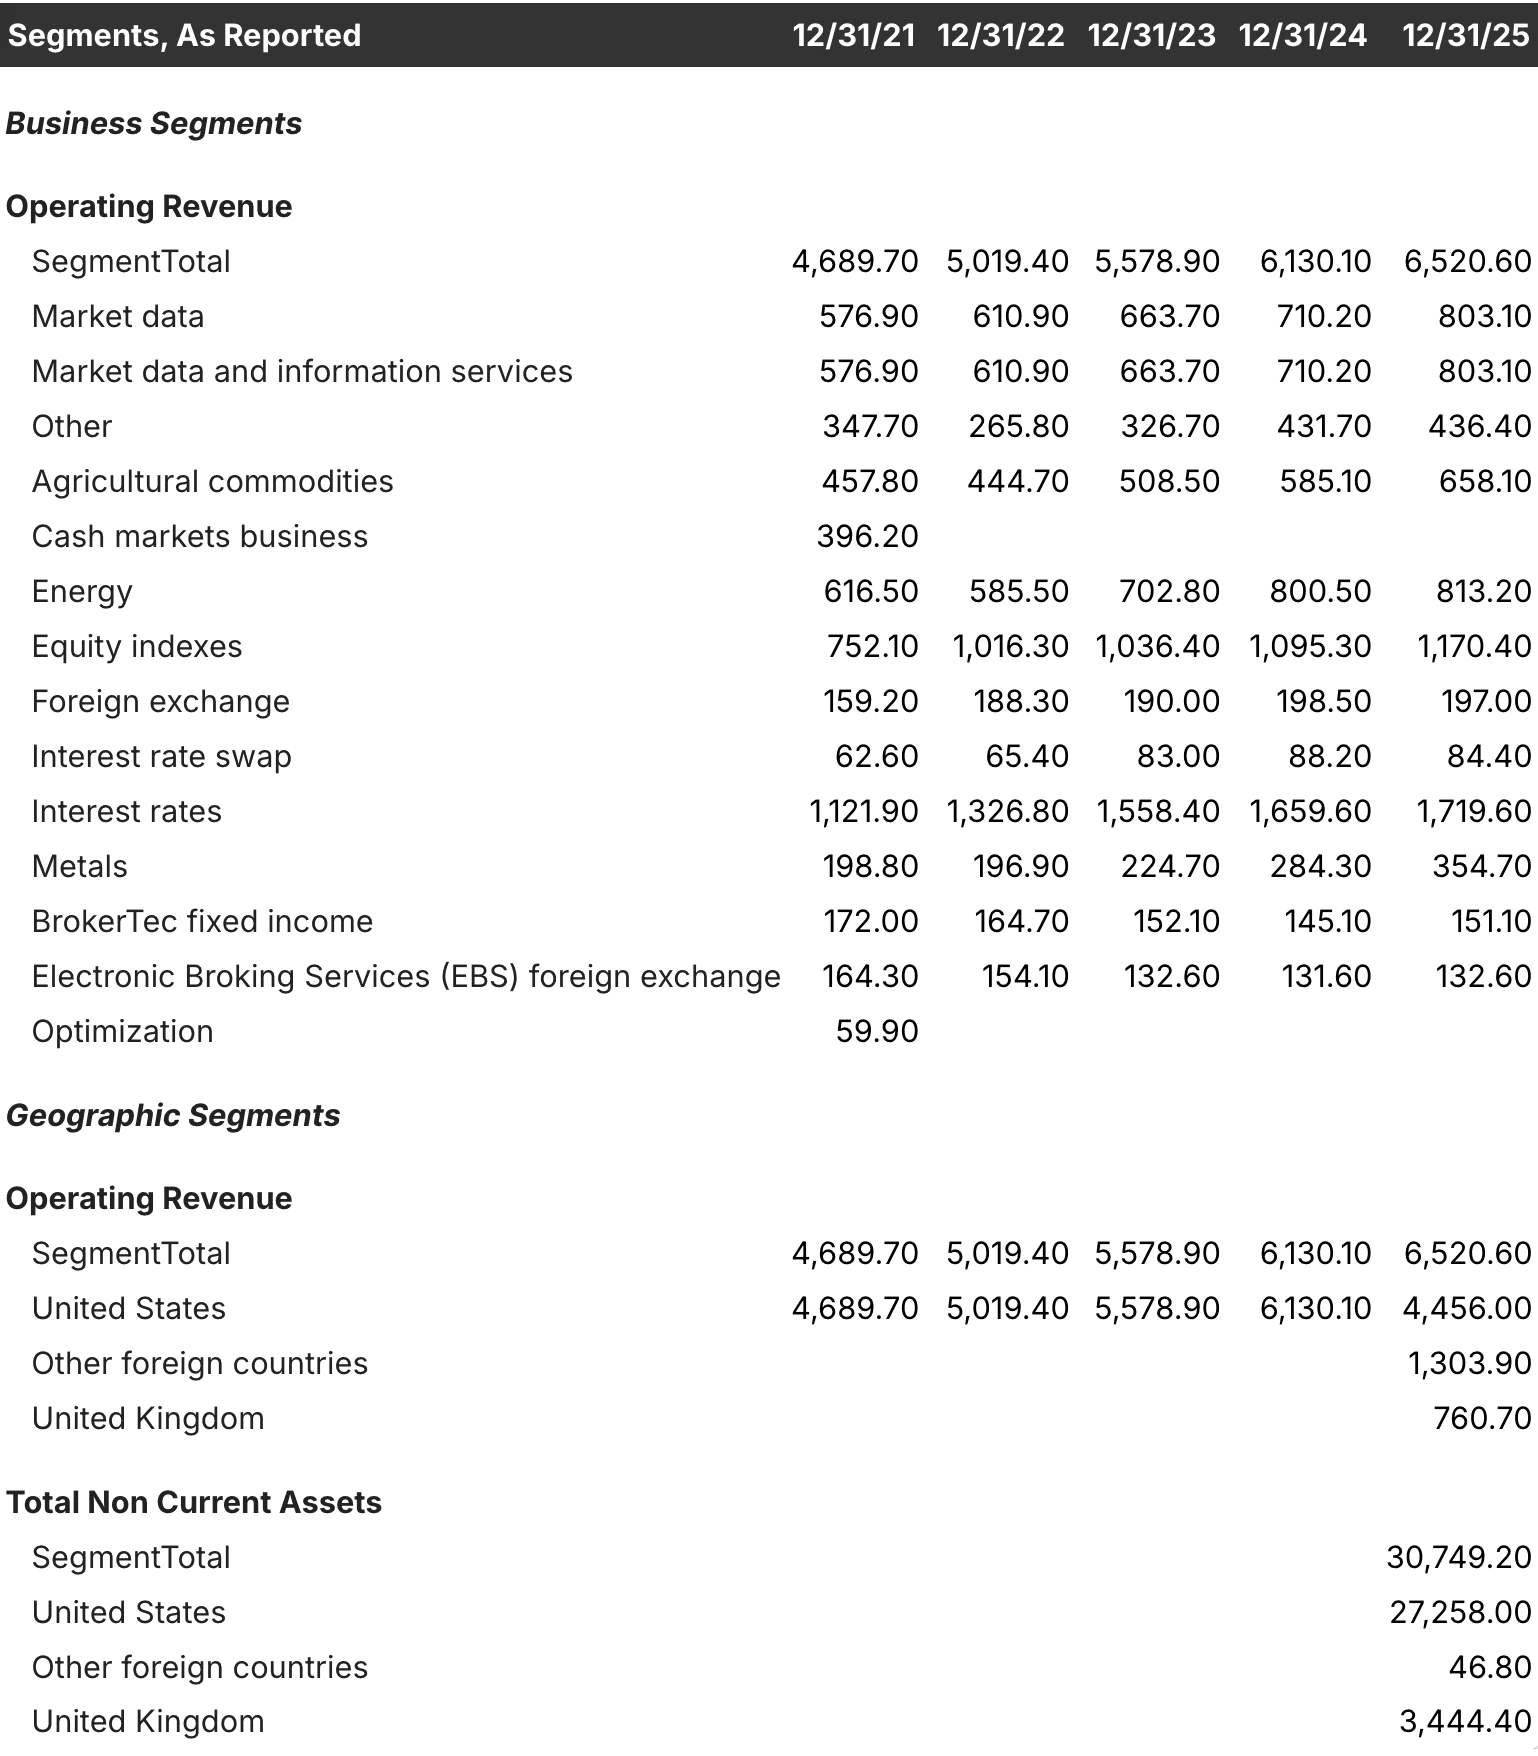
Market data and information services added $803 million in 2025, up from $577 million in 2021, and this line deserves particular attention. Unlike clearing and transaction fees, which fluctuate with trading volumes, market data revenue is largely subscription-based and grows at a predictable rate. CME raised its market data rack rate by 3.5% for 2026, adding a recurring revenue layer that cushions earnings in quieter periods.
The crypto segment, while not broken out separately in the table, is becoming a meaningful contributor. CME reported a 106% increase in crypto average daily volume in Q4 2025, and management has announced plans for 24/7 crypto trading. Event contracts, a new product line that lets participants trade binary outcomes on economic data releases, drew 68 million contracts in just six weeks after launch.
See what analysts think about CME stock right now (Free with TIKR) >>>
The Margin Machine: How CME Turns Revenue Into Profit at a Rate Few Businesses Can Match
The chart above captures what makes CME genuinely unusual among financial companies. Operating income has grown from $2.6 billion in 2021 to $4.3 billion in 2025, and operating margins have expanded from 56% to 65% over the same period. That combination of growing absolute profit and expanding margins reflects a business with enormous operating leverage, where incremental revenue translates into bottom-line gains at a very high rate.
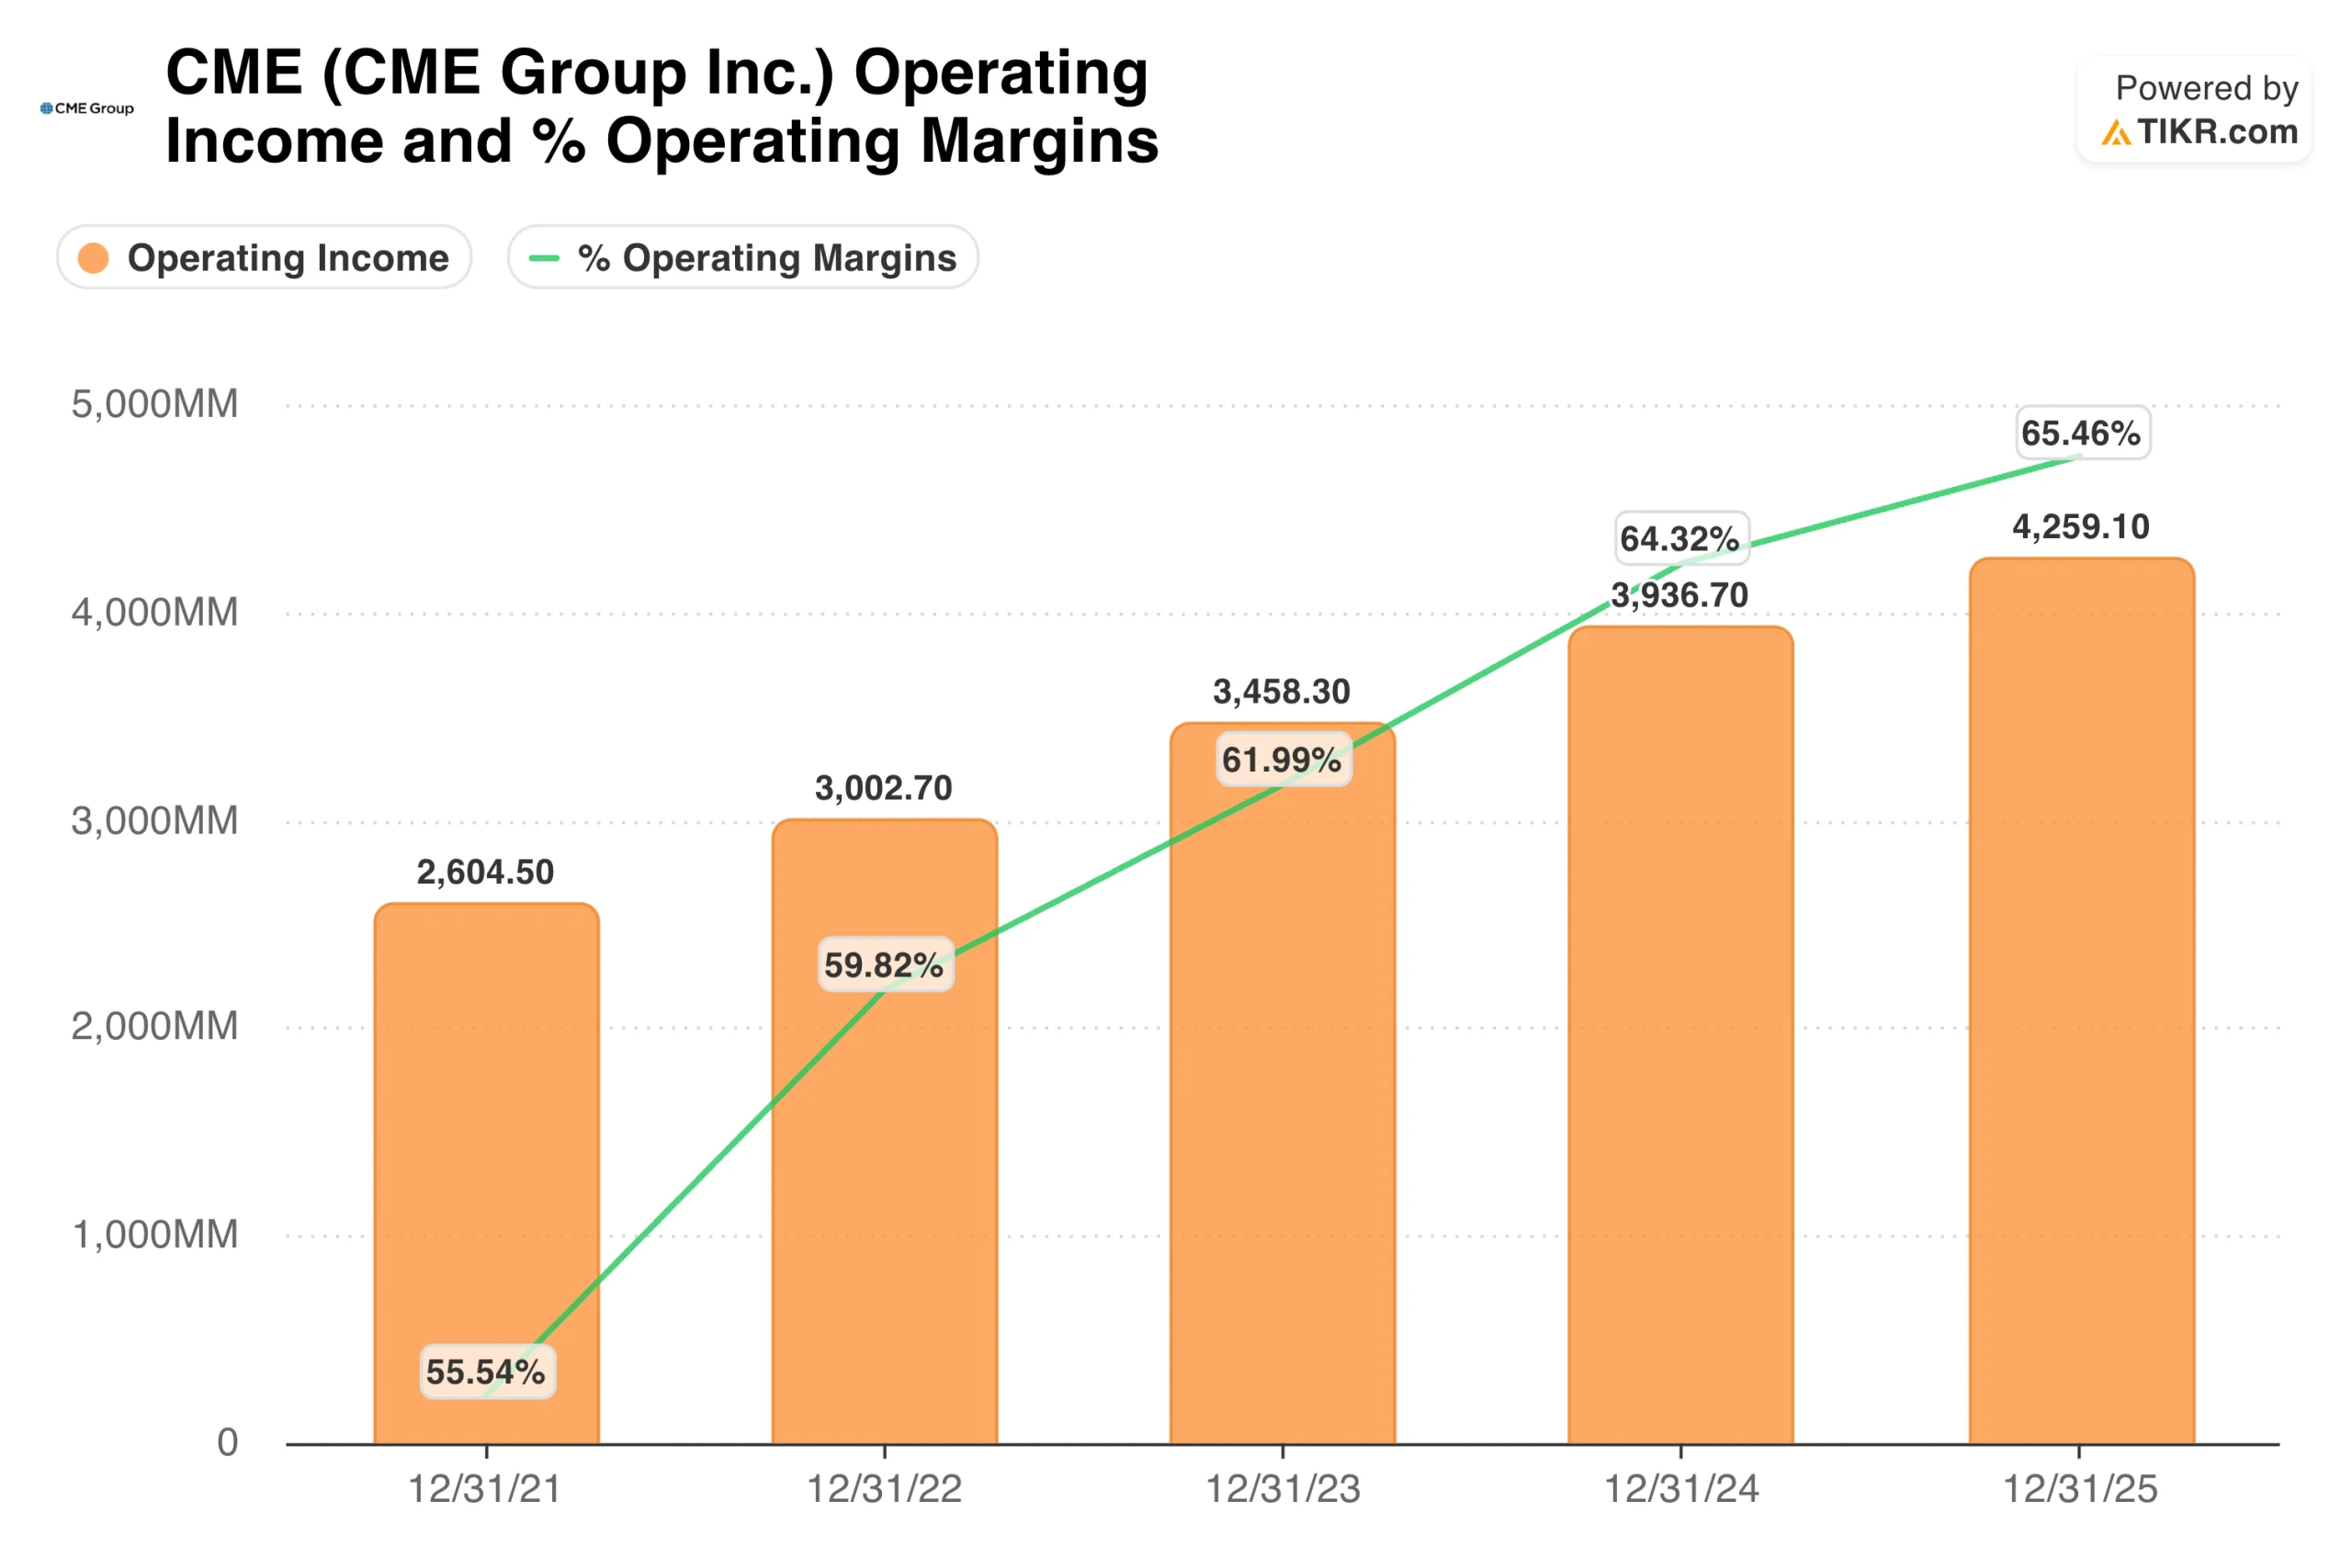
The reason is structural, as CME’s core cost base, the technology infrastructure, regulatory compliance, and clearing operations that run the exchange, do not scale proportionally with trading volumes. When volatility spikes and contract volumes surge, revenue goes up sharply while costs remain largely fixed. That is the toll road dynamic in its purest form.
Q1 2026 adjusted operating margin came in at 72.8%, the highest in the company’s history. The company returned $2.7 billion to shareholders in dividends during the quarter and repurchased $536 million of stock, all while maintaining net debt-to-EBITDA of just 0.25x.
What the TIKR Valuation Model Says About CME at $277
TIKR’s mid-case valuation model targets around $410 for CME, implying a total return of around 48% from the current price, or roughly 9% annualized over the next 4.6 years. The model assumes around 4% annual revenue growth and net income margins holding near 63%, with EPS growing at around 5% per year on a compounded basis.
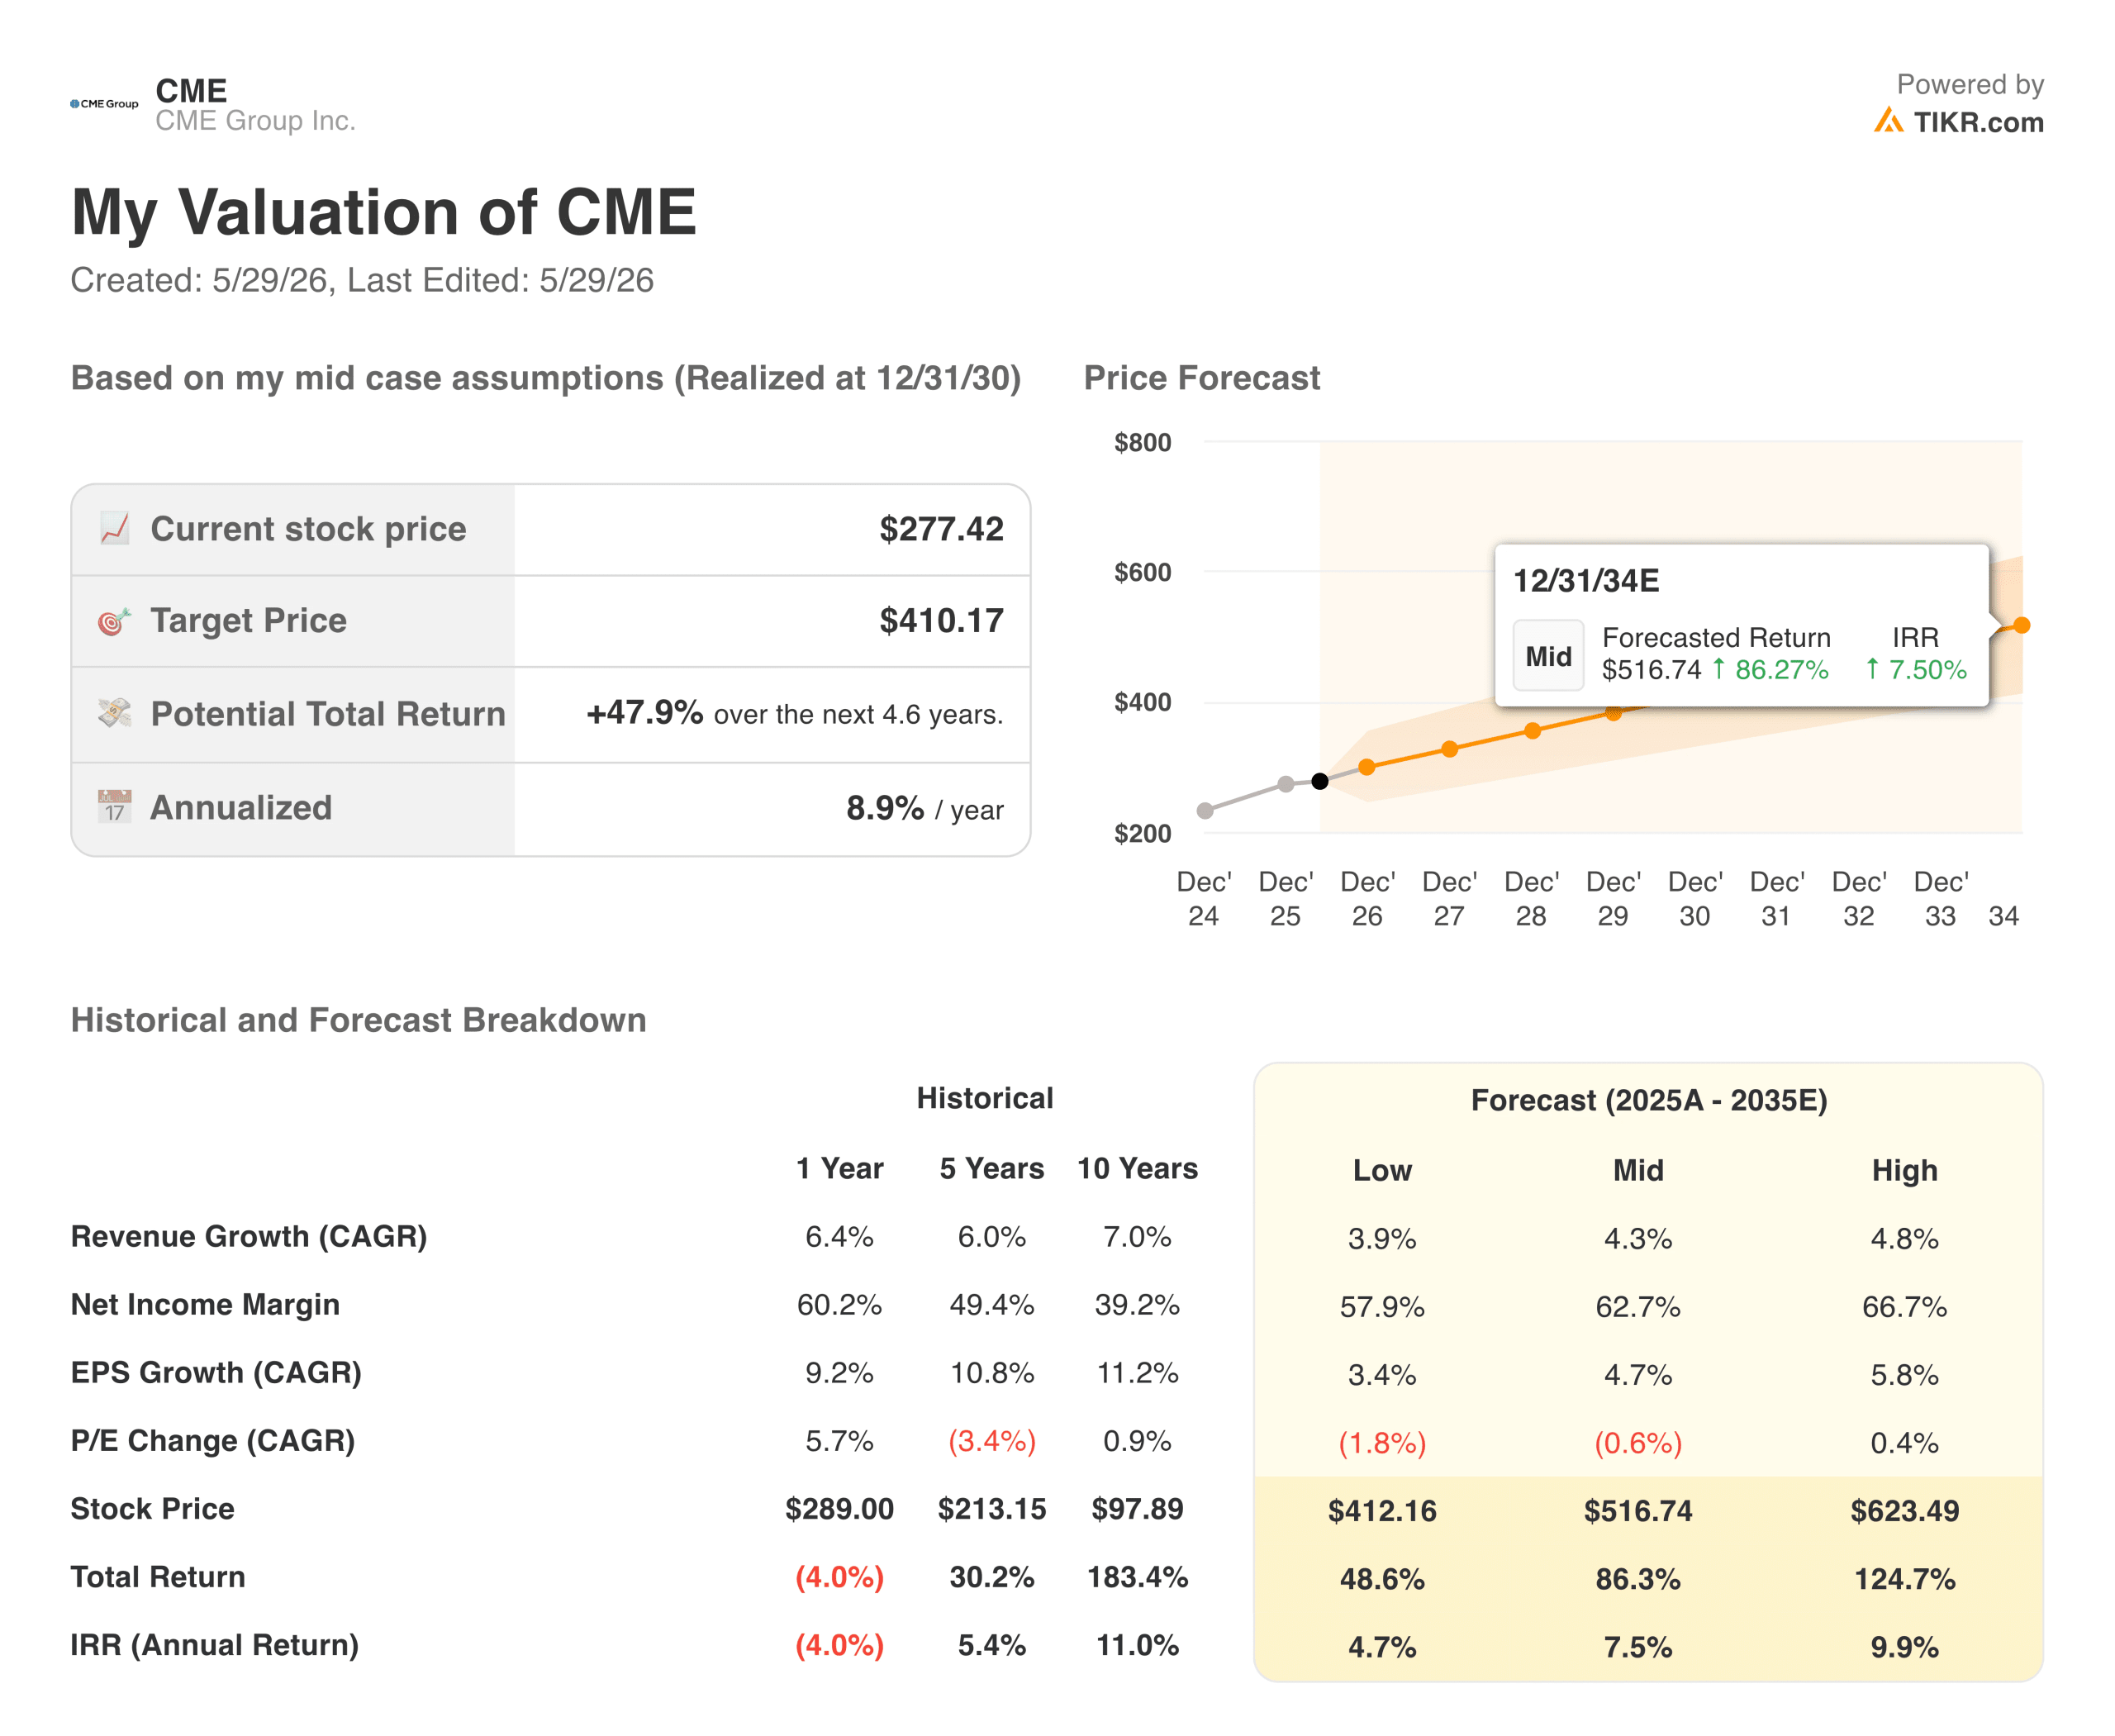
The low case is around $410, and the high case is around $625. The 4.4% dividend yield meaningfully adds to the total return picture over the holding period, making the annualized return more attractive than price appreciation alone would suggest.
The model’s revenue growth assumption of around 4% is conservative relative to CME’s last three-year CAGR of around 9%. It essentially assumes that the current elevated volatility environment normalizes, reducing the tailwind from record trading volumes.
Even under that conservative scenario, the combination of margin stability, dividend income, and modest earnings growth produces a compelling risk-adjusted return.
Is CME Worth Buying at Today’s Levels?
At $277, CME trades at around 23x trailing earnings and offers a 4.4% dividend yield, among the highest in the large-cap financial infrastructure space. The business just posted its best quarter on record and is entering a period in which geopolitical uncertainty, rate volatility, and crypto adoption are structural tailwinds rather than temporary ones.
The primary risk is a sustained decline in market volatility. If rates stabilize, geopolitical tensions ease, and trading volumes revert toward pre-2022 averages, CME’s revenue growth slows, and the multiple compresses. That scenario is possible, but it is also the scenario the market appears to be partially pricing in at the current level.
For investors looking for a high-quality financial infrastructure business with a durable dividend, a near-zero leverage balance sheet, and a valuation model pointing to around 9% annualized returns, CME at $277 is a straightforward case.
See analysts’ growth forecasts and price targets for CME Group (It’s free) >>>
Looking for New Opportunities?
- See what stocks billionaire investors are buying so you can follow the smart money.
- Analyze stocks in as little as 5 minutes with TIKR’s all-in-one, easy-to-use platform.
- The more rocks you overturn… the more opportunities you’ll uncover. Search 100K+ global stocks, global top investor holdings, and more with TIKR.
Disclaimer:
Please note that the articles on TIKR are not intended to serve as investment or financial advice from TIKR or our content team, nor are they recommendations to buy or sell any stocks. We create our content based on TIKR Terminal’s investment data and analysts’ estimates. Our analysis might not include recent company news or important updates. TIKR has no position in any stocks mentioned. Thank you for reading, and happy investing!