Key Stats for Uber Stock
- Current Price: $72.95
- Target Price (Mid): ~$187
- Street Target: ~$104
- Potential Total Return: ~157%
- Annualized IRR: ~22% / year
- Earnings Reaction (Q4 2025): +1.75% (February 4, 2026)
- Max Drawdown: -30.89% (March 27, 2026)
Now Live: Discover how much upside your favorite stocks could have using TIKR’s new Valuation Model (It’s free) >>>
What Happened?
Uber (UBER) stock has spent most of 2026 getting sold. After hitting a 52-week high of $101.99, shares fell to a max drawdown of 30.89% on March 27, 2026, before partially recovering to $72.95. Q1 2026 earnings land today, and the debate is sharper than ever. Bulls point to $9.8 billion in free cash flow generated in fiscal 2025 and an autonomous vehicle strategy already proving additive to trip volumes. Bears argue the multiple still prices in perfection and that a robotaxi-dominated future could structurally compress Uber’s take rate. The question the market is asking: Does the business under that 29% decline justify a re-rating?
Find out what Uber could be worth using TIKR’s free Valuation Model >>>
The Business Under the Selloff
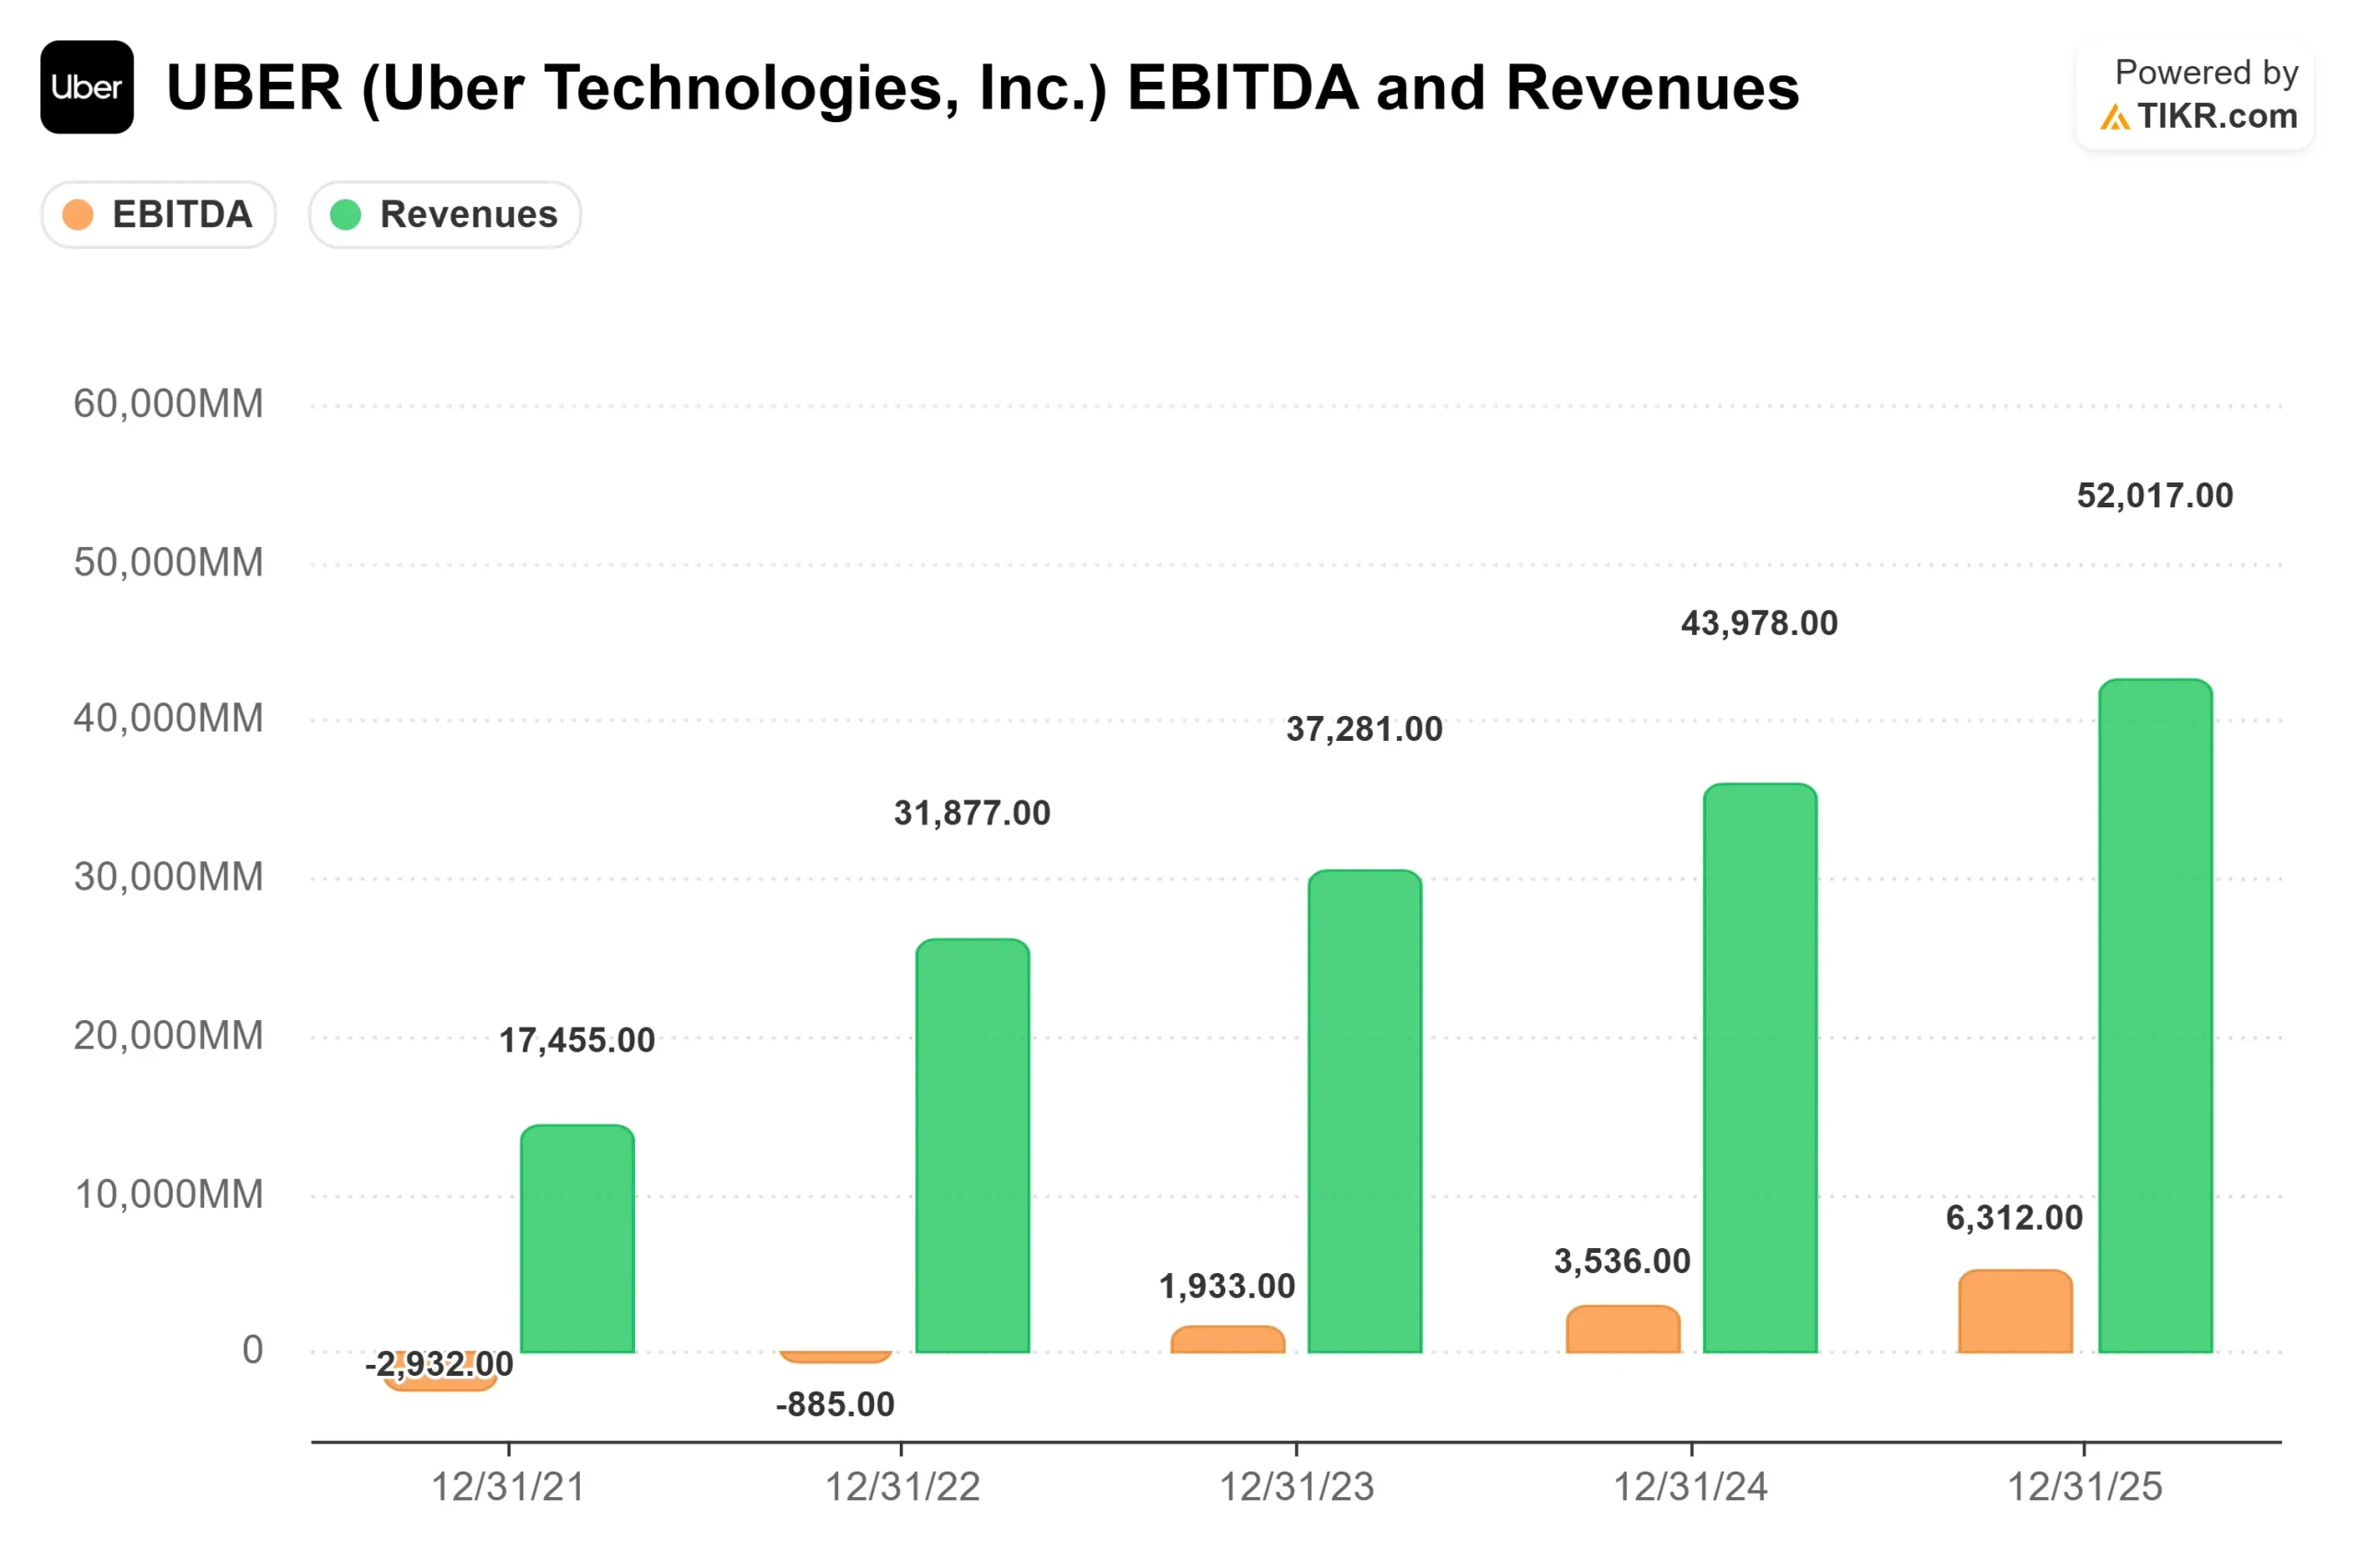
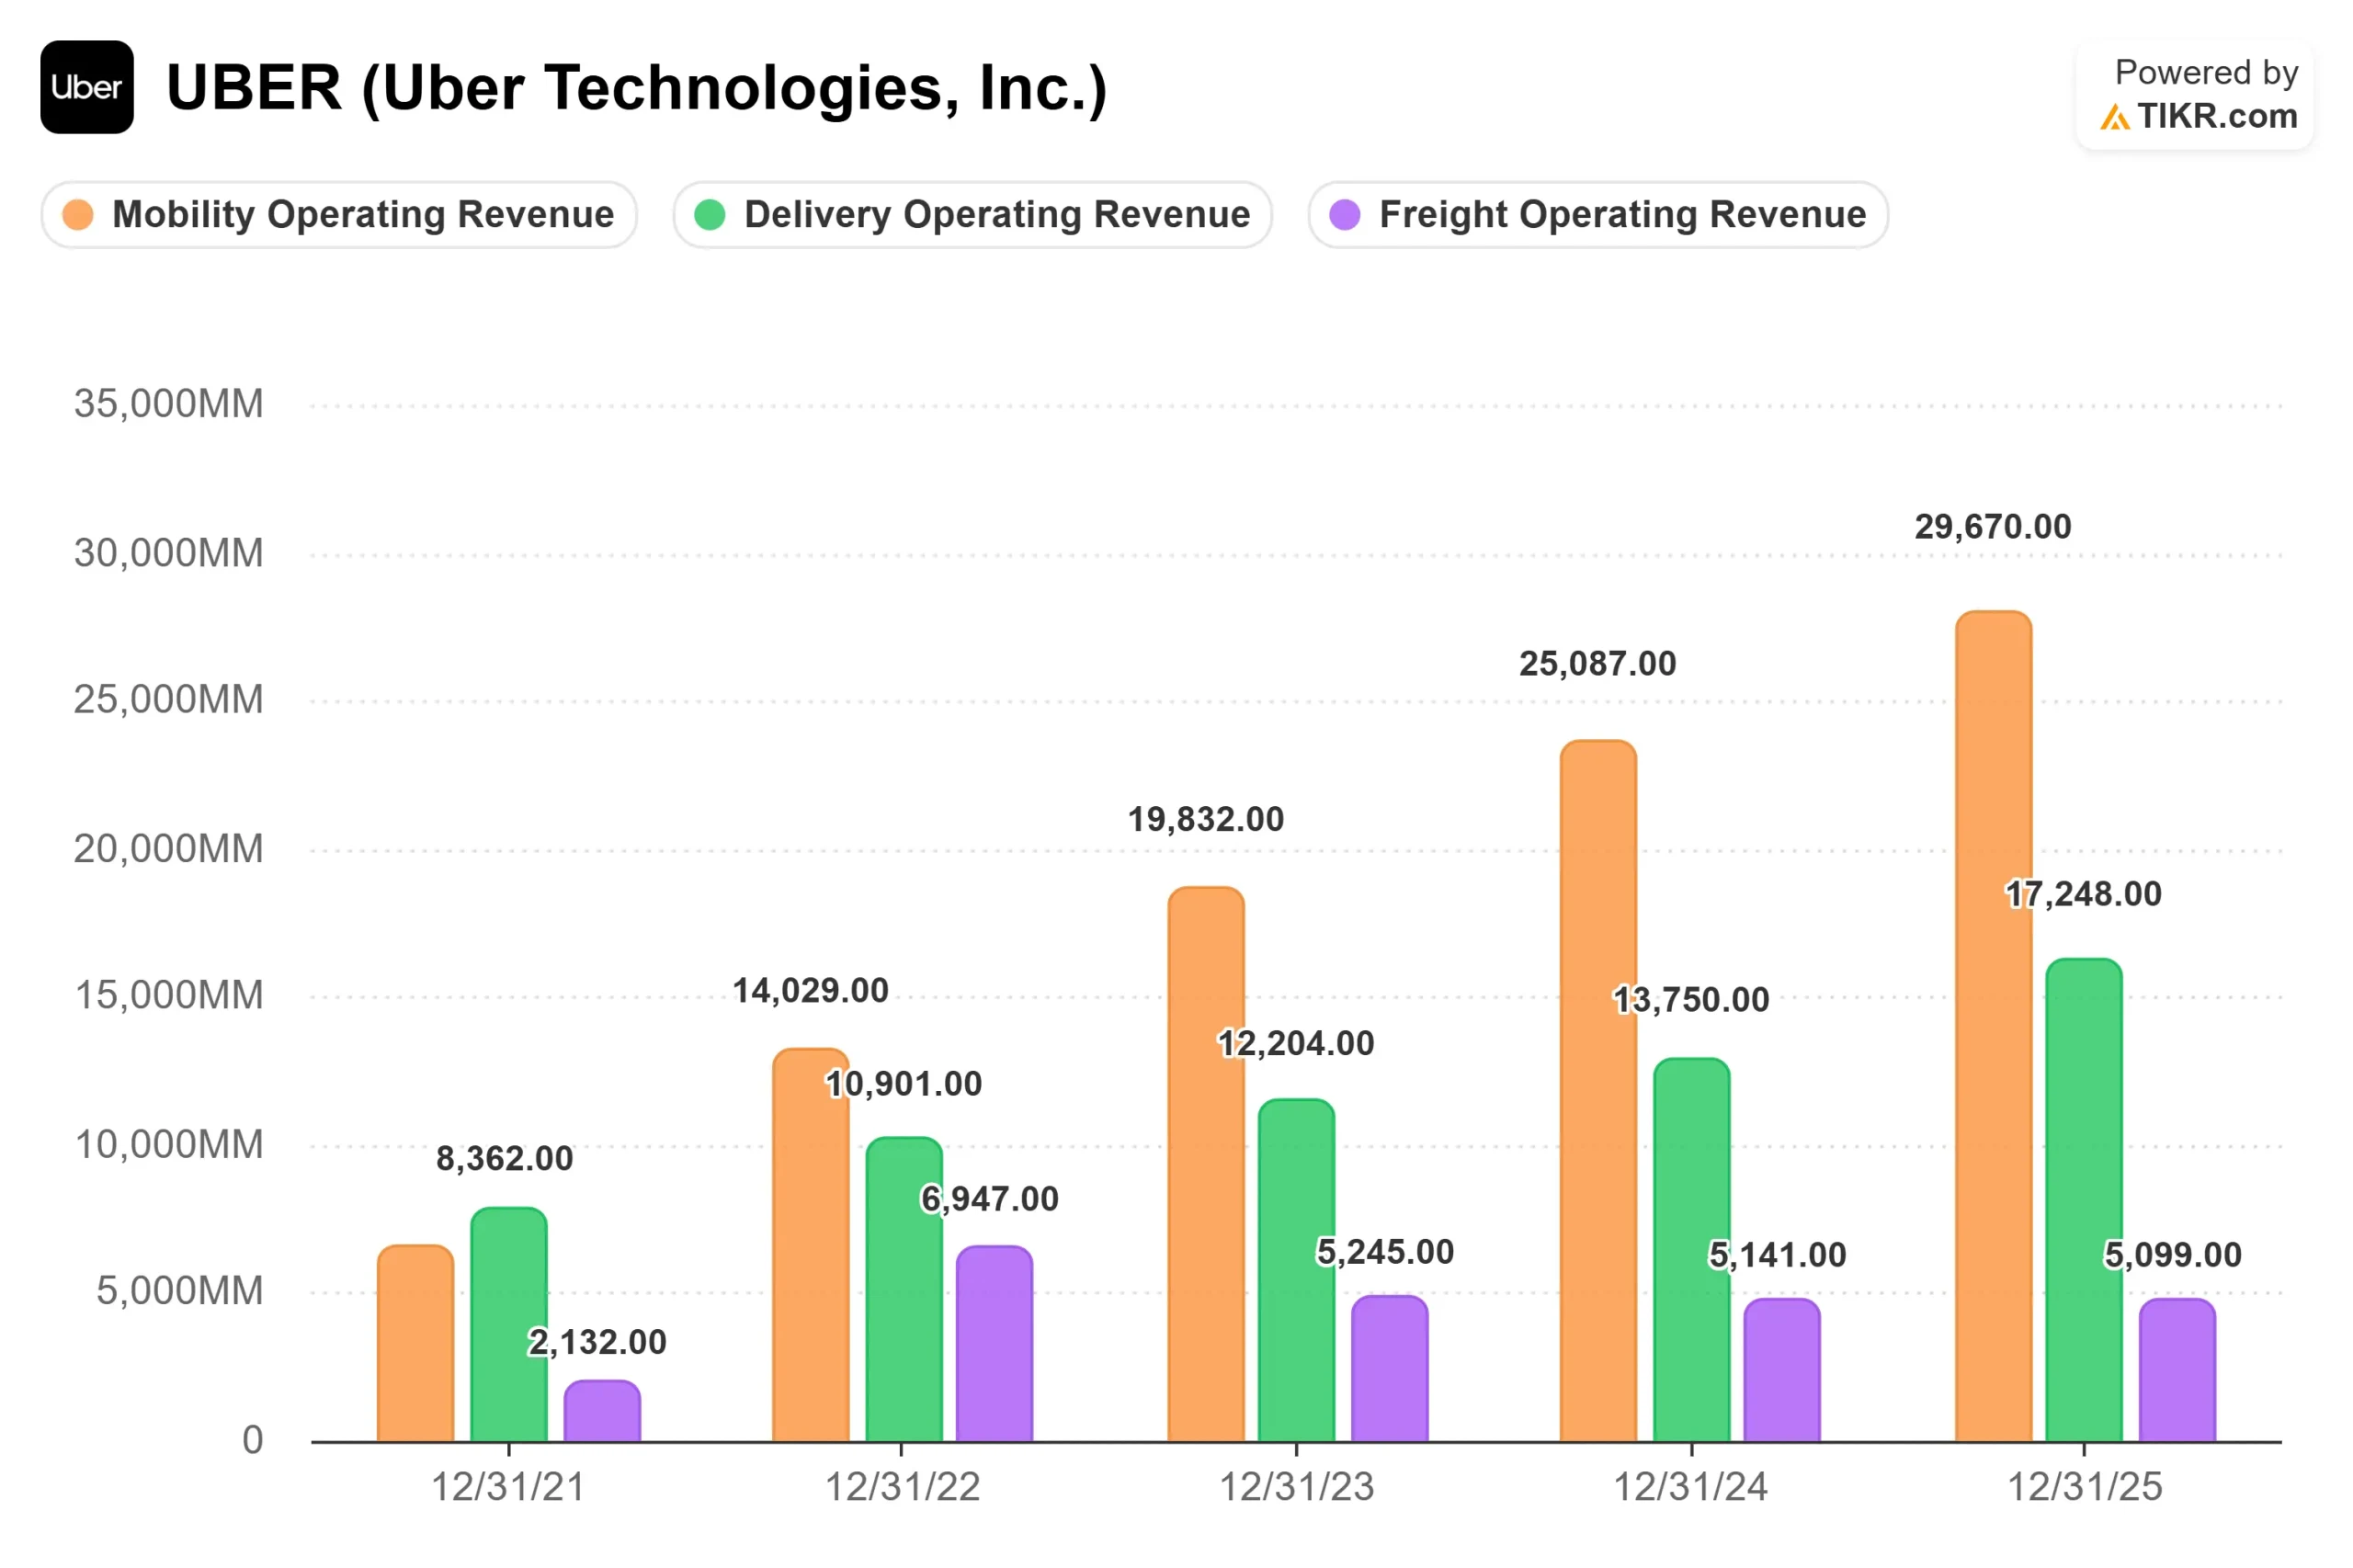
The gap between Uber’s operating results and its share price in 2026 has been striking. For fiscal 2025, Uber reported $52.0 billion in total revenue, up 18.3% year over year, with Mobility contributing $29.7 billion and Delivery adding $17.2 billion. EBITDA reached $8.7 billion for the year, up 34.6%, and free cash flow came in at $9,763 million, an 18.8% margin on revenue.
Going into Q1 2026, Uber guided gross bookings to $52.0 billion to $53.5 billion and adjusted EBITDA to $2.37 billion to $2.47 billion guidance issued at the Q4 2025 earnings call. Street consensus for revenue sat at approximately $13.27 billion, up roughly 15% year over year. The sequential step-down from Q4 2025’s $14.4 billion reflects normal seasonality, not structural deceleration.
The prior quarter’s earnings reaction is instructive. When Uber reported Q4 2025 results on February 4, 2026, the stock rose 1.75% despite adjusted EPS of $0.71 coming in below the $0.79 consensus estimate. Actual revenue of $14,366 million beat the $14,322.67 million average estimate. The market looked past the EPS miss because cash generation told the stronger story.
See historical and forward estimates for Uber stock (It’s free!) >>>
The Super-App Expansion
While AV dominates the narrative, Uber made two significant platform moves in the past 30 days that broaden its revenue ceiling. On April 29, 2026, Uber launched a partnership with Expedia Group, allowing U.S. customers to book hotels directly in the Uber app, with access to more than 700,000 properties globally. Uber One members earn 10% back in credits on bookings and unlock savings on a rotating list of more than 10,000 hotels.
Uber also agreed to acquire SpotHero, the leading North American parking reservation app covering more than 13,000 locations across more than 400 cities, with the deal expected to close in the first half of 2026. CFO Balaji Krishnamurthy cited SpotHero by name at the Morgan Stanley Technology, Media and Telecom Conference on March 2, 2026, as a textbook example of Uber’s “bolt-on” acquisition strategy.
Both moves matter for the same underlying reason. Per Krishnamurthy’s March 2026 conference remarks, users who engage across both Mobility and Delivery generate 3x the gross bookings and profits of single-product users. Grocery and retail consumers show 3x higher order frequency than food-only delivery users. Yet only 20% of Uber’s monthly active platform consumers currently engage across both sides of the platform, and grocery penetration sits below 10% of first-time delivery users. Hotels and parking extend that conversion surface into higher average transaction values.
See how Uber performs against its peers in TIKR (It’s free!) >>>
What the AV Data Actually Shows
The autonomous vehicle debate around Uber generates more fear than the operational data supports. Per management’s remarks at the March 2026 Morgan Stanley conference, Waymo rides on Uber’s network in Austin and Atlanta have shown 30% higher vehicle utilization, 25% faster estimated arrival times, and lower consumer-side prices than standalone first-party AV deployments. Both cities have become among the fastest-growing Uber markets in the U.S., not despite AV deployment, but because of it.
The mechanism is supply-driven. More supply means more affordable rides and faster arrivals, which grows the total ride-hailing category rather than shifting share away from Uber.Waymo launched exclusively on Uber in Austin in March 2025 and in Atlanta in June 2025, with average Austin rider ratings of 4.9 stars.
Krishnamurthy also addressed the international AV opportunity at the same conference. By the end of 2026, Uber targets up to 15 cities with active AV deployments on its network, with roughly half in international markets. Chinese partners Baidu, WeRide, and Pony operate at hardware and software cost points management described as lower than any Western alternative, and they have no reluctance to scale through a third-party platform like Uber. That combination of lower cost and faster willingness to deploy creates an international AV advantage that the current valuation does not appear to price in.
On the bear case that AV supplier concentration will eventually erode Uber’s take rate, Krishnamurthy’s structural counterargument: OEMs have every incentive to avoid single-source software dependency, geopolitical pressures will promote regional AV champions, and even the fastest-growing AV deployments today are tripling volumes annually, compared to the 9x–10x scaling Uber itself achieved in its early years. The regulatory and infrastructure gating factors slow the winner-take-all curve in AVs far more than in ride-hailing.
TIKR Advanced Model Analysis
- Current Price: $72.95
- Target Price (Mid): ~$187
- Potential Total Return: ~157%
- Annualized IRR: ~22% / year

See analysts’ growth forecasts and price targets for Uber stock (It’s free!) >>>
The TIKR mid-case uses approximately 10% revenue CAGR through 12/31/30, which is conservative relative to Uber’s 18.3% actual growth in FY2025. The two revenue drivers are Mobility, expanding in non-top-20 U.S. markets that are growing 1.5x faster than dense core markets per management’s March conference remarks, and Delivery, which operates in only about 32 to 33 countries today versus Mobility’s 75. The margin driver is net income expansion toward approximately 16% in the mid case, up from 10.0% in FY2025. The primary risk is that AV infrastructure investment front-runs its revenue contribution, compressing margins before monetization catches up.
The Street is more conservative. The mean analyst target of $104 implies around 43% upside, with 36 Buys and 10 Outperforms against 7 Holds and just 1 Sell among analysts with active ratings. At the March 2026 Morgan Stanley conference, Krishnamurthy stated the company believes the stock is dislocated and is being aggressive with buybacks at current levels.
Conclusion
The single number to watch in today’s Q1 2026 report is adjusted EBITDA versus the $2.37 billion to $2.47 billion guidance range. A beat alongside a raised full-year outlook would confirm that margin expansion is holding even as Uber accelerates investment across AV, the Expedia hotel partnership, and SpotHero. Uber generated $9,763 million in free cash flow in fiscal 2025. The question today is whether Q1 gives investors enough to start re-rating that earnings power.
See what stocks billionaire investors are buying so you can follow the smart money with TIKR.
Should You Invest in Uber?
The only way to really know is to look at the numbers yourself. TIKR gives you free access to the same institutional-quality financial data that professional analysts use to answer exactly that question.
Pull up Uber, and you’ll see years of historical financials, what Wall Street analysts expect for revenue and earnings in the quarters ahead, how valuation multiples have moved over time, and whether price targets are trending up or down.
You can build a free watchlist to track Uber alongside every other stock on your radar. No credit card required. Just the data you need to decide for yourself.
Looking for New Opportunities?
- See what stocks billionaire investors are buying so you can follow the smart money.
- Analyze stocks in as little as 5 minutes with TIKR’s all-in-one, easy-to-use platform.
- The more rocks you overturn… the more opportunities you’ll uncover. Search 100K+ global stocks, global top investor holdings, and more with TIKR.
Disclaimer:
Please note that the articles on TIKR are not intended to serve as investment or financial advice from TIKR or our content team, nor are they recommendations to buy or sell any stocks. We create our content based on TIKR Terminal’s investment data and analysts’ estimates. Our analysis might not include recent company news or important updates. TIKR has no position in any stocks mentioned. Thank you for reading, and happy investing!