Key Takeaways
- Carnival’s fiscal Q2 2026 net income rose more than 20% year over year to $569 million, beating its own March guidance by $0.07 per share, even as full year yield growth guidance was cut by roughly 100 basis points on Middle East related weakness in European sailings.
- Management said cost discipline, not demand, closed the gap: cruise costs excluding fuel came in essentially flat year over year, an offset large enough that full year EPS guidance actually ticked up a penny to $2.22.
- Free cash flow for the quarter ended May 31, 2026 hit $1.76 billion, up from $1.54 billion a year earlier, and the company’s own cited net debt to EBITDA fell from 3.4x at year end 2025 to 3.1x by the end of the second quarter, funding an active buyback and an August redemption of $500 million in 7% notes.
- Operating and EBITDA margins for that same quarter came in roughly flat to slightly below the year ago period, meaning the “record quarter” framing leans more on a bigger revenue base and a smaller share count than on actual margin expansion.
Carnival Corporation’s Record Quarter, and the Guidance Cut Underneath It
Carnival Corporation’s (CCL) Q2 2026 earnings call opened with a familiar refrain: another quarter of records, another beat versus guidance. Net income of $569 million topped March guidance by $100 million, and CFO David Bernstein was explicit about where that outperformance came from. Cruise costs without fuel per Available Lower Berth Day (ALBD) were “essentially flat” year over year, beating guidance by roughly 250 basis points and adding $0.05 per share on its own. Yield growth added only a penny.
That framing matters because the same call delivered a real cut. Full year yield growth guidance dropped by about one percentage point, which Bernstein pegged as a $0.14 per share hit tied to the Middle East conflict’s drag on European itineraries, especially the Mediterranean. Management’s answer was that an “intensified focus on cost management generated an offsetting one percentage point improvement in cruise costs without fuel,” enough to nudge full year EPS guidance up a cent to $2.22 rather than down. CEO Josh Weinstein even called the yield hit “transitory” and pointed to 2027 European bookings running “up year over year in mid teens percentages at higher prices” as proof the underlying demand story hadn’t broken.
That is a specific, testable claim: real cost discipline absorbing a real demand shock, with the balance sheet healthy enough to keep returning capital regardless.
CCL Stock’s Cash and Debt Numbers Back Up the Confidence
On the capital side, the data supports management’s confidence more than it undercuts it.
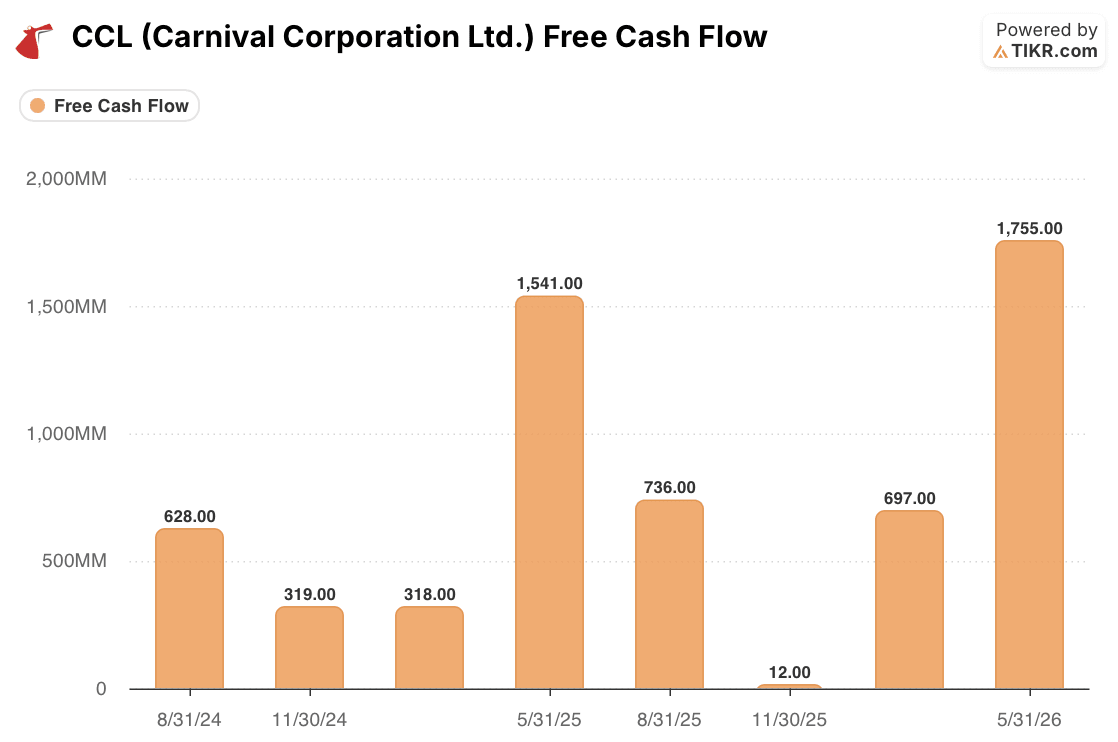
Free cash flow for the quarter ended May 31, 2026 came in at $1.76 billion, up from $1.54 billion in the same quarter last year, and well above the choppier prints in between, including a near-zero $12 million quarter last November that reflects the business’s steep seasonal swings between peak and off-peak sailings. On a year over year, same quarter basis, cash generation is not deteriorating. It is improving.
Leverage tells a similar story once seasonality is accounted for. Bernstein cited net debt to adjusted EBITDA improving from 3.4x at year end 2025 to 3.3x after the first quarter to 3.1x after the second, a trailing measure that smooths out the cruise calendar.

A quarter by quarter view shows more volatility, since annualizing a single low season quarter’s EBITDA can distort the ratio, but the direction inside fiscal 2026 is consistent: leverage eased from 4.50x in the fiscal fourth quarter to 3.55x by the end of the second quarter, a steady decline through the same window the yield guidance was being cut. That cash and debt trajectory is what funded both the $2.5 billion buyback authorization, of which $450 million has been spent, and the August 15 redemption of $500 million in 7% notes at 103.5% of face value. None of that reads like a company quietly bleeding cash while it talks up cost control.
Carnival Corporation’s Margin Line Tells a Different Story
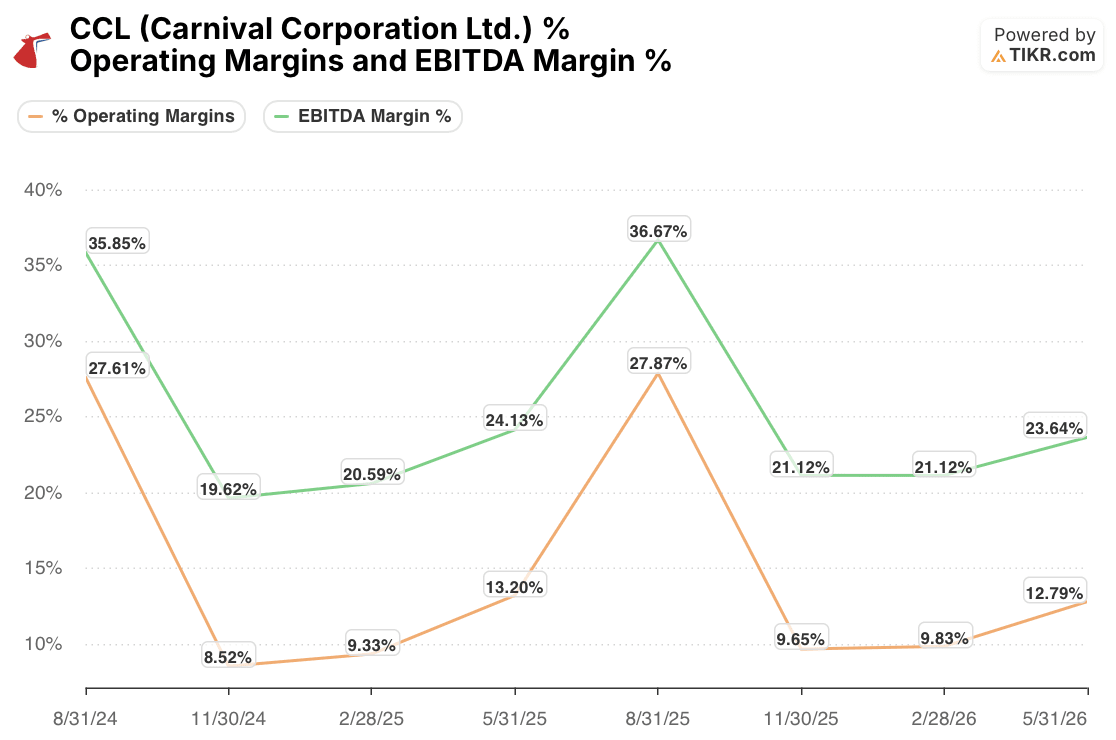
Where the picture gets more complicated is profitability as a share of revenue, which is the part of the story management’s commentary glossed over. Operating margin for the quarter ended May 31, 2026 was 12.79%, and EBITDA margin was 23.64%. Both are slightly below the year ago quarter’s 13.20% and 24.13%. That is a small gap, but it is the wrong direction for a quarter being sold as evidence of structural cost improvement.
The explanation likely sits in fuel. Bernstein noted net income grew more than 20% “despite a nearly 30% increase in our fuel price,” a cost line that sits outside the flat non-fuel cost metric management emphasized. Flat costs per available berth day, layered onto a fuel bill up nearly a third and modest 2.2% yield growth, is consistent with total costs holding roughly even with revenue rather than shrinking against it. In other words, the “beat” this quarter looks driven by a larger fleet generating more absolute revenue and dollars of EBITDA, plus a shrinking share count from the buyback lifting EPS, rather than by the business actually converting a larger share of each cruise ticket into profit.
Bernstein himself conceded that “some of the $0.05 per share cost improvement this quarter was timing of expenses between the quarters,” which cuts against reading the non-fuel cost line as a clean, permanent step change just yet.
What Would Actually Confirm the “Transitory” Call
Carnival’s cash generation and balance sheet trajectory are real and give the company genuine room to keep buying back stock and paying down debt even after trimming its yield outlook, which is more than can be said if the cost story were pure spin. But the margin data complicates the cleaner version of that story, where cost discipline is simply replacing lost yield dollar for dollar.
Right now it looks more like Carnival is growing its way past a geopolitical shock, using scale and a shrinking share count to keep the per share numbers moving up, while the underlying profitability of each voyage has not yet improved.
That distinction will matter most in the next two quarters. If 2027 bookings really are running at record pricing as management claims, and if fuel prices stop climbing at last year’s pace, margins should start expanding again rather than merely holding flat.
If Carnival’s fiscal third quarter, typically its seasonal peak and due to report soon, shows operating margin still lagging its year ago level even as cost per ALBD stays flat, that would be the clearer signal that this is more than a one-quarter fuel headwind, and that the buyback and deleveraging pace, however well funded today, is doing more of the earnings-growth work than the underlying cruise economics are.
Should You Invest in Carnival Corporation Ltd.?
The only way to really know is to look at the numbers yourself. TIKR gives you free access to the same institutional-quality financial data that professional analysts use to answer exactly that question.
Pull up CCL stock and you’ll see years of historical financials, what Wall Street analysts expect for revenue and earnings in the quarters ahead, how valuation multiples have moved over time, and whether price targets are trending up or down.
You can build a free watchlist to track Carnival Corporation Ltd. alongside every other stock on your radar. No credit card required. Just the data you need to decide for yourself.
Access Professional Tools to Analyze CCL stock on TIKR for Free →
Looking for New Opportunities?
- See what stocks billionaire investors are buying so you can follow the smart money.
- Analyze stocks in as little as 5 minutes with TIKR’s all-in-one, easy-to-use platform.
- The more rocks you overturn… the more opportunities you’ll uncover. Search 100K+ global stocks, global top investor holdings, and more with TIKR.
Disclaimer:
Please note that the articles on TIKR are not intended to serve as investment or financial advice from TIKR or our content team, nor are they recommendations to buy or sell any stocks. We create our content based on TIKR Terminal’s investment data and analysts’ estimates. Our analysis might not include recent company news or important updates. TIKR has no position in any stocks mentioned. Thank you for reading, and happy investing!